

Across Species "Natural Ablation" Reveals the Brainstem Source of a Noninvasive Biomarker of Binaural Hearing
- PMID: 30126974
- PMCID: PMC6170984
- DOI: 10.1523/JNEUROSCI.1211-18.2018
Across Species "Natural Ablation" Reveals the Brainstem Source of a Noninvasive Biomarker of Binaural Hearing
Abstract
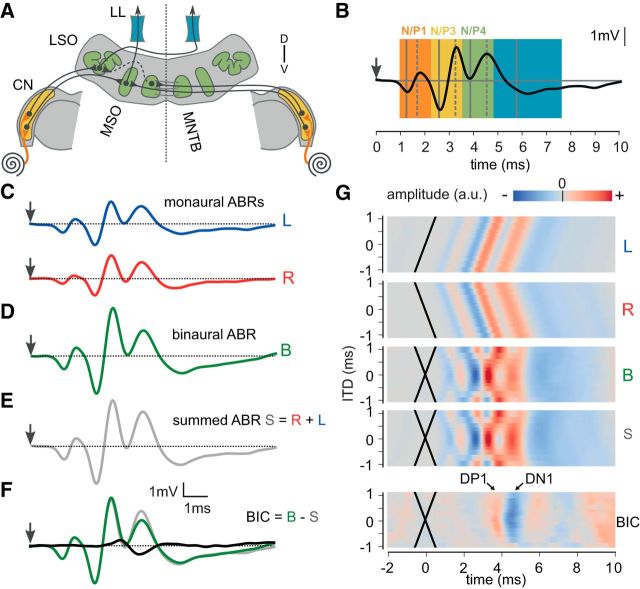
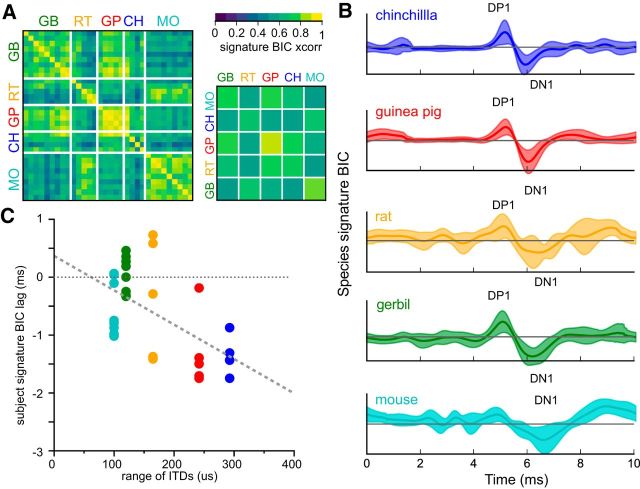
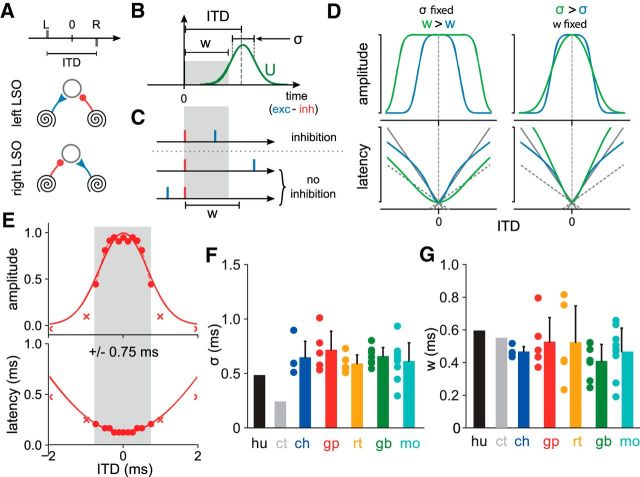
The binaural interaction component (BIC) of the auditory brainstem response is a noninvasive electroencephalographic signature of neural processing of binaural sounds. Despite its potential as a clinical biomarker, the neural structures and mechanism that generate the BIC are not known. We explore here the hypothesis that the BIC emerges from excitatory-inhibitory interactions in auditory brainstem neurons. We measured the BIC in response to click stimuli while varying interaural time differences (ITDs) in subjects of either sex from five animal species. Species had head sizes spanning a 3.5-fold range and correspondingly large variations in the sizes of the auditory brainstem nuclei known to process binaural sounds [the medial superior olive (MSO) and the lateral superior olive (LSO)]. The BIC was reliably elicited in all species, including those that have small or inexistent MSOs. In addition, the range of ITDs where BIC was elicited was independent of animal species, suggesting that the BIC is not a reflection of the processing of ITDs per se. Finally, we provide a model of the amplitude and latency of the BIC peak, which is based on excitatory-inhibitory synaptic interactions, without assuming any specific arrangement of delay lines. Our results show that the BIC is preserved across species ranging from mice to humans. We argue that this is the result of generic excitatory-inhibitory synaptic interactions at the level of the LSO, and thus best seen as reflecting the integration of binaural inputs as opposed to their spatial properties.SIGNIFICANCE STATEMENT Noninvasive electrophysiological measures of sensory system activity are critical for the objective clinical diagnosis of human sensory processing deficits. The binaural component of sound-evoked auditory brainstem responses is one such measure of binaural auditory coding fidelity in the early stages of the auditory system. Yet, the precise neurons that lead to this evoked potential are not fully understood. This paper provides a comparative study of this potential in different mammals and shows that it is preserved across species, from mice to men, despite large variations in morphology and neuroanatomy. Our results confirm its relevance to the assessment of binaural hearing integrity in humans and demonstrates how it can be used to bridge the gap between rodent models and humans.
Keywords: auditory; binaural; brainstem; central processing disorder.
Copyright © 2018 the authors 0270-6474/18/388563-11$15.00/0.
Figures


Similar articles
-
Between-ear sound frequency disparity modulates a brain stem biomarker of binaural hearing.J Neurophysiol. 2019 Sep 1;122(3):1110-1122. doi: 10.1152/jn.00057.2019. Epub 2019 Jul 17. J Neurophysiol. 2019. PMID: 31314646 Free PMC article.
-
Evidence for the origin of the binaural interaction component of the auditory brainstem response.Eur J Neurosci. 2020 Jan;51(2):598-610. doi: 10.1111/ejn.14571. Epub 2019 Nov 6. Eur J Neurosci. 2020. PMID: 31494984
-
Binaural interaction in the auditory brainstem response: a normative study.Clin Neurophysiol. 2015 Apr;126(4):772-9. doi: 10.1016/j.clinph.2014.07.032. Epub 2014 Aug 27. Clin Neurophysiol. 2015. PMID: 25240247 Clinical Trial.
-
The Physiological Basis and Clinical Use of the Binaural Interaction Component of the Auditory Brainstem Response.Ear Hear. 2016 Sep-Oct;37(5):e276-e290. doi: 10.1097/AUD.0000000000000301. Ear Hear. 2016. PMID: 27232077 Free PMC article. Review.
-
Roles of inhibition for transforming binaural properties in the brainstem auditory system.Hear Res. 2002 Jun;168(1-2):60-78. doi: 10.1016/s0378-5955(02)00362-3. Hear Res. 2002. PMID: 12117510 Review.
Cited by
-
The Binaural Interaction Component in Rhesus Macaques (Macaca mulatta).eNeuro. 2021 Dec 16;8(6):ENEURO.0402-21.2021. doi: 10.1523/ENEURO.0402-21.2021. Print 2021 Nov-Dec. eNeuro. 2021. PMID: 34872939 Free PMC article.
-
Age-Related Deficits in Binaural Hearing: Contribution of Peripheral and Central Effects.J Neurosci. 2024 Apr 17;44(16):e0963222024. doi: 10.1523/JNEUROSCI.0963-22.2024. J Neurosci. 2024. PMID: 38395618 Free PMC article.
-
Sensitivity to interaural level and time differences in individuals with autism spectrum disorder.Sci Rep. 2022 Nov 9;12(1):19142. doi: 10.1038/s41598-022-23346-y. Sci Rep. 2022. PMID: 36351979 Free PMC article.
-
The Binaural Interaction Component of the Auditory Brainstem Response Under Precedence Effect Conditions.Trends Hear. 2020 Jan-Dec;24:2331216520946133. doi: 10.1177/2331216520946133. Trends Hear. 2020. PMID: 32808860 Free PMC article.
-
Normative Study of the Binaural Interaction Component of the Human Auditory Brainstem Response as a Function of Interaural Time Differences.Ear Hear. 2021 May/Jun;42(3):629-643. doi: 10.1097/AUD.0000000000000964. Ear Hear. 2021. PMID: 33141776 Free PMC article.
References
Publication types
MeSH terms
Substances
Grants and funding
LinkOut - more resources
Full Text Sources
Other Literature Sources
Molecular Biology Databases
Miscellaneous