

Mitohormesis in Mice via Sustained Basal Activation of Mitochondrial and Antioxidant Signaling
- PMID: 30122556
- PMCID: PMC6221994
- DOI: 10.1016/j.cmet.2018.07.011
Mitohormesis in Mice via Sustained Basal Activation of Mitochondrial and Antioxidant Signaling
Abstract
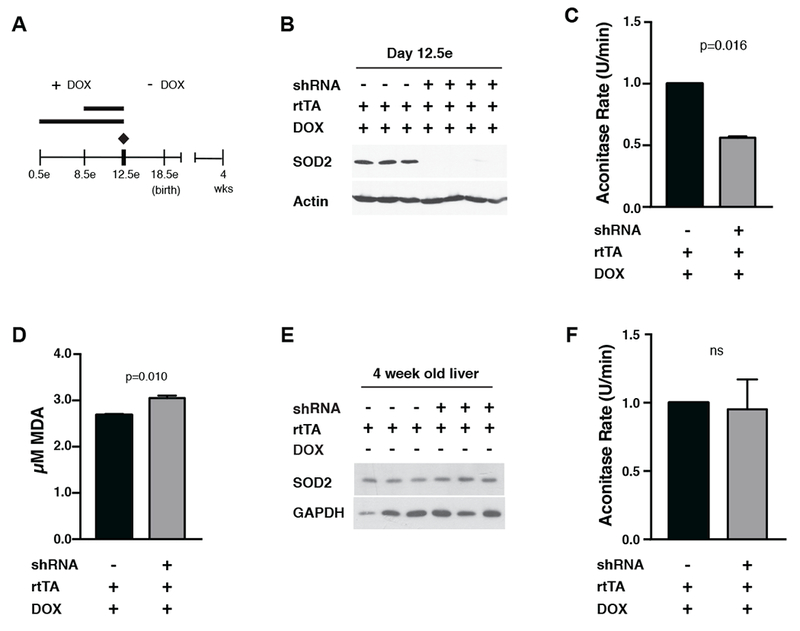
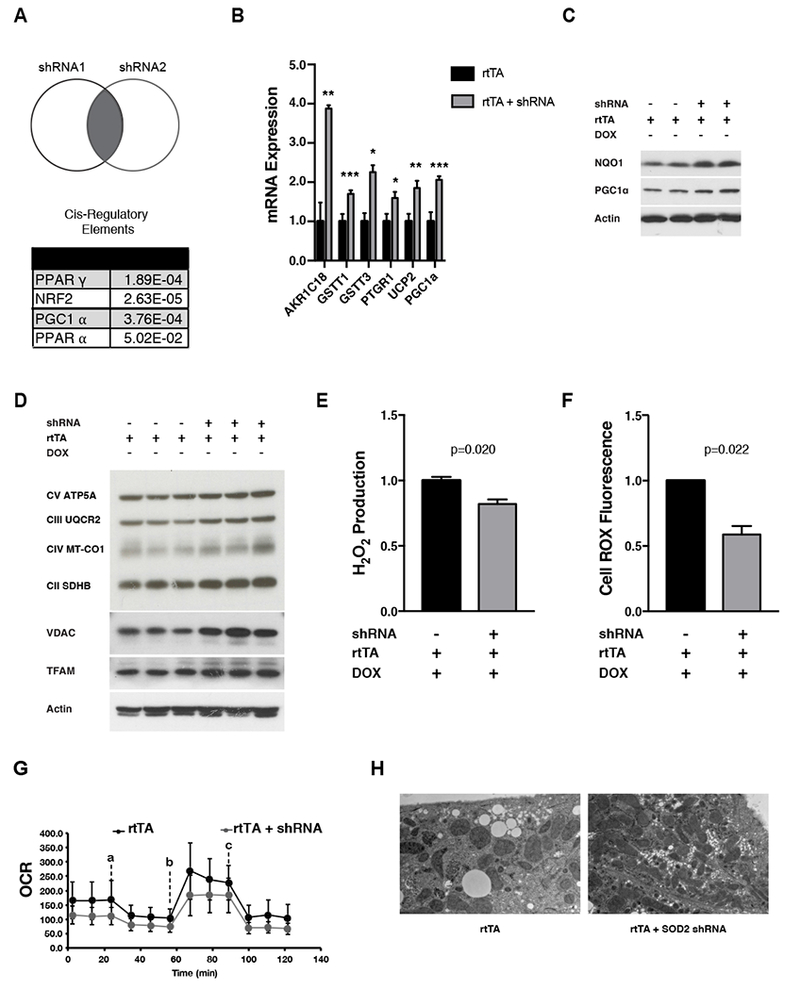
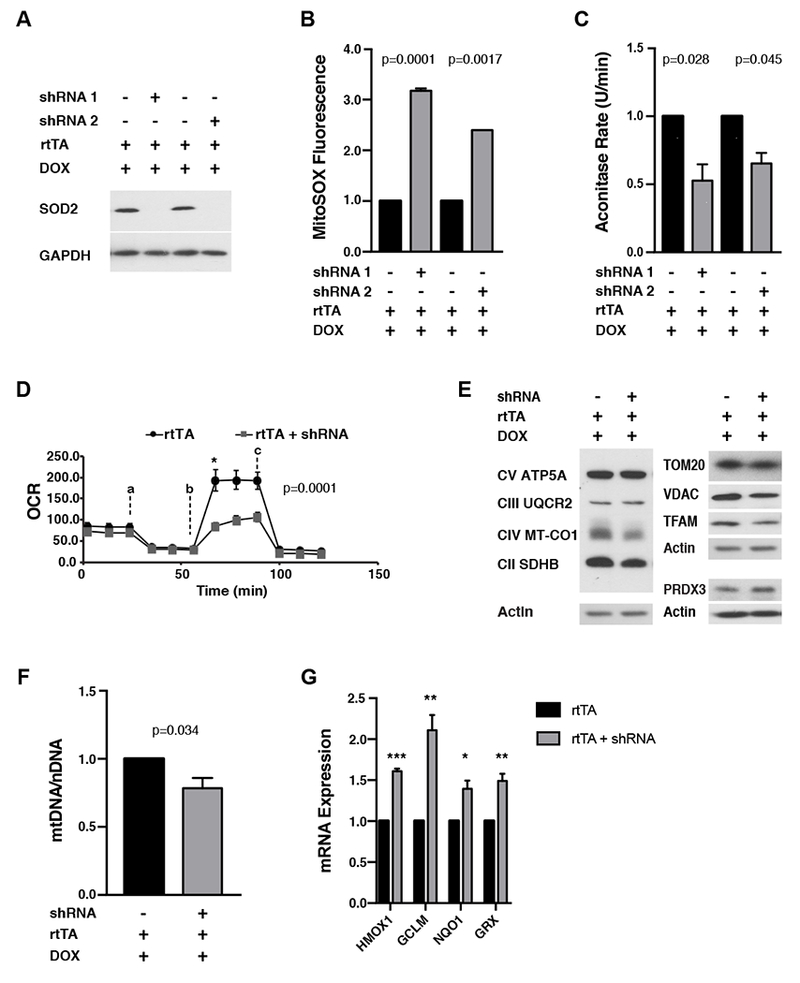
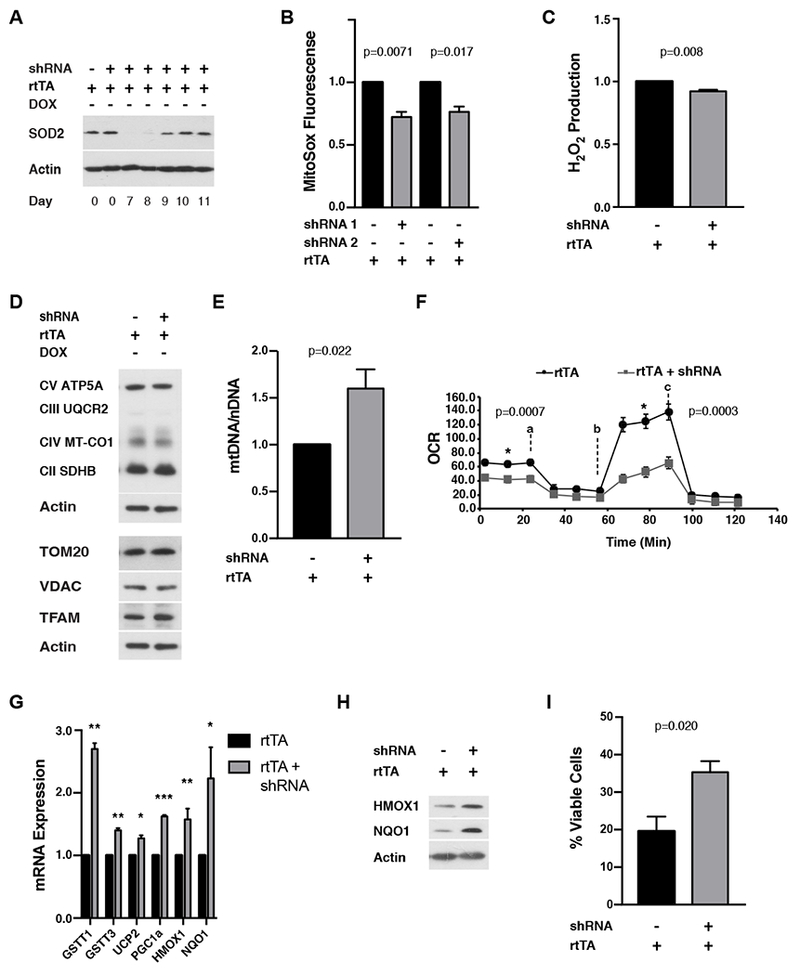
Transient mitochondrial stress can promote beneficial physiological responses and longevity, termed "mitohormesis." To interrogate mitohormetic pathways in mammals, we generated mice in which mitochondrial superoxide dismutase 2 (SOD2) can be knocked down in an inducible and reversible manner (iSOD2-KD mice). Depleting SOD2 only during embryonic development did not cause post-natal lethality, allowing us to probe adaptive responses to mitochondrial oxidant stress in adult mice. Liver from adapted mice had increased mitochondrial biogenesis and antioxidant gene expression and fewer reactive oxygen species. Gene expression analysis implicated non-canonical activation of the Nrf2 antioxidant and PPARγ/PGC-1α mitochondrial signaling pathways in this response. Transient SOD2 knockdown in embryonic fibroblasts from iSOD2-KD mice also resulted in adaptive mitochondrial changes, enhanced antioxidant capacity, and resistance to a subsequent oxidant challenge. We propose that mitohormesis in response to mitochondrial oxidative stress in mice involves sustained activation of mitochondrial and antioxidant signaling pathways to establish a heightened basal antioxidant state.
Keywords: NRF2; PPARγ; hormesis; mitochondria; mtDNA; oxidative stress; reactive oxygen species; signaling; superoxide dismutase.
Copyright © 2018 Elsevier Inc. All rights reserved.
Conflict of interest statement
Figures
Similar articles
-
Acute exercise stress promotes Ref1/Nrf2 signalling and increases mitochondrial antioxidant activity in skeletal muscle.Exp Physiol. 2016 Mar;101(3):410-20. doi: 10.1113/EP085493. Epub 2016 Jan 23. Exp Physiol. 2016. PMID: 26682532
-
Peroxisome proliferator-activated receptor γ co-activator 1-α as a critical co-activator of the murine hepatic oxidative stress response and mitochondrial biogenesis in Staphylococcus aureus sepsis.J Biol Chem. 2014 Jan 3;289(1):41-52. doi: 10.1074/jbc.M113.512483. Epub 2013 Nov 19. J Biol Chem. 2014. PMID: 24253037 Free PMC article.
-
Inhibition of Mitochondrial Oxidative Damage Improves Reendothelialization Capacity of Endothelial Progenitor Cells via SIRT3 (Sirtuin 3)-Enhanced SOD2 (Superoxide Dismutase 2) Deacetylation in Hypertension.Arterioscler Thromb Vasc Biol. 2019 Aug;39(8):1682-1698. doi: 10.1161/ATVBAHA.119.312613. Epub 2019 Jun 13. Arterioscler Thromb Vasc Biol. 2019. PMID: 31189433
-
Roles of oxidative stress, apoptosis, PGC-1α and mitochondrial biogenesis in cerebral ischemia.Int J Mol Sci. 2011;12(10):7199-215. doi: 10.3390/ijms12107199. Epub 2011 Oct 21. Int J Mol Sci. 2011. PMID: 22072942 Free PMC article. Review.
-
Therapeutics against mitochondrial oxidative stress in animal models of aging.Ann N Y Acad Sci. 2002 Apr;959:330-40. doi: 10.1111/j.1749-6632.2002.tb02104.x. Ann N Y Acad Sci. 2002. PMID: 11976207 Review.
Cited by
-
Targeting Cancer with Phytochemicals via Their Fine Tuning of the Cell Survival Signaling Pathways.Int J Mol Sci. 2018 Nov 12;19(11):3568. doi: 10.3390/ijms19113568. Int J Mol Sci. 2018. PMID: 30424557 Free PMC article. Review.
-
Mitochondrial metabolic dysfunction and non-alcoholic fatty liver disease: new insights from pathogenic mechanisms to clinically targeted therapy.J Transl Med. 2023 Jul 28;21(1):510. doi: 10.1186/s12967-023-04367-1. J Transl Med. 2023. PMID: 37507803 Free PMC article. Review.
-
Electromagnetic fields ameliorate hepatic lipid accumulation and oxidative stress: potential role of CaMKKβ/AMPK/SREBP-1c and Nrf2 pathways.Biomed Eng Online. 2023 May 22;22(1):51. doi: 10.1186/s12938-023-01114-x. Biomed Eng Online. 2023. PMID: 37217972 Free PMC article.
-
Hypoxia extends lifespan and neurological function in a mouse model of aging.PLoS Biol. 2023 May 23;21(5):e3002117. doi: 10.1371/journal.pbio.3002117. eCollection 2023 May. PLoS Biol. 2023. PMID: 37220109 Free PMC article.
-
Antioxidant effects of LEDT in dystrophic muscle cells: involvement of PGC-1α and UCP-3 pathways.Photochem Photobiol Sci. 2024 Jan;23(1):107-118. doi: 10.1007/s43630-023-00506-1. Epub 2023 Dec 6. Photochem Photobiol Sci. 2024. PMID: 38057632
References
-
- Biswal MR, Ildefonso CJ, Mao H, Seo SJ, Wang Z, Li H, Le YZ, and Lewin AS (2016). Conditional Induction of Oxidative Stress in RPE: A Mouse Model of Progressive Retinal Degeneration. Retin. Degener. Dis. Mech. Exp. Ther 31–37. - PubMed
-
- Chandel NS (2015). Evolution of Mitochondria as Signaling Organelles. Cell Metab 22, 204–206. - PubMed
Publication types
MeSH terms
Substances
Grants and funding
LinkOut - more resources
Full Text Sources
Other Literature Sources
Molecular Biology Databases
Research Materials
Miscellaneous
