. 2018 Aug 17;9(1):3287.
doi: 10.1038/s41467-018-05770-9.

Galectin-9 suppresses B cell receptor signaling and is regulated by I-branching of N-glycans

Affiliations

Galectin-9 suppresses B cell receptor signaling and is regulated by I-branching of N-glycans

N Giovannone et al. Nat Commun. .

Abstract

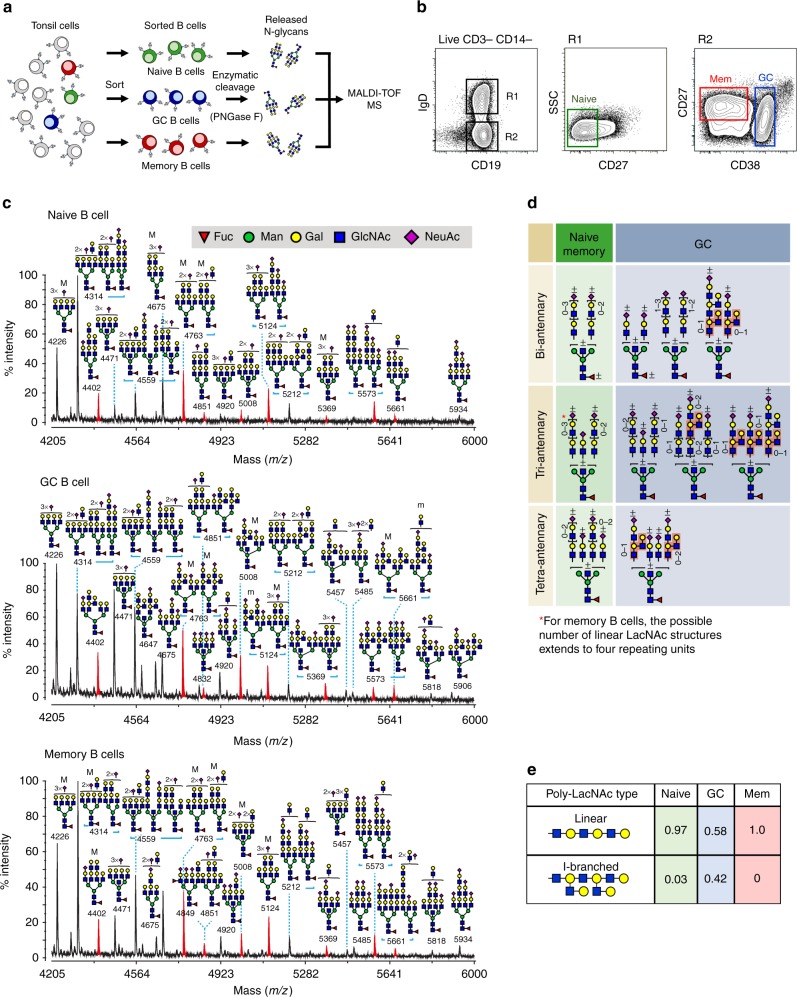
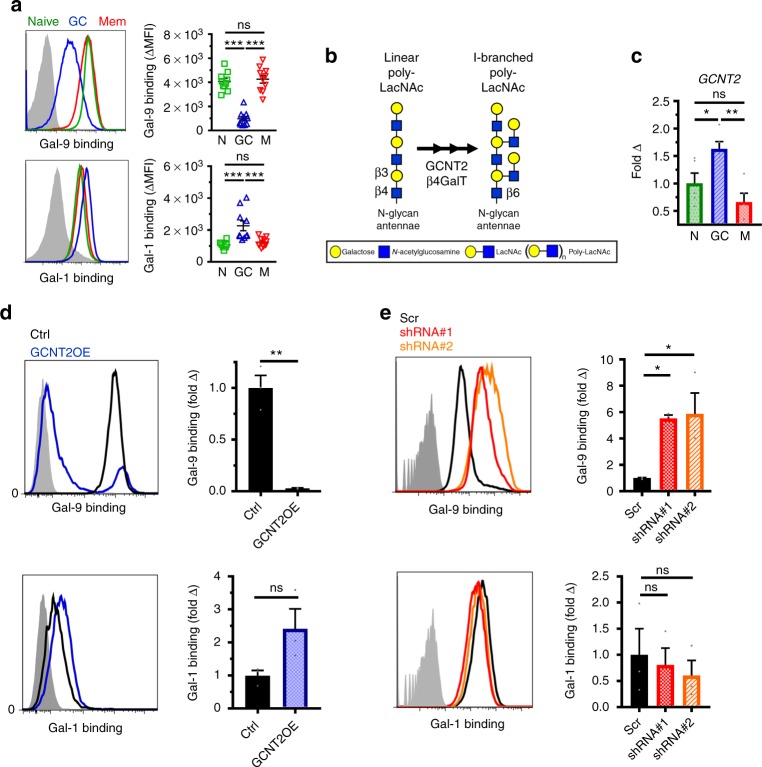
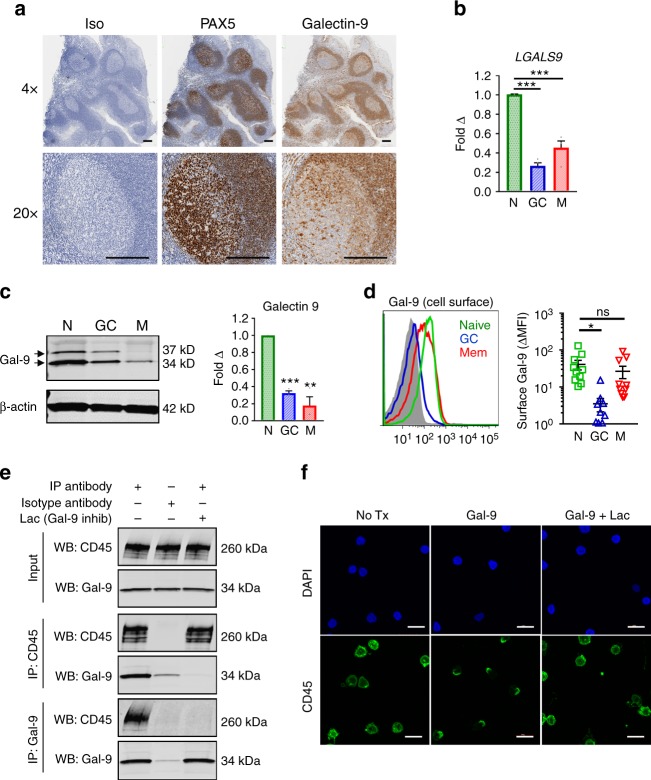
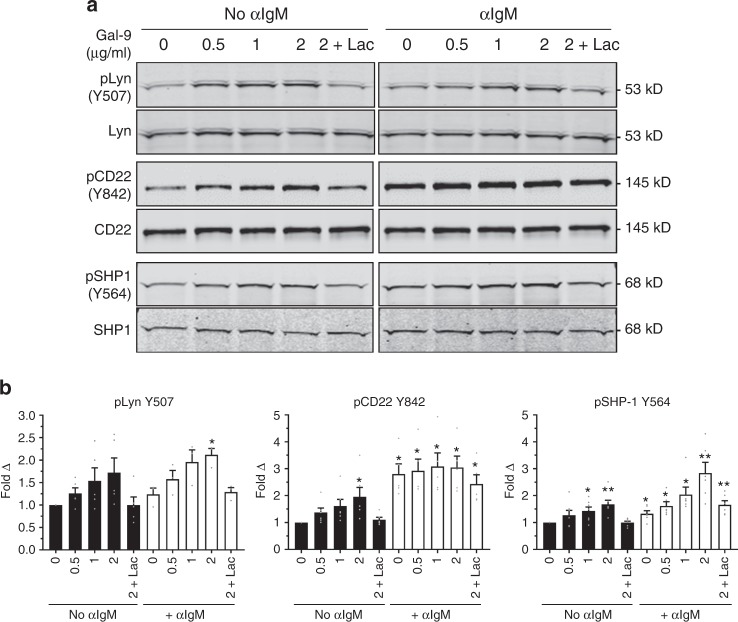
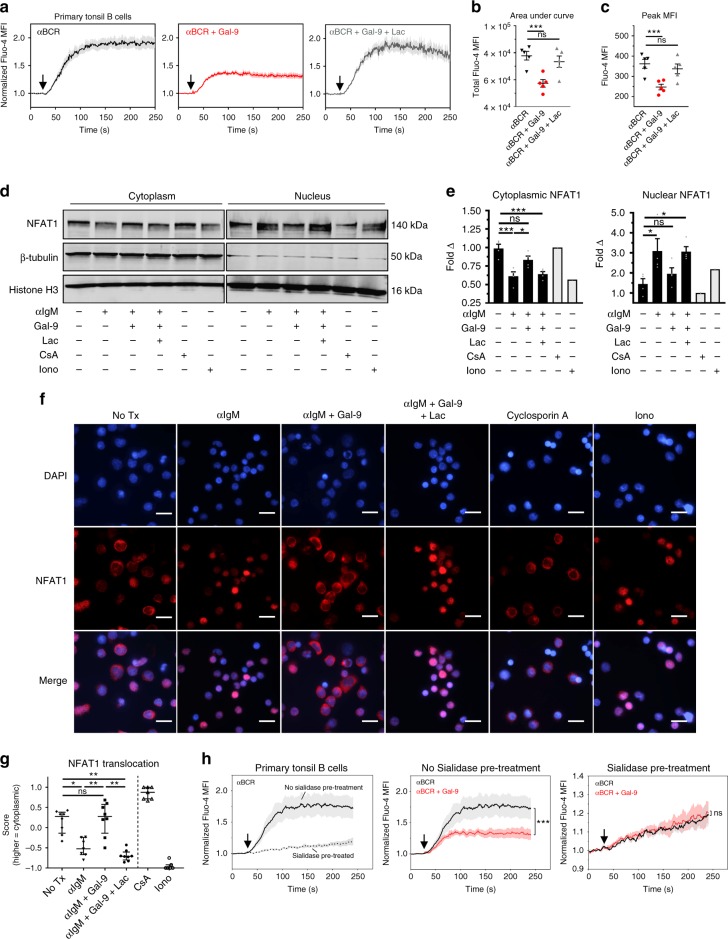
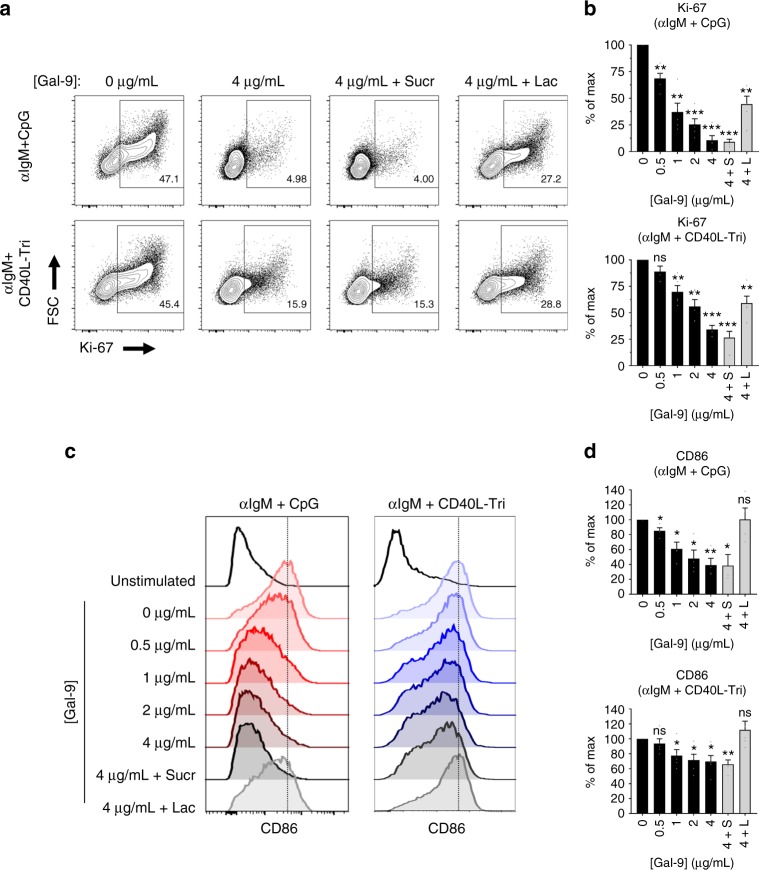
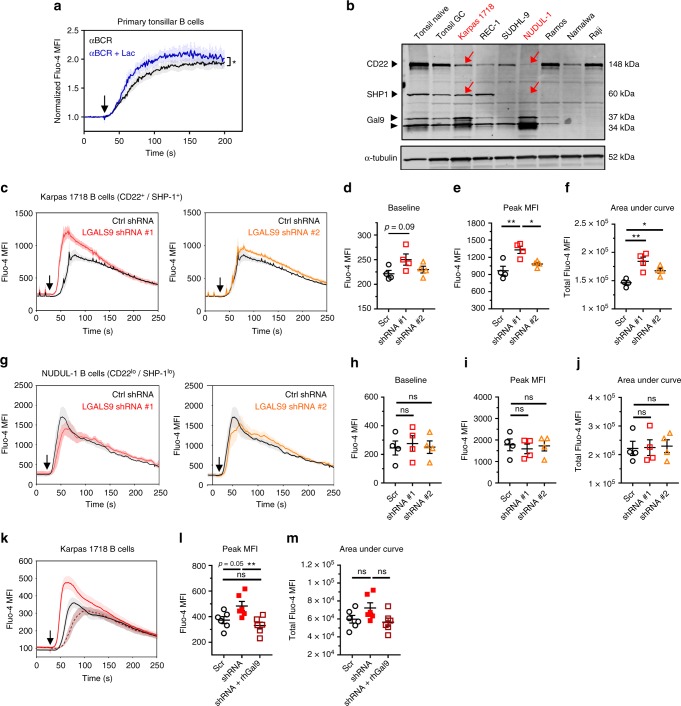
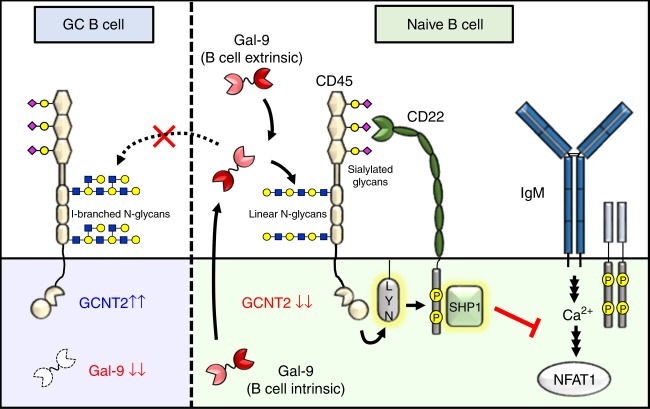
Leukocytes are coated with a layer of heterogeneous carbohydrates (glycans) that modulate immune function, in part by governing specific interactions with glycan-binding proteins (lectins). Although nearly all membrane proteins bear glycans, the identity and function of most of these sugars on leukocytes remain unexplored. Here, we characterize the N-glycan repertoire (N-glycome) of human tonsillar B cells. We observe that naive and memory B cells express an N-glycan repertoire conferring strong binding to the immunoregulatory lectin galectin-9 (Gal-9). Germinal center B cells, by contrast, show sharply diminished binding to Gal-9 due to upregulation of I-branched N-glycans, catalyzed by the β1,6-N-acetylglucosaminyltransferase GCNT2. Functionally, we find that Gal-9 is autologously produced by naive B cells, binds CD45, suppresses calcium signaling via a Lyn-CD22-SHP-1 dependent mechanism, and blunts B cell activation. Thus, our findings suggest Gal-9 intrinsically regulates B cell activation and may differentially modulate BCR signaling at steady state and within germinal centers.


Conflict of interest statement

The authors declare no competing interests.

Figures

Fig. 1
Fig. 1
The naive to GC B cell transition is characterized by remodeling of poly-N-acetyllactosaminyl N-glycans (poly-LacNAc) from linear to I-branched. a Schematic of procedure for N-glycome analysis by MS. Human tonsil naive, GC, and memory B cells were sorted by flow cytometry before treatment with PNGase F to enzymatically release N-glycans, which were subsequently processed for MALDI-TOF MS. b Gating strategy for flow cytometric sorting and analysis of B cell subsets. c Partial MALDI-TOF mass spectra of N-glycans from B cells sorted as in b. Note the presence of repeating N-acetylglucosamine/galactose (LacNAc) units on multiple N-glycan antennae, and the additional LacNAc I-branches found on high mass N-glycans of GC B cells (compare red peaks). Structures outside a bracket have not been unequivocally defined. “M” and “m” designations indicate major and minor abundances, respectively. Full methods and complete spectra can be found in Supplementary Information. d Summary of proposed N-glycan structures present on naive, GC, and memory B cells. Naive and memory B cells are depicted together due to similar N-glycomic features. I-branches are shaded red. A “+/−” signifies that the structure can be found with or without the indicated modification. Numbers indicate number of possible LacNAc units. e Relative quantification of linear vs. I-branched poly-LacNAcs in naive, GC, and memory B cells. Data were computed from common ions found on all B cells and detected at m/z 4402, 4675, 4763, 5124, 5212, 5573. For naive and GC B cells, data in ce depict one of two experiments, each from a distinct tonsil specimen, with similar results. Data from memory B cells are from a single tonsil specimen from a single experiment
Fig. 2
Fig. 2
The immunomodulatory lectin Gal-9 strongly binds naive and memory B cells but is inhibited in GC B cells by I-branching of N-glycans. a Representative histograms (left) and quantification (right) of recombinant Gal-9 (top) and Gal-1 (bottom) by flow cytometry to tonsillar naive, GC, and memory B cells ex vivo. Gray histogram represents staining in the presence of 100 mM lactose, a competitive inhibitor of galectin binding. b Schematic of reported I-branch activity of the glycosyltransferase GCNT2 on N-glycans. GCNT2 initiates I-branching via transfer of an N-acetylglucosamine in a β1,6 linkage, followed by subsequent galactosylation by β1,4 galactosyltransferases (β4GalTs). c Quantitative real-time reverse-transcription PCR (qRT-PCR) analysis of GCNT2 gene expression in human B cell subsets sorted as in Fig. 1b and Supplementary Fig. 1. d Representative histograms (left) and quantification (right) of recombinant Gal-9 (top) and Gal-1 (bottom) binding by flow cytometry to control (GFP-transduced) or GCNT2-transduced overexpression variant NUDUL-1 B cells. Gray histograms represent Gal-1 or Gal-9 staining in the presence of 100 mM lactose. e Representative histograms (left) and quantification (right) of recombinant Gal-9 (top) and Gal-1 (bottom) binding by flow cytometry to Ramos B cells transduced with control shRNA (Scr) or shRNAs targeting GCNT2. For a, n = 10, where each data point represents an individual tonsil specimen, pooled from two independent experiments. For c, n = 5 distinct tonsil specimens pooled from at least three independent experiments. For d and e, n = 3 biological replicates from three independent experiments. For a, c, and d statistics were calculated using one-way ANOVA with correction for multiple comparisons. For e, statistics were calculated using an unpaired, two-tailed t-test. Throughout, bars and error bars depict mean and standard error of the mean (SEM), respectively. ns = not significant, *p< 0.05, **p< 0.01, ***p< 0.001
Fig. 3
Fig. 3
Gal-9 is expressed by naive B cells and binds the glycoprotein CD45. a In situ expression of Gal-9 in human tonsil. Formalin-fixed, paraffin-embedded tonsil sections were stained with Gal-9 antibody, PAX5 antibody (to identify B cells), or isotype control, followed by counterstaining with hematoxylin. Scale bar, 200 μm. b Relative comparison of Gal-9 expression by qRT-PCR of FACS-sorted naive, GC, memory B cells (as in Fig. 1b and Supplementary Fig. 1). Data were normalized to a housekeeping control gene VCP and are shown relative to naive B cells. c Representative western blot (left) quantification (right) of Gal-9 protein expression in lysates of FACS-sorted B cell subsets. Data were normalized to β-actin to control for differences in loading. For Gal-9 blot, the doublet band indicates expression of both medium-length and full-length Gal-9 isoforms. d Representative histogram (left) and quantification (right) of endogenous cell surface Gal-9 detected by ex vivo flow cytometry of unpermeabilized naive, GC, and memory B cells. e Co-immunoprecipitation of Gal-9 and CD45 from naive B cell lysates. Untouched naive B cells were magnetically enriched, labeled with Gal-9 (2 μg mL−1), lysed, and immunoprecipitated/blotted with the indicated antibodies. f Representative immunofluorescence images of CD45 capping following Gal-9 treatment (4 μg mL−1). Scale bar, 10 μm. For a, data are representative of similar results from n = 3 distinct tonsil specimens. For b, n = 4 separate tonsil specimens pooled from more than three independent experiments. For c, n = 3 distinct tonsil specimens pooled from three independent experiments. For d, n = 10, where each data point represents a disparate tonsil specimen pooled from two independent experiments. For e and f, data are representative of three independent experiments using three distinct tonsil specimens. For b and d, statistics were calculated using one-way ANOVA with correction for multiple comparisons. For c, statistics were calculated using a two-tailed, one sample t-test against a hypothetical value of 1. Throughout, bars and error bars depict mean and SEM, respectively. ns = not significant, *p< 0.05, **p< 0.01, ***p< 0.001
Fig. 4
Fig. 4
Gal-9 induces phosphorylation of Lyn, CD22, and SHP-1 in naive B cells. a Representative western blot and b quantification of Lyn, CD22, or SHP-1 phosphorylation at the indicated sites in magnetically enriched naive B cells treated with recombinant Gal-9 at the indicated concentrations in the absence (left blot) or presence (right blot) of anti-IgM F(ab’)2-mediated crosslinking (15 μg mL−1) for 5 min. Blots were subsequently stripped and reprobed with antibody against total protein. Data in b were normalized to respective total protein control and are presented relative to no stimulation control. In all experiments, no IgM and IgM-stimulation lanes were loaded on the same gel and probed on the same blot. For a, data are representative of results from four independent experiments. For b, n = 3 or more distinct tonsil specimens pooled from three or more independent experiments. Statistics were calculated using a one-sample t-test against a hypothetical value of 1. Throughout, bars and error bars depict mean and SEM, respectively. ns = not significant, *p< 0.05, **p< 0.01, ***p< 0.001
Fig. 5
Fig. 5
Gal-9 suppresses BCR-mediated calcium signaling and nuclear translocation of NFAT1. a Flow cytometric measurement of B cell cytoplasmic calcium levels using Fluo-4AM indicator dye following anti-BCR F(ab’)2 treatment (20 μg mL−1) in the presence or absence of recombinant Gal-9 (2.5 μg mL−1) and/or lactose (25 mM). Data shown are gated on CD19+ CD44hi B cells. Mean fluorescence intensities (MFI) were normalized to average MFI of 30 s baseline. Arrow, time of stimulus. b Area under the curve (AUC) and c peak MFI of data presented in a. d Representative western blot and e quantification of NFAT1 nuclear translocation in magnetically enriched naive B cells treated with anti-IgM F(ab’)2 (15 μg mL−1) in the presence or absence of recombinant Gal-9 (2 μg mL−1) before lysis, fractionation, and blotting with NFAT1 Ab. As controls, cells were incubated in lactose (25 mM), cyclosporin A (100 ng mL−1), or ionomycin (1 μM). Blots were reprobed for β-tubulin and Histone H3 as loading and fractionation controls. f Representative immunocytochemistry and g quantification of NFAT1 nuclear translocation in naive B cells treated as in d and e. Scale bar, 10 μm. h Measurement of calcium flux in Arthrobacter ureafaciens sialidase-treated primary B cells, following the indicated stimulus. For a and h, solid line represents mean of five (a) or three (h) tonsil specimens from the same number of experiments. For b and c, n = 5, where each data point represents a distinct specimen pooled from five experiments. For d, data are representative of four experiments. For e, n = 4 specimens pooled from four experiments (CsA and ionomycin, n = 1). For f, data are representative of two experiments. For g, each data point represents average localization score for a single microscopic field (binary scoring of 1 = cytoplasmic or −1 = nuclear). Results are representative of two experiments. For b, c, and e, statistics were calculated using one-way ANOVA with correction for multiple comparisons. For g, a Kruskal–Wallis test was used with Dunn’s correction for multiple comparisons. For h, statistics were calculated using a two-way repeated measures ANOVA using factors “time” and “treatment,” with Bonferroni correction for multiple comparisons. Throughout, bars and error bars depict mean and SEM. ns = not significant, *p< 0.05, **p< 0.01, ***p< 0.001
Fig. 6
Fig. 6
Gal-9 inhibits B cell activation and proliferation. a Representative contour plots and b quantification of naive B cell proliferation 40 h post-activation with either T-independent (anti-IgM F(ab’)2 + unmethylated CpG oligonucleotides + IL-2/4/10) or T-dependent stimulation (anti-IgM F(ab’)2 + recombinant CD40L-trimer + IL-2/4/10/21), in the presence or absence of the indicated concentration of recombinant Gal-9. “4 + L” indicates 4 μg Gal-9 plus 10 mM lactose; “4 + S” indicates 4 μg Gal-9 plus 10 mM sucrose, a non-inhibitory osmolarity control. c Representative histograms and d quantification of CD86 (B7-2) expression on naive B cells 40 h after activation in the presence or absence of Gal-9 at the indicated concentrations, as in b. For a and c, data are representative of five independent experiments. For b and d, n = 5 distinct tonsil specimens pooled from five independent experiments. For b, and d, statistics were calculated using a one-sample t-test against a hypothetical value of 100. Throughout, bars and error bars depict mean and SEM, respectively. ns = not significant, *p< 0.05, **p< 0.01, ***p< 0.001
Fig. 7
Fig. 7
B cell-intrinsic Gal-9 is a negative regulator of BCR calcium signaling. a Flow cytometric assessment of B cell cytoplasmic calcium levels using Fluo-4AM indicator dye following anti-BCR F(ab’)2 stimulation (20 μg mL−1) after 90 min culture in the presence or absence of 25 mM lactose. Depicted are results from CD44hi CD19+ B cells. Mean fluorescence intensities (MFI) over the entire acquisition period were normalized to the average MFI of the 30 s baseline. Arrow, time of stimulus. b Western blot of lysates from indicated primary cells or B cell lines with the specified combination of Abs. c Analysis of calcium flux following anti-BCR F(ab’)2 stimulation (20 μg mL−1) in Karpas 1718 B cells (CD22+ and SHP-1+) transduced with either control shRNA (Scr) or one of two shRNAs against LGALS9. d Pre-stimulation baseline, e peak, or f total calcium flux from experiments presented in c. g Analysis of calcium flux following anti-BCR stimulation (20 μg mL−1) in NUDUL-1 B cells (CD22lo and SHP-1lo) transduced with either control shRNA (Scr) or one of two shRNAs against LGALS9. h Pre-stimulation baseline, i peak, or j total intracellular calcium levels from experiments presented in g. k Analysis of calcium flux following anti-BCR stimulation (20 μg mL−1) as in c, except that 10 μg mL−1 recombinant Gal-9 was co-administered with BCR stimulus where indicated. l Peak or m total intracellular calcium levels from experiments presented in k. For a, c, g, and k, the solid line represents the mean and shaded error bars represent SEM from five (a), four (c and g), or six (k) different biological replicates pooled from the same number of independent experiments. For df and hj, n = 4, where data points depict biological replicates pooled from four independent experiments. For lm, n = 6, where data points depict biological replicates pooled from six independent experiments. For a, statistics were calculated using a two-way repeated measures ANOVA using factors “time” and “treatment,” with Bonferroni correction for multiple comparisons. For df, hj, and lm, statistics were calculated using one-way ANOVA with correction for multiple comparisons. Throughout, bars and error bars depict mean and SEM, respectively. ns = not significant, *p< 0.05, **p< 0.01, ***p< 0.001
Fig. 8
Fig. 8
Proposed role of Gal-9 and I-branches in the regulation of BCR signaling in naive B cells vs. GC B cells. In naive B cells (right), Gal-9 is expressed at high levels and secreted into the microenvironment by an unconventional mechanism. Autologously, or exogenously, produced Gal-9 binds poly-LacNAc-containing N-glycans on CD45, which are predominantly of the linear type due to low expression of the I-branching glycosyltransferase GCNT2. Gal-9 binding to CD45 activates Lyn (by an undetermined mechanism), which subsequently phosphorylates tyrosine residues in CD22 ITIMs and recruits the protein tyrosine phosphatase SHP-1. SHP-1 phosphatase activity dampens cytoplasmic calcium levels, including calcium accumulation in response to BCR engagement, possibly through its reported ability to activate B cell calcium efflux pumps. Diminished intracellular calcium levels results in decreased nuclear translocation and activity of NFAT1 and other calcium sensitive signaling factors, ultimately inhibiting B cell activation. By contrast, Gal-9 activity is downmodulated in GC B cells (left) via the combined downregulation of Gal-9 protein and upregulation of GCNT2, which disfavors Gal-9 binding by modifying N-glycan poly-LacNAcs with I-branches

Similar articles

Cited by

References

    1. Mesin L, Ersching J, Victora GD. Germinal center B cell dynamics. Immunity. 2016;45:471–482. doi: 10.1016/j.immuni.2016.09.001. - DOI - PMC - PubMed
    1. Corcoran LM, Tarlinton DM. Regulation of germinal center responses, memory B cells and plasma cell formation-an update. Curr. Opin. Immunol. 2016;39:59–67. doi: 10.1016/j.coi.2015.12.008. - DOI - PubMed
    1. Marth JD, Grewal PK. Mammalian glycosylation in immunity. Nat. Rev. Immunol. 2008;8:874–887. doi: 10.1038/nri2417. - DOI - PMC - PubMed
    1. Johnson JL, Jones MB, Ryan SO, Cobb BA. The regulatory power of glycans and their binding partners in immunity. Trends Immunol. 2013;34:290–298. doi: 10.1016/j.it.2013.01.006. - DOI - PMC - PubMed
    1. Dimitroff CJ. Galectin-binding O-glycosylations as regulators of malignancy. Cancer Res. 2015;75:3195–3202. doi: 10.1158/0008-5472.CAN-15-0834. - DOI - PMC - PubMed

Publication types

MeSH terms