. 2018 Aug 15;9(1):3263.
doi: 10.1038/s41467-018-05506-9.

Gene essentiality landscape and druggable oncogenic dependencies in herpesviral primary effusion lymphoma

Affiliations

Gene essentiality landscape and druggable oncogenic dependencies in herpesviral primary effusion lymphoma

Mark Manzano et al. Nat Commun. .

Abstract

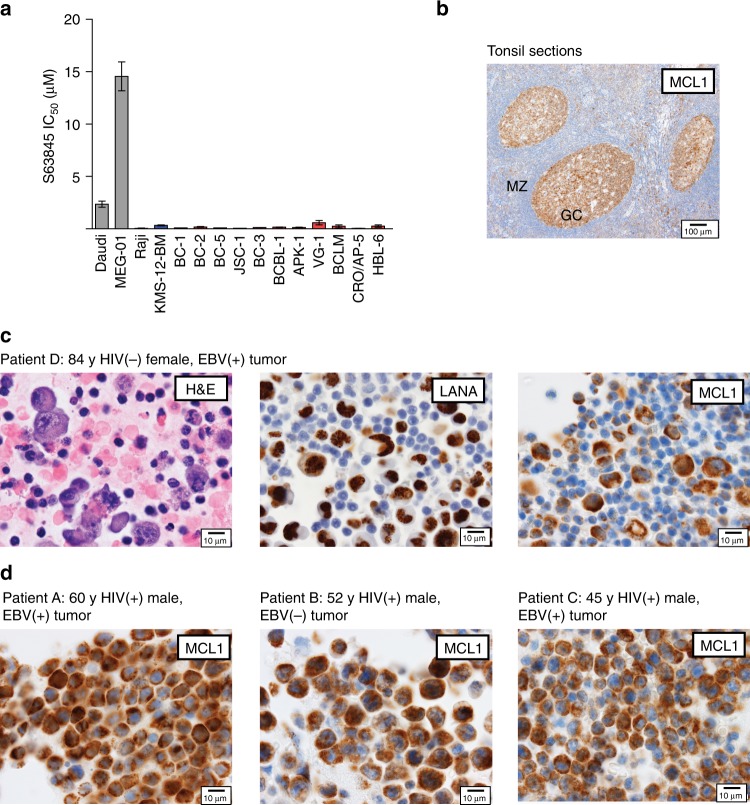
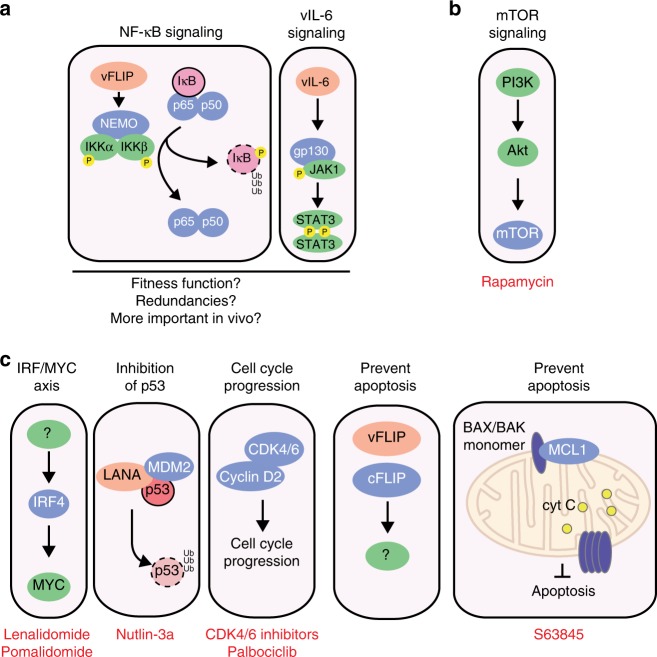
Primary effusion lymphoma (PEL) is caused by Kaposi's sarcoma-associated herpesvirus. Our understanding of PEL is poor and therefore treatment strategies are lacking. To address this need, we conducted genome-wide CRISPR/Cas9 knockout screens in eight PEL cell lines. Integration with data from unrelated cancers identifies 210 genes as PEL-specific oncogenic dependencies. Genetic requirements of PEL cell lines are largely independent of Epstein-Barr virus co-infection. Genes of the NF-κB pathway are individually non-essential. Instead, we demonstrate requirements for IRF4 and MDM2. PEL cell lines depend on cellular cyclin D2 and c-FLIP despite expression of viral homologs. Moreover, PEL cell lines are addicted to high levels of MCL1 expression, which are also evident in PEL tumors. Strong dependencies on cyclin D2 and MCL1 render PEL cell lines highly sensitive to palbociclib and S63845. In summary, this work comprehensively identifies genetic dependencies in PEL cell lines and identifies novel strategies for therapeutic intervention.


Conflict of interest statement

The authors declare no competing interests.

Figures

Fig. 1
Fig. 1
Genome-wide CRISPR knockout screens in PEL cell lines. a Experimental outline. Cas9-expressing cell pools or clones were infected with the lentiviral GeCKO v2 or Brunello sgRNA libraries. After complete puromycin selection, cells were split every 2–3 days and maintained at 500× sgRNA coverage. After 14–18 days, sgRNA composition was analyzed by Illumina sequencing and MAGeCK. b Cell lines and conditions used in this study. c Numbers of genes with significantly depleted sgRNAs in each screen (adj. p value < 0.05). “G” indicates cells were screened with GeCKO v2 library; all others were screened with Brunello. Cyan: EBV(+) PEL cells; blue: EBV(−) PEL cells; red: multiple myeloma; purple: Burkitt’s lymphoma. d Representative gene set enrichment analysis (GSEA) from BCBL-1 Cas9 clone screened using Brunello library. Genes were ranked by sgRNA depletion scores, with genes with depleted sgRNAs at the right end of the x-axis. NES normalized enrichment score, FDRq FDR-adjusted p value. e Heatmap of GSEA NESs of housekeeping pathways (Reactome) in all PEL cell lines (see Supplementary Data 7). Screens designated “G” used GeCKO v2 library. f Principal component analysis of normalized sgRNA reads from EBV(−) (blue shades) or EBV(+) PEL cells (red shades). sgRNAs from genes that have adj. p < 0.05 in at least one cell line were examined. Only data from Brunello screens were considered
Fig. 2
Fig. 2
Genetic dependencies of PEL cell lines. a Significance of dependency of all genes screened by Brunello library in 8 PEL cell lines. Genes are ranked using the median adj. p value scores (FDR). A large majority of genes, including those involved in NF-κB (e.g., RELA, NFKB1, and IKBKG) and cytokine signaling (e.g., STAT3 and JAK1), score as dispensable in PEL cells. Genes in yellow are considered housekeeping genes, non-housekeeping genes are in pink. Ranks among PSODs are in parentheses. b Workflow and criteria for classifying “housekeeping genes” and “PEL gene dependencies”, based on CRISPR screens in this study and 52 publicly available screens. PEL gene dependencies that do not have housekeeping functions are further considered “PEL-specific oncogene dependencies” (PSODs). c Pathway enrichment analysis of PSODs using DAVID for gene sets from GO (orange) or KEGG (blue). Number of genes included in each enriched pathway is indicated. Full results are in Supplementary Data 11
Fig. 3
Fig. 3
PEL cell lines depend on IRF4 and MDM2, but not NF-κB components. a Current models of NF-κB, vIL-6, IRF4/MYC axis, and p53 regulatory pathways in PEL. i In the inactive state, the NF-κB subunits p65 and p50 are sequestered by the IκB complex and prevented from signaling. Upon activation of the pathway, the IKK complex (NEMO, IKKα, and IKKβ) is phosphorylated and targets IκB for degradation. This releases the p65/p50. In PEL, this pathway is thought to be constitutively activated by interaction of vFLIP with NEMO (IKBKG). ii Autocrine signaling by vIL-6 is triggered by the intracellular binding to gp130, which subsequently activates JAK/STAT signaling. iii The IRF4/MYC axis is proposed as a pro-proliferative transcriptional axis downstream of IKZF1. iv Activity of the tumor suppressor p53 in PEL is blocked by its degradation via the LANA-MDM2 complex. Genes in blue were chosen for validation. b Heatmap of adj. p values of sgRNA of key genes from a across cell lines screened. On the right are the numbers out of 16 cancer types where the relevant gene scored with a median adj. p < 0.25 in each group (Fig. 2b). The Brunello library was used for most of the screens except where indicated: G, GeCKO v2. c Volcano plot for genes screened using Brunello library in BC-3 highlighting some high confidence PEL dependencies (blue), fitness genes (yellow), and dispensable genes (red). d Degree of depletion of NF-κB genes (pink), genes that are involved in vIL-6 signaling (blue), and IRF4 (black) in all PEL cell lines screened by the Brunello library. e Representative analysis of relative live cell numbers over time after IRF4 knockout in BC-3 cells, see Supplementary Figure 4 for details. f End-point analysis of several independent growth curves (as in e) for IRF4 knockout in Cas9-expressing BC-3, BCBL-1, or BJAB cell clones. g Representative western blots of cells in f. hj Similar to eg but following MDM2 knockout. Arrowhead, truncated MDM2 from CRISPR targeting. AAVS1, control sgRNA targeting the non-coding AAVS1 locus; PSMD1, sgRNA targeting the housekeeping gene PSMD1. Error bars represent SEM, n ≥ 3
Fig. 4
Fig. 4
PEL cell lines are dependent on CCND2 and CFLAR. a Heatmap of adj. p values of sgRNA depletion of CCND2 and CFLAR in cell lines screened. Indicated on the right are the numbers of cancer types (out of 16) where the gene was found to be a potential dependency. The Brunello library was used for most of the screens except where indicated: G, GeCKO v2. b, c Knockout of CFLAR. b Representative analysis of relative live BCBL-1 cell numbers over time following CFLAR knockout. n = 4. c Representative western blots of c-FLIPL and c-FLIPS isoforms for b. d, e Similar to b and c but using CCND2 sgRNAs. Experiments in be were performed together and thus share controls. f Distribution of cell cycle phase populations in BCBL-1 Cas9 cells upon CCND2 or CFLAR knockout analyzed by propidium iodide staining of samples on day 4 in experiments shown in be. p Values were calculated by Student’s t test and compared to sgAAVS1. g Calculated IC50 values of palbociclib in the indicated cell lines. Gray bars, non-PEL cells; pink bars, PEL cell lines; n ≥ 3. h, i Cell cycle analysis of propidium iodide-stained live BCBL-1 cells treated for 24 h with 220 nM palbociclib (IC50). h Representative histograms of DNA content from propidium iodide staining. i Distribution of cell cycle phase populations. p Values were calculated by Student’s t test and compared to PBS-treated cells. n = 3. All error bars, SEM
Fig. 5
Fig. 5
PEL cell lines are addicted to MCL1. a BCL2 family proteins primarily function on the outside of the mitochondrial membrane to prevent BAX or BAK monomers from oligomerizing to form outer membrane pores. Upon intracellular stress, pro-apoptotic BH3-only proteins are upregulated and bind to the BCL2 proteins, thereby competing with BAX or BAK. The free BAX or BAK monomers then oligomerize to form outer mitochondrial membrane pores, resulting in cytochrome c to the cytosol and initiation of apoptosis. b Heatmap of adj. p values of sgRNA depletion of the BCL2 family genes across screens. Indicated on the right are the numbers of cancer types (out of 16) where the gene was found to be potentially essential. The Brunello library was used for most of the screens except where indicated: G, GeCKO v2. c Representative growth curve analysis following MCL1 knockout in BC-3 Cas9 (n = 3, technical replicates). d End-point analysis of several growth curves for MCL1 knockout in BC-3, BCBL-1, or BC-2 Cas9 cells (n = 3, biological replicates). e Representative western blots for MCL1 knockout and PARP cleavage for experiments in d. All error bars, SEM
Fig. 6
Fig. 6
Pharmacological inhibition of MCL1 in PEL and control cell lines and MCL1 expression in PEL tumors. a Calculated IC50 values of S63845 in different cell lines. Based on Kotschy et al., Daudi and MEG-01 cells are MCL1-independent cell lines while Raji and KMS-12-BM are MCL1-dependent cell lines. Error bars, SEM; n ≥ 3 biological replicates. b MCL1 staining in tonsilar sections confirms specificity of our staining protocol. Germinal center cells (GC) express high levels of MCL1 while mantle zone cells (MZ) express low to undetectable levels of MCL1. c Example of a histological characterization of tumor sections from patient D (84-year HIV(−) female with EBV(+) tumor) with hematoxylin and eosin staining (H&E), LANA immunohistochemical stain, or MCL1 immunohistochemical stain. d MCL1 immunohistochemical stains for tumor sections from patients A–C. Corresponding scale bars are depicted in lower right corner of each image
Fig. 7
Fig. 7
Revised working model of the main host oncogenic gene dependencies in PEL cell lines. a Genes involved in NF-κB and Jak/Stat signaling are dispensable in most PEL cell lines and may serve fitness functions. b Addiction to constitutively active mTOR signaling was not captured in this study, due to confounding housekeeping function of mTOR. c Critical PEL-specific oncogene dependencies (PSODs) on IRF4, MDM2, CCND2, CFLAR, and MCL1 (in blue), most of which are druggable using agents shown in red

Similar articles

Cited by

References

    1. Nador RG, et al. Primary effusion lymphoma: a distinct clinicopathologic entity associated with the Kaposi’s sarcoma-associated herpes virus. Blood. 1996;88:645–656. - PubMed
    1. Cesarman E, Chang Y, Moore PS, Said JW, Knowles DM. Kaposi’s sarcoma-associated herpesvirus-like DNA sequences in AIDS-related body-cavity-based lymphomas. N. Engl. J. Med. 1995;332:1186–1191. doi: 10.1056/NEJM199505043321802. - DOI - PubMed
    1. Chang Y, et al. Identification of herpesvirus-like DNA sequences in AIDS-associated Kaposi’s sarcoma. Science. 1994;266:1865–1869. doi: 10.1126/science.7997879. - DOI - PubMed
    1. Soulier J, et al. Kaposi’s sarcoma-associated herpesvirus-like DNA sequences in multicentric Castleman’s disease. Blood. 1995;86:1276–1280. - PubMed
    1. Cesarman E. Gammaherpesviruses and lymphoproliferative disorders. Annu. Rev. Pathol. 2014;9:349–372. doi: 10.1146/annurev-pathol-012513-104656. - DOI - PubMed

Publication types

MeSH terms