. 2018 Jul 30:9:1744.
doi: 10.3389/fimmu.2018.01744. eCollection 2018.

Notch Signaling Modulates Macrophage Polarization and Phagocytosis Through Direct Suppression of Signal Regulatory Protein α Expression

Affiliations

Notch Signaling Modulates Macrophage Polarization and Phagocytosis Through Direct Suppression of Signal Regulatory Protein α Expression

Yan Lin et al. Front Immunol. .

Abstract

The Notch pathway plays critical roles in the development and functional modulation of myeloid cells. Previous studies have demonstrated that Notch activation promotes M1 polarization and phagocytosis of macrophages; however, the downstream molecular mechanisms mediating Notch signal remain elusive. In an attempt to identify Notch downstream targets in bone marrow-derived macrophages (BMDMs) using mass spectrometry, the signal regulatory protein α (SIRPα) appeared to respond to knockout of recombination signal-binding protein Jk (RBP-J), the critical transcription factor of Notch pathway, in macrophages. In this study, we validated that Notch activation could repress SIRPα expression likely via the Hes family co-repressors. SIRPα promoted macrophage M2 polarization, which was dependent on the interaction with CD47 and mediated by intracellular signaling through SHP-1. We provided evidence that Notch signal regulated macrophage polarization at least partially through SIRPα. Interestingly, Notch signal regulated macrophage phagocytosis of tumor cells through SIRPα but in a SHP-1-independent way. To access the translational value of our findings, we expressed the extracellular domains of the mouse SIRPα (mSIRPαext) to block the interaction between CD47 and SIRPα. We demonstrated that the soluble mSIRPαext polypeptides could promote M1 polarization and increase phagocytosis of tumor cells by macrophages. Taken together, our results provided new insights into the molecular mechanisms of notch-mediated macrophage polarization and further validated SIRPα as a target for tumor therapy through modulating macrophage polarization and phagocytosis.

Keywords: SHP-1; macrophages; notch; phagocytosis; polarization; signal regulatory protein α.


Figures

Figure 1
Figure 1
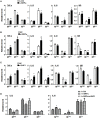
Notch signal regulated Signal regulatory protein α (SIRPα) expression in macrophage polarization. (A,B) Bone marrow-derived macrophages (BMDMs) from RBP-J knock out (mcKO) and control (Ctrl) mice were stimulated with PBS, LPS + IFNγ, or IL4 for 24 h. The expression of SIRPα was determined by qRT-polymerase chain reaction (PCR) (A) and Western blotting (B) (n = 4). (C,D) BMDMs from Notch signal activation (NICmCA) and control (Ctrl) mice were treated as in (A). The expression of SIRPα was determined by qRT-PCR (C) and Western blotting (D) (n = 4). (E) The surface protein level of SIRPα on BMDMs from RBP-J knock out (mcKO) and control (Ctrl) was detected using FACS (n = 4). (F) Full length and truncated fragments of SIRPα promoter were inserted into pGL3-basic to generate different reporters as depicted. Filled ellipses represent Hes-binding sites. HeLa cells were transiently transfected with different reporters and NIC-overexpressing vector (n = 5). (G,H) BMDMs were stimulated and subjected to chromatin immunoprecipitation analysis with IgG or anti-Hes1 antibody. Precipitated chromatin DNA was analyzed with qPCR (G) or PCR followed by electrophoresis (H) (n = 4). Student’s t test or one-way ANOVA test was used for statistical analyses. Bars represent means ± SD; *P < 0.05; **P < 0.01; ***P < 0.001.
Figure 2
Figure 2
Notch signal regulated signal regulatory protein α (SIRPα) expression and SHP-1 activation. (A–D) Bone marrow-derived macrophages (BMDMs) with SIRPα knockdown (A,B) or overexpression (C,D) were stimulated with PBS or lipopolysaccharide (LPS) + IFNγ for 24 h. Western blotting was carried out to analyze SHP-1 phosphorylation (n = 4). (E,F) BMDMs from RBP-J deficient (mcKO) and control (Ctrl) mice were transfected with SIRPα siRNA or NC and stimulated with PBS or LPS + IFNγ for 24 h. The phosphorylation of SHP-1 was determined by Western blotting (n = 4). (G,H) BMDMs from Notch signal activation (NICmCA) and control (Ctrl) mice were infected with SIRPα-overexpressing lentivirus and stimulated with PBS or LPS + IFNγ for 24 h. The phosphorylation of SHP-1 was determined by Western blotting (n = 4). One-way ANOVA test was used for statistical analyses. Bars represent means ± SD; * or #, P < 0.05; ** or ##, P < 0.01; ***P < 0.001.
Figure 3
Figure 3
CD47-SIRPα-SHP-1 signal suppressed M1 and promoted M2 polarization. (A) Bone marrow-derived macrophages (BMDMs) were transfected with SIRPα or control lentivirus and then cultured with PBS, lipopolysaccharide (LPS) + interferon (IFN)γ, or IL4 for 24 h. The expressions of TNF-α, IL12, IL10, and MR were determined by reverse transcription-polymerase chain reaction (PCR) (n = 3). (B,C) BMDMs were transfected with siRNA for SIRPα (B) or SHP-1 (C) followed by stimulation with PBS, LPS + IFNγ, or IL4. The expression of polarization makers was determined by qRT-PCR (n = 3). (D) BMDMs were transfected with SIRPα or control lentivirus and transfected with SHP-1 siRNA, followed by stimulation with PBS, LPS + IFNγ, or IL4. The expression of IL12 and IL10 was detected by qRT-PCR (n = 3). One-way ANOVA test was used for statistical analyses. Bars represent means ± SD; *P < 0.05; **P < 0.01.
Figure 4
Figure 4
Notch signal regulated macrophage polarization partially through signal regulatory protein α (SIRPα). (A,B) Bone marrow-derived macrophagess from RBP-J mcKO and control mice were transfected with siRNA for SIRPα and then cultured in the presence of PBS or lipopolysaccharide + interferon γ for 24 h. The expression of polarization markers (A) and the production of cytokines (B) were detected (n = 4). One-way ANOVA test was used for statistical analyses. Bars represent means ± SD; *P < 0.05; **P < 0.01.
Figure 5
Figure 5
Notch signal increased macrophage phagocytosis through repressing signal regulatory protein α (SIRPα). (A) Bone marrow-derived macrophages (BMDMs) were infected with SIRPα overexpression or control lentivirus and stimulated with PBS or lipopolysaccharide (LPS) + interferon (IFN)γ for 24 h. CFSE-labeled L1210 cells were then added and incubated for 2 h. After washing, samples were stained with anti-F4/80 and examined under an immunofluorescence microscope (n = 5). (B) BMDMs were transfected with si-SIRPα and treated as in (A). The phagocytosis was examined under an immunofluorescence microscope (n = 5). (C,D) L1210 cells transfected with CD47 siRNA or NC were incubated with PBS- or LPS + IFNγ-stimulated BMDMs. Phagocytosis (C) (n = 5) and expression of polarization markers (D) (n = 3) were determined. (E) BMDMs were transfected with SIRPα siRNA or NC and stimulated with PBS, LPS + IFNγ, or IL4 and incubated with L1210 cells transfected with CD47 siRNA or NC. The expression of IL12 and IL10 was determined by qRT-polymerase chain reaction (n = 3). (F) BMDMs from RBP-J mcKO and control mice were treated as in (A). Phagocytosis was examined under an immunofluorescence microscope (n = 5). (G) BMDMs were treated with DMSO or GSI, and PBS or LPS + IFNγ. Phagocytosis was determined as in (A) (n = 5). One-way ANOVA test was used for statistical analyses. Bars represent means ± SD; *P < 0.05; **P < 0.01.
Figure 6
Figure 6
Expression and purification of mSIRPαext fusion proteins. (A) Representative illustrations of the recombinant Trx-mSIRPαext, Trx-mCD47ext, and mSIRPαext proteins. The thioredoxin peptide (Trx), His tag (His), S tag, and the site for thrombin-mediated cleavage are indicated. (B) SDS-PAGE of the purified Trx-mSIRPαext (left, lane 1), cleaved Trx-mSIRPαext (left, lane 2), purified mSIRPαext (left, lane 3), and Trx-mCD47ext (right, lane 1). The Trx-mSIRPαext, mSIRPαext, Trx and Trx-mCD47ext bands are indicated with arrows, with MW shown in parentheses. M, molecular weight marker. (C) mSIRPαext interacted with Trx-mCD47ext in a pull-down assay. The purified mSIRPαext and Trx-mCD47ext proteins were incubated in PBS at 4°C for 2 h and were precipitated with anti-His antibody pre-coupled with Dynabeads-protein G. Co-precipitated proteins were analyzed by Western blotting with anti-His or anti-S Tag antibody. Data represent three independent experiments. (D) L1210 cells were incubated with PBS or mSIRPαext. After washing, cells were stained with FITC-conjugated anti-S tag antibody, followed by FACS analysis.
Figure 7
Figure 7
Recombinant mSIRPαext promoted M1 polarization and enhanced phagocytosis of M1 macrophages in vitro. (A) Differentially polarized bone marrow-derived macrophages (BMDMs) were incubated with PBS or mSIRPαext for 6 h. The expression of TNF-α, IL12, IL10, and MR was determined by qRT-polymerase chain reaction (PCR) (n = 3). (B) BMDMs overexpressing SIRPα were incubated with mSIRPαext for competitive interaction and stimulated with PBS or lipopolysaccharide (LPS) + IFNγ. The expression of IL12 and IL10 was determined by qRT-PCR (n = 3). (C) BMDMs were stimulated with PBS or LPS + IFNγ in the presence of mSIRPαext. CFSE-labeled L1210 cells were then loaded and incubated for 2 h, and examined under an immunofluorescence microscope (n = 5). One-way ANOVA test was used for statistical analyses. Bars represent means ± SD, n = 3; *P < 0.05; **P < 0.01; ***P < 0.001.

Similar articles

Cited by

References

    1. Bissell MJ, Hines WC. Why don’t we get more cancer? A proposed role of the microenvironment in restraining cancer progression. Nat Med (2011) 17:320–9.10.1038/nm.2328 - DOI - PMC - PubMed
    1. Gordon S, Taylor PR. Monocyte and macrophage heterogeneity. Nat Rev Immunol (2005) 5:953–64.10.1038/nri1733 - DOI - PubMed
    1. Biswas SK, Allavena P, Mantovani A. Tumor-associated macrophages: functional diversity, clinical significance, and open questions. Semin Immunopathol (2013) 35:585–600.10.1007/s00281-013-0367-7 - DOI - PubMed
    1. De Palma M, Lewis CE. Macrophage regulation of tumor responses to anticancer therapies. Cancer Cell (2013) 23:277–86.10.1016/j.ccr.2013.02.013 - DOI - PubMed
    1. Epelman S, Lavine KJ, Randolph GJ. Origin and functions of tissue macrophages. Immunity (2014) 41:21–35.10.1016/j.immuni.2014.06.013 - DOI - PMC - PubMed

Publication types

LinkOut - more resources