. 2018 Aug 13;8(1):12063.
doi: 10.1038/s41598-018-30499-2.

Endogenous HIF2A reporter systems for high-throughput functional screening

Affiliations

Endogenous HIF2A reporter systems for high-throughput functional screening

M Nazhif Zaini et al. Sci Rep. .

Abstract

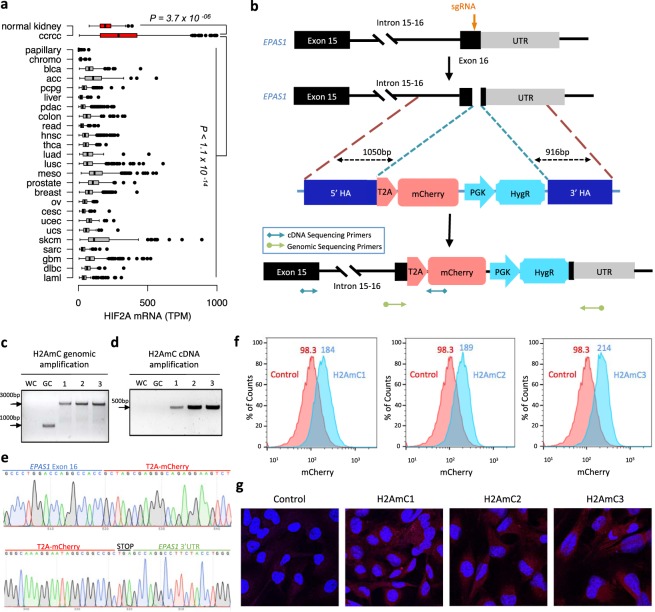
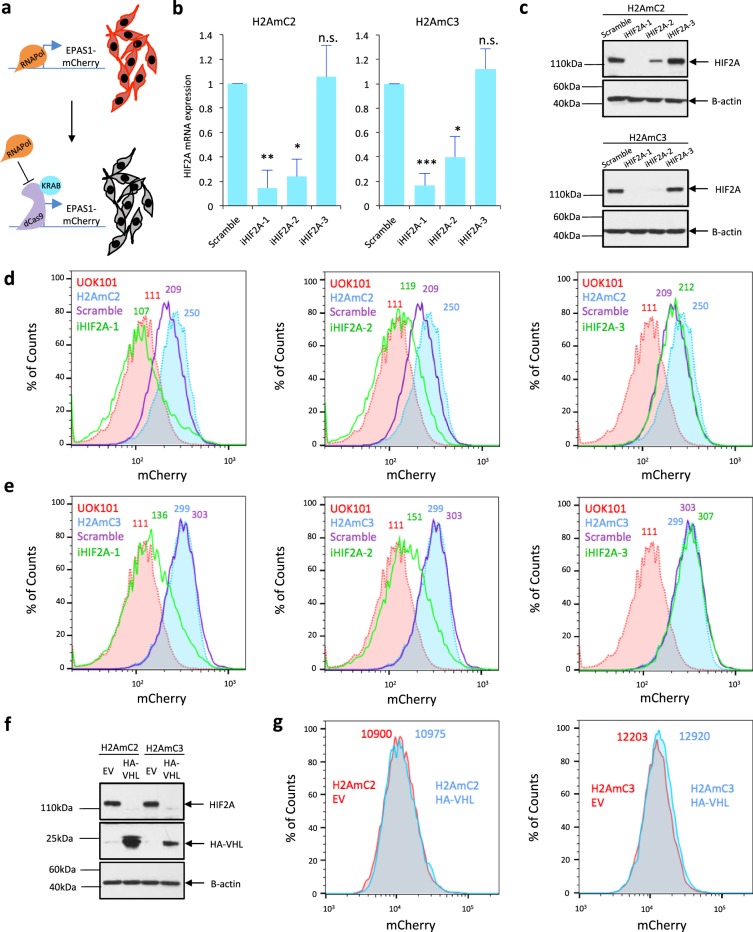
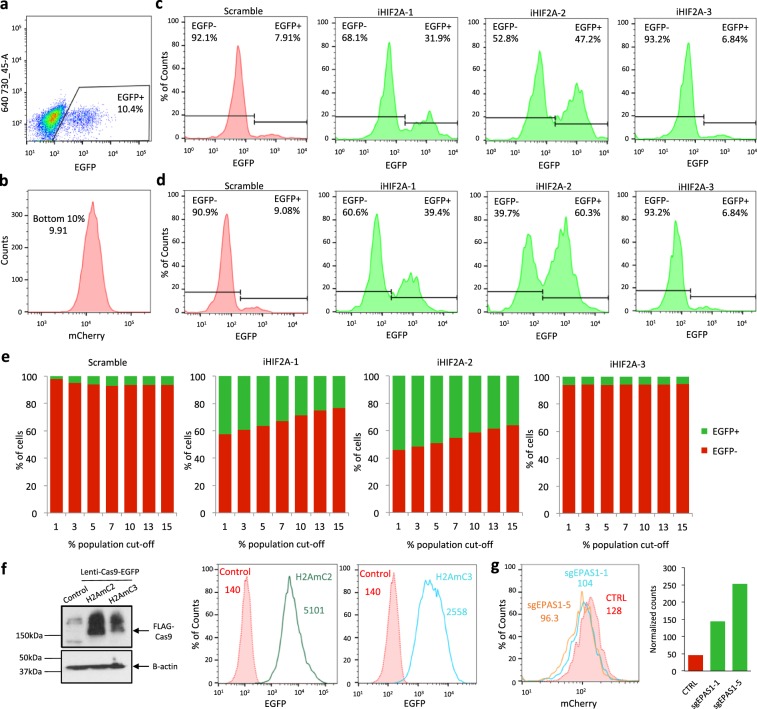
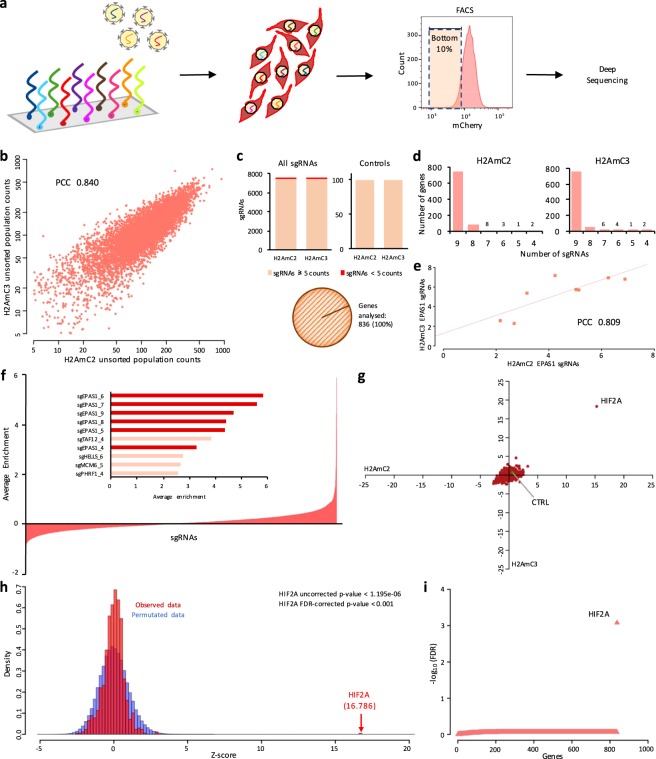
Tissue-specific transcriptional programs control most biological phenotypes, including disease states such as cancer. However, the molecular details underlying transcriptional specificity is largely unknown, hindering the development of therapeutic approaches. Here, we describe novel experimental reporter systems that allow interrogation of the endogenous expression of HIF2A, a critical driver of renal oncogenesis. Using a focused CRISPR-Cas9 library targeting chromatin regulators, we provide evidence that these reporter systems are compatible with high-throughput screening. Our data also suggests redundancy in the control of cancer type-specific transcriptional traits. Reporter systems such as those described here could facilitate large-scale mechanistic dissection of transcriptional programmes underlying cancer phenotypes, thus paving the way for novel therapeutic approaches.


Conflict of interest statement

The authors declare no competing interests.

Figures

Figure 1
Figure 1
Generation of endogenous HIF2A reporter systems. (a) TCGA data analysis of HIF2A mRNA expression in ccRCC compared to different tumour types and normal kidney. P-value by Wilcoxon rank sum test. (b) Schematic of CRISPR-Cas9-based knock-in strategy of an mCherry fluorescent gene into the exon 16 of EPAS1. Plasmid template consists of an mCherry fluorescent gene with a hygromycin selection marker that are flanked by homology arms (HA). Sequencing primers used for genomic and cDNA amplifications in (c) and (d), respectively, are shown. (c) Genomic amplification of the HIF2A-mCherry integration site in single-cell derived clones. WC, water control. GC, genomic control. (d) cDNA amplification of the HIF2A-mCherry integration site. WC, water control. GC, genomic control. (e) Sanger sequencing of the HIF2A-mCherry integration sites in H2AmC2 cells. (f) FACS analysis of mCherry fluorescence in the three H2AmC clones compared to the parental UOK101 cells. (g) mCherry fluorescence in the three H2AmC clones compared to the parental control. DAPI in blue, mCherry in red.
Figure 2
Figure 2
Validation of endogenous HIF2A reporter systems. (a) Schematic of CRISPRi-based inhibition of reporter activity. RNAPol, RNA Polymerase II. KRAB, Kruppel associated box. (b) Relative HIF2A mRNA levels in H2AmC2 and H2AmC3 dCas9 cells transduced with HIF2A-targeting sgRNAs or a non-targeting control. *P < 0.05, **P < 0.01, ***P < 0.005, n.s., non-significant. P-value by Student’s t-test. (c) Western blot analysis of H2AmC2 and H2AmC3 dCas9 cells transduced with HIF2A-targeting sgRNAs or a non-targeting control. B-actin acts as a loading control. Full-length blots are presented in Supplementary Fig. 5. (d) FACS analysis of mCherry fluorescence in H2AmC2 cells transduced with different HIF2A-targeting sgRNA constructs. Untransduced H2AmC2 and UOK101 cells serve as a positive and negative control, respectively. (e) FACS analysis of mCherry fluorescence in H2AmC3 cells transduced with different HIF2A tandem sgRNAs compared to controls. (f) Western blot analysis of VHL-reintroduced H2AmC2 and H2AmC3 cells compared to the empty vector (EV) control. B-actin acts as a loading control. Full-length blots are presented in Supplementary Fig. 5. (g) FACS analysis of mCherry fluorescence in H2AmC2 and H2AmC3 cells transduced with HA-VHL and empty vector.
Figure 3
Figure 3
HIF2A sgRNA enrichment as a function of mCherry depletion. (a) EGFP fluorescence in sgRNA-transduced H2AmC2 CRISPRi cells. (b) mCherry fluorescence of a H2AmC2 population that contains 10% of EGFP+ sgRNA-expressing cells. The bottom 10% of mCherry population was selected for further analysis of EGFP fluorescence. (c,d) EGFP fluorescence in H2AmC2 (c) and H2AmC3 (d) cells with the lowest 10% mCherry fluorescence from analysis similar to that shown in panel (b). In iHIF2A-1 and iHIF2A-2 cells the fraction of EGFP positive cells is increased compared to the unselected population (panel (a)) or the control or iHIF2A-3 cells, indicating enrichment of HIF2A-targeting sgRNAs in the mCherry low population. (e) Relative abundance of EGFP positive (EGFP+) and negative (EGFP-) H2AmC2 cells in populations with different levels of mCherry fluorescence. (f) Western blot analysis of H2AmC2 and H2AmC3 cells transduced with lenti-Cas9-EGFP compared to untransduced control cells. B-actin act as a loading control. Full-length blots are presented in Supplementary Fig. 5. Accompanying EGFP fluorescence analysis of single cell derived clones of the respective H2AmC2 and H2AmC3 lenti-Cas9-EGFP pools on the right. (g) Left, mCherry fluorescence in H2AmC3-Cas9 cells transduced with non-targeting control sgRNA (CTRL), sgEPAS1-1 or sgEPAS1-5. Right, normalized cell counts for each construct in the combined population with the lowest 10% of mCherry fluorescence.
Figure 4
Figure 4
A CRISPR-Cas9 screen targeting chromatin regulators. (a) Schematic showing the screening process. A pool of sgRNAs targeting chromatin factors was cloned into a lentiviral vector. H2AmC2 and H2AmC3 clones expressing Cas9 were transduced with the virus, followed by isolation of the cells with the lowest 10% of mCherry fluorescence. sgRNA enrichment was assessed by high-throughput sequencing. (b) Correlation plot of the normalized sgRNA counts in unsorted H2AmC2 and H2AmC3 cells. (c) Breakdown of total sgRNAs, control sgRNAs and total genes analysed in the screen after the removal of sgRNAs with less than 5 normalized counts in the unsorted population. (d) Number of sgRNAs analysed per gene. (e) Fold enrichment of HIF2A sgRNAs in H2AmC2 and H2AmC3 cells. (f) Average enrichment of all sgRNAs analysed in the screen with a snapshot of the top 10 scoring sgRNAs. (g) Z-scores of the median enrichment for all genes in the H2AmC2 and H2AmC3 cells. (h) Permutation analysis (1000x) of gene enrichment scores. Observed data in red, simulated data in blue. (i) Distribution of FDR-corrected P-values for each gene. PCC, Pearson’s correlation coefficient.

Similar articles

Cited by

References

    1. Fellmann C, et al. An optimized microRNA backbone for effective single-copy RNAi. Cell Rep. 2013;5:1704–1713. doi: 10.1016/j.celrep.2013.11.020. - DOI - PubMed
    1. Tzelepis K, et al. A CRISPR Dropout Screen Identifies Genetic Vulnerabilities and Therapeutic Targets in Acute Myeloid Leukemia. Cell Rep. 2016;17:1193–1205. doi: 10.1016/j.celrep.2016.09.079. - DOI - PMC - PubMed
    1. Zuber J, et al. RNAi screen identifies Brd4 as a therapeutic target in acute myeloid leukaemia. Nature. 2011;478:524–528. doi: 10.1038/nature10334. - DOI - PMC - PubMed
    1. Prahallad A, et al. Unresponsiveness of colon cancer to BRAF(V600E) inhibition through feedback activation of EGFR. Nature. 2012;483:100–103. doi: 10.1038/nature10868. - DOI - PubMed
    1. Knott SRV, et al. Asparagine bioavailability governs metastasis in a model of breast cancer. Nature. 2018;554:378–381. doi: 10.1038/nature25465. - DOI - PMC - PubMed

Publication types

MeSH terms

Substances