. 2018 Aug 13;15(1):226.
doi: 10.1186/s12974-018-1261-y.

The plasticity of primary microglia and their multifaceted effects on endogenous neural stem cells in vitro and in vivo

Affiliations

The plasticity of primary microglia and their multifaceted effects on endogenous neural stem cells in vitro and in vivo

Sabine Ulrike Vay et al. J Neuroinflammation. .

Abstract

Background: Microglia-the resident immune cells of the brain-are activated after brain lesions, e.g., cerebral ischemia, and polarize towards a classic "M1" pro-inflammatory or an alternative "M2" anti-inflammatory phenotype following characteristic temporo-spatial patterns, contributing either to secondary tissue damage or to regenerative responses. They closely interact with endogenous neural stem cells (NSCs) residing in distinct niches of the adult brain. The current study aimed at elucidating the dynamics of microglia polarization and their differential effects on NSC function.

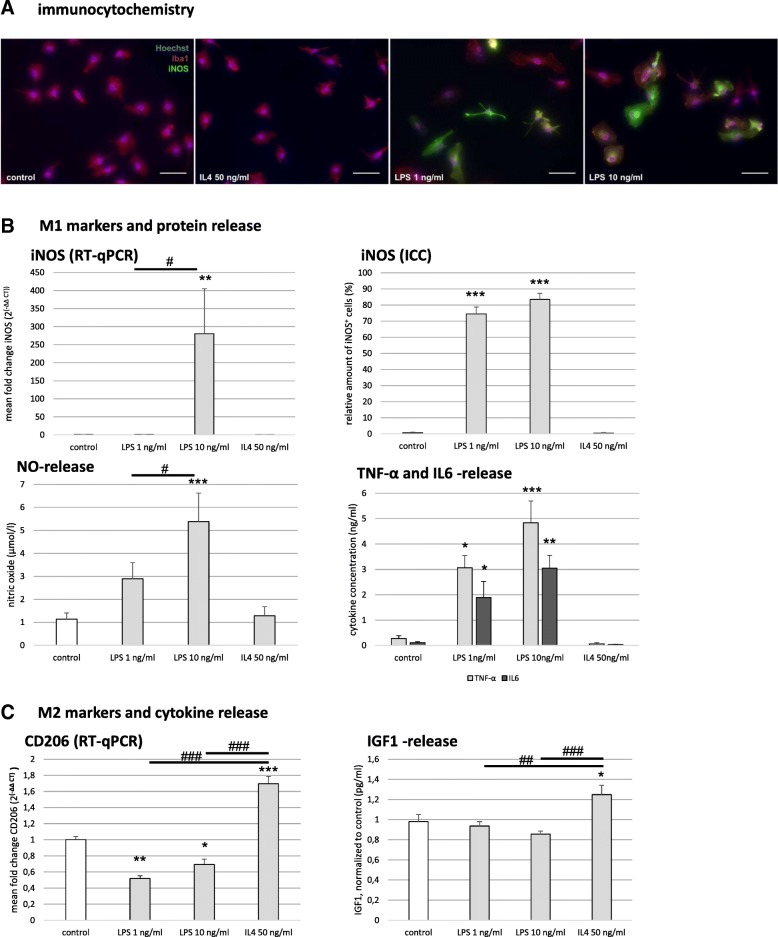
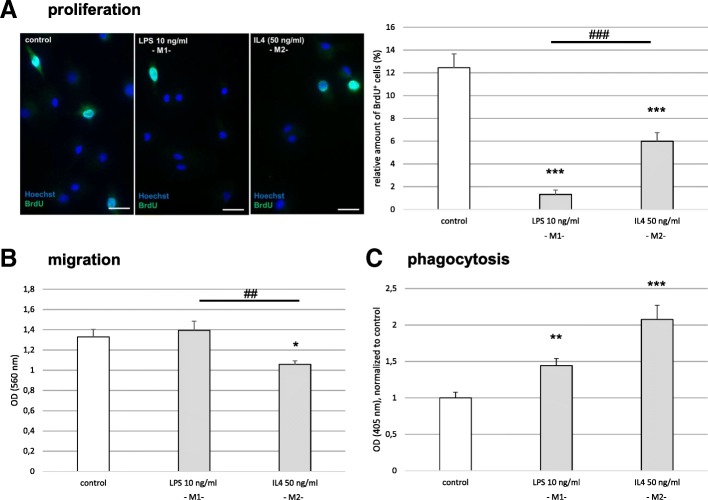
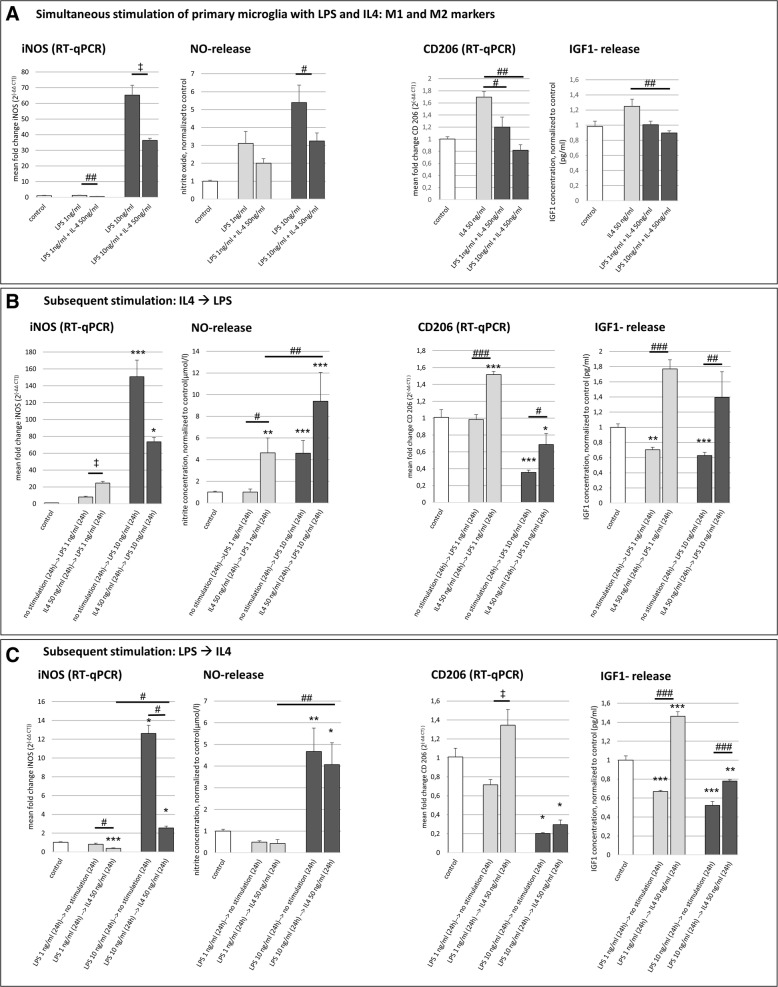
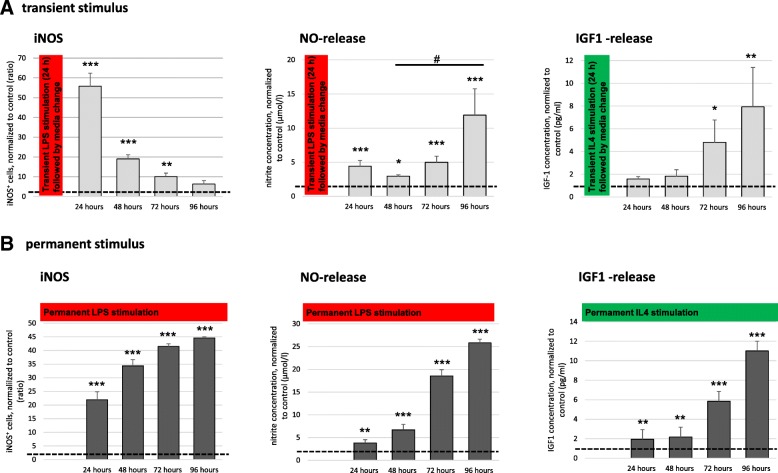
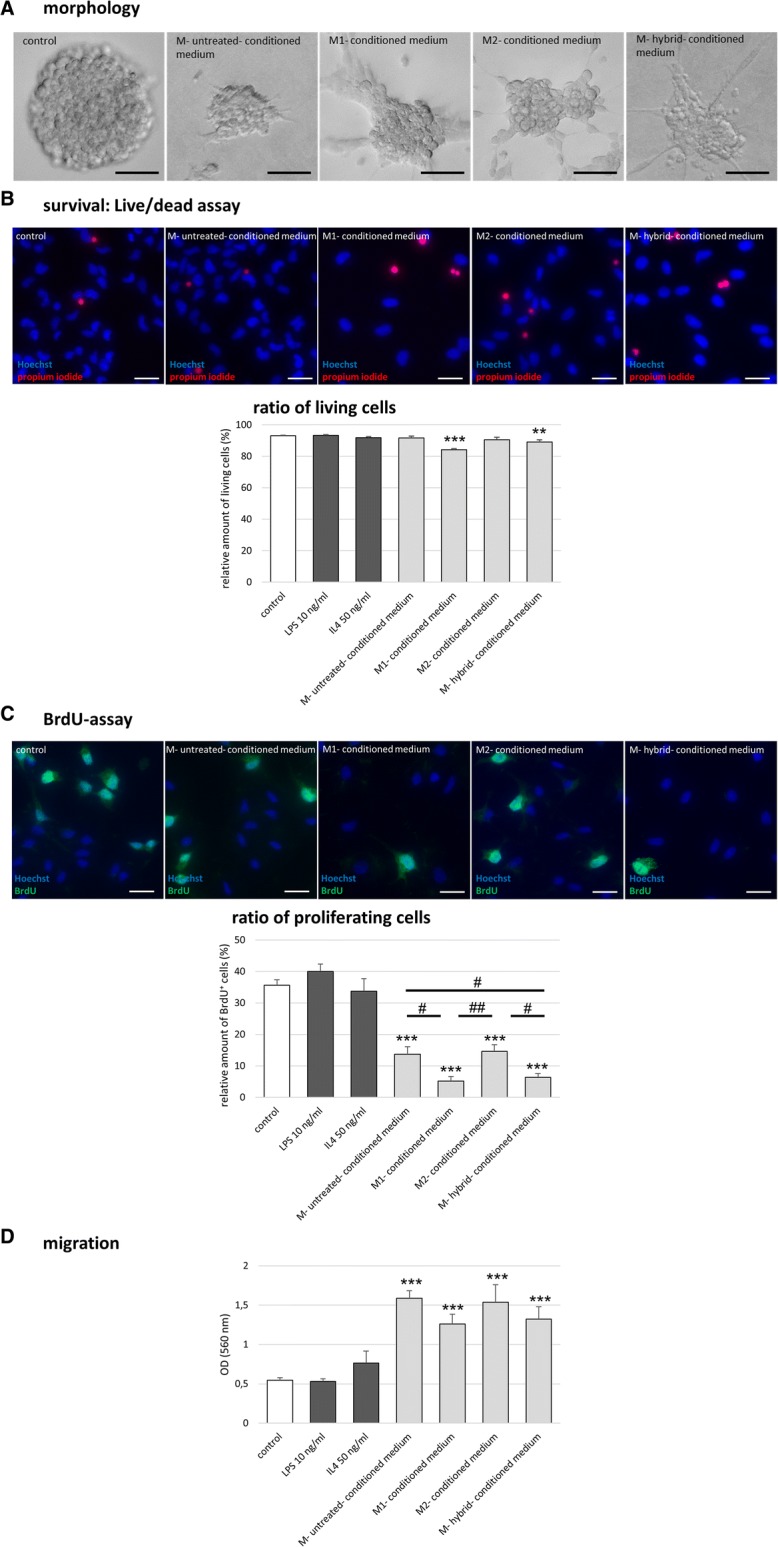
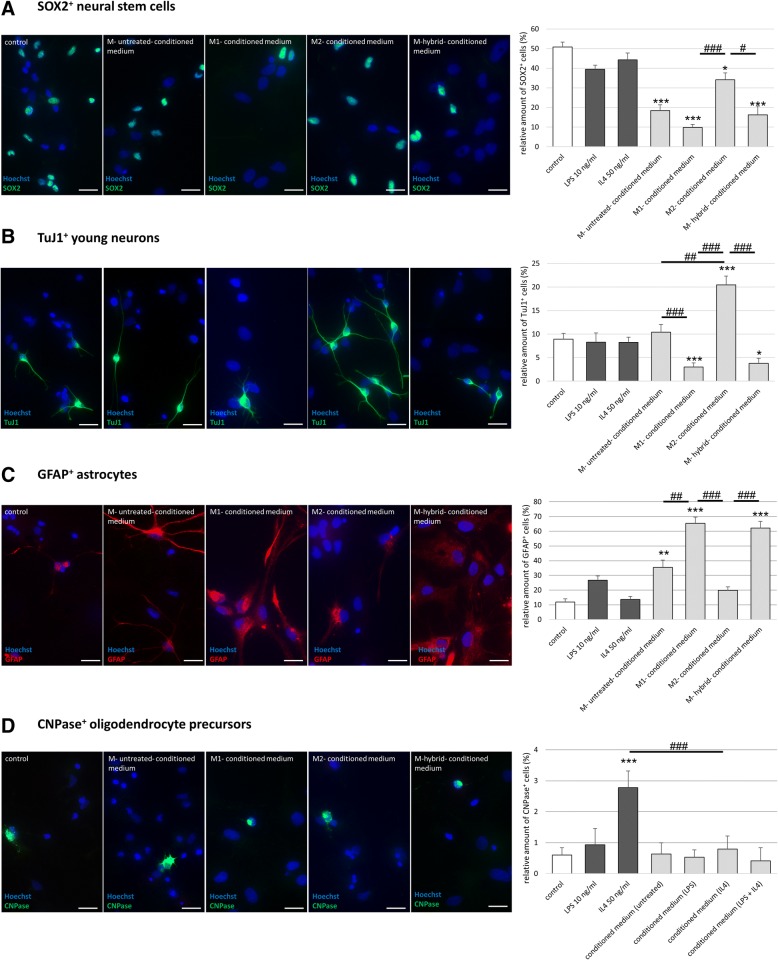
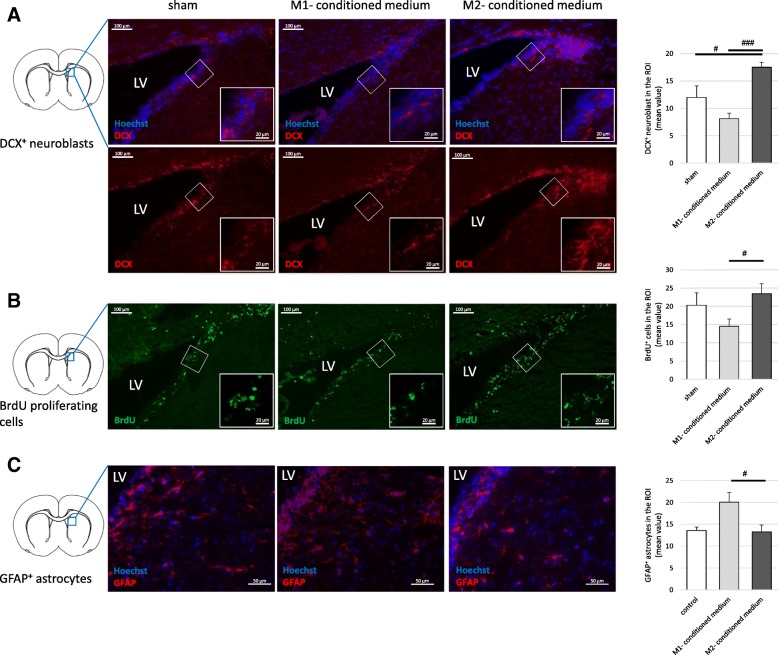
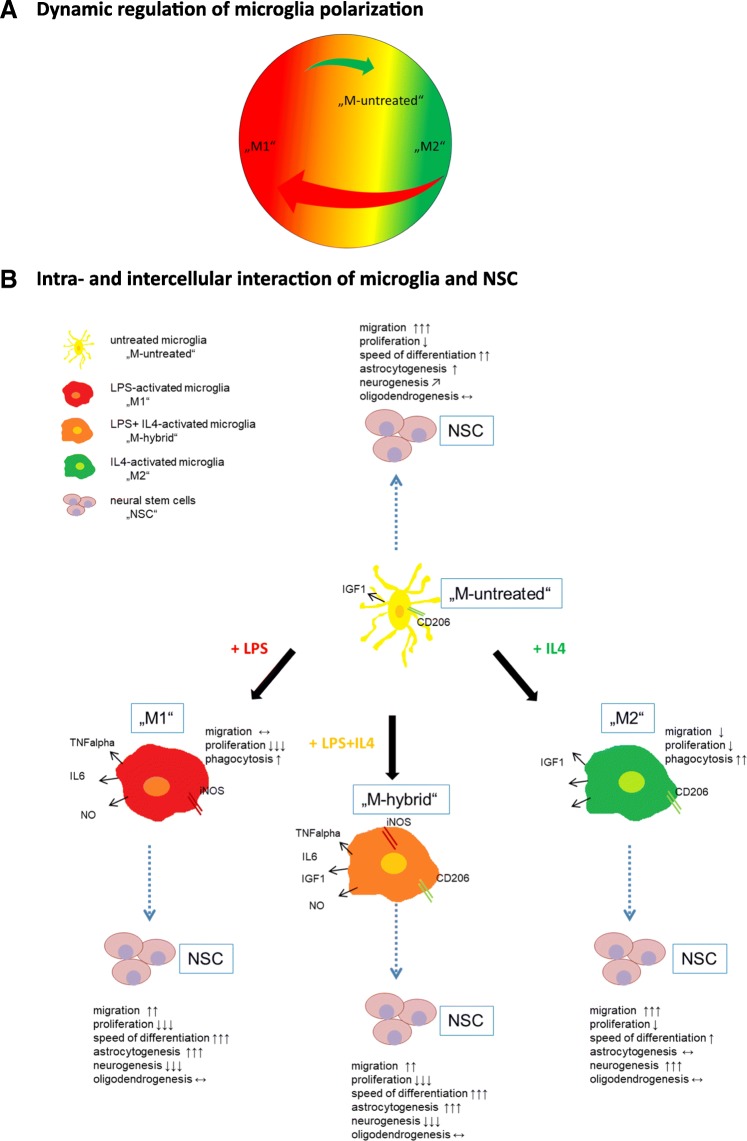
Results: Primary rat microglia in vitro were polarized towards a M1 phenotype by LPS, or to a M2 phenotype by IL4, while simultaneous exposure to LPS plus IL4 resulted in a hybrid phenotype expressing both M1- and M2-characteristic markers. M2 microglia migrated less but exhibit higher phagocytic activity than M1 microglia. Defined mediators switched microglia from one polarization state to the other, a process more effective when transforming M2 microglia towards M1 than vice versa. Polarized microglia had differential effects on the differentiation potential of NSCs in vitro and in vivo, with M1 microglia promoting astrocytogenesis, while M2 microglia supported neurogenesis. Regardless of their polarization, microglia inhibited NSC proliferation, increased NSC migration, and accelerated NSC differentiation.

Conclusion: Overall, this study shed light on the complex conditions governing microglia polarization and the effects of differentially polarized microglia on critical functions of NSCs in vitro and in vivo. Refining the understanding of microglia activation and their modulatory effects on NSCs is likely to facilitate the development of innovative therapeutic concepts supporting the innate regenerative capacity of the brain.

Keywords: Cerebral ischemia; Hybrid microglia; M1 microglia; M2 microglia; Neuroinflammation; Neuroprotection; Stem cell-mediated regeneration.


Conflict of interest statement

All animal procedures for tissue harvesting as well as for in vivo experiments were in accordance with the German Laws for Animal Protection. The study was approved by the local animal care committee (Tierschutz-Beauftragte University of Cologne) and local governmental authorities (Landesamt für Natur, Umwelt und Verbraucherschutz North Rhine-Westphalia, LANUV NRW, AZ 84-02.05.40.14.056, AZ UniKoeln_Anzeige§4.16.020 and AZ 84-02.04.2012.A116).

Not applicable

The authors declare that they have no competing interests.

Springer Nature remains neutral with regard to jurisdictional claims in published maps and institutional affiliations.

Figures

Fig. 1
Fig. 1
Polarization of primary microglia by lipopolysaccharide (LPS) and interleukin-4 (IL4). *p < 0.05, **p < 0.01, *** p < 0.001 compared to control; #p < 0.05, ##p < 0.01, ###p < 0.001 compared to different experimental group as marked by horizontal bar. a Representative immunocytochemical stainings for the microglia marker “ionized calcium-binding adapter molecule 1” (Iba1; red), co-stained for “inducible nitric oxide (NO) synthetase” (iNOS; green), and Hoechst 33342 (Hoechst) as a nuclear counterstain (blue); scale bar = 50 μm. b Characterization of the M1 microglia phenotype by expression of iNOS, release of NO, and M1-characteristic cytokines after treatment with LPS (1 and 10 ng/ml) or IL4 (50 ng/ml). INOS expression was measured on the RNA level by real-time quantitative PCR (RT-qPCR; n = 3, H(3) = 25.828, p < 0.001) and on the protein level by immunocytochemistry (n = 3, H(3) = 97.262, p < 0.001). Release of NO was measured by Griess assay (μmol/l; n = 4, H(3) = 23.176, p < 0.001). Release of tumor necrosis factor-α (TNF-α; ng/ml, n = 3, H(3) = 22.112, p < 0.001) and interleukin-6 (IL6; ng/ml, n = 3, H(3) = 21.588, p < 0.001) were measured by enzyme-linked immunosorbent assay (ELISA). c Characterization of the M2 microglia phenotype by expression of CD206 and release of M2-characteristic cytokines after treatment with LPS or IL4. Regulation of CD206 expression on the RNA level was measured by RT-qPCR (representative experiment, F (3, 11) = 69.671, p < 0.001, ω = 0.972). Insulin-like growth factor 1 (IGF1) release was measured by ELISA (pg/ml, n = 3, F (3, 27) = 7.082, p < 0.001, ω = 0.63)
Fig. 2
Fig. 2
Functional changes in polarized microglia. * p < 0.05, **p < 0.01, *** p < 0.001 compared to control; ##p < 0.01, ###p < 0.001 compared to different experimental group as marked by horizontal bar. OD optical density. a Left panel: representative immunocytochemical images of bromodeoxyuridine (BrdU) incorporation: BrdU (green) identifies proliferating cells, Hoechst for nuclear counterstain (blue); scale bar = 50 μm. Right panel: proliferation rate of microglia after treatment with LPS (10 ng/ml) or IL4 (50 ng/ml) as measured by BrdU incorporation (n = 3; H(2) = 66.774, p < 0.001). b Migration of microglia in the Boyden chamber assay (n = 4, F (2, 33) = 6.244, p < 0.01, ω = 0.475). Data were blank corrected. c Phagocytic activity of microglia (n = 5, H(2) = 24.303, p < 0.001). Data were blank corrected and normalized to control
Fig. 3
Fig. 3
Switch between microglia phenotypes. *p < 0.05, **p < 0.01, ***p < 0.001 compared to control; #p < 0.05, ##p < 0.01, ###p < 0.001 compared to different experimental group as marked by horizontal bar; p < 0.05, ‡‡p < 0.01 between two groups (t test); only relevant significant values are highlighted. a Co-stimulation of microglia with LPS (1 or 10 ng/ml) plus IL4 (50 ng/ml) and resulting expression of M1 and M2 markers. Expression of iNOS (representative experiment, F(4, 14) = 99.481, p < 0.001, ω = 0.9815; t test: t(4) = 4.424, p < 0.05, d = − 2.62) and CD206 (representative experiment, F(3, 8) = 12.634, p < 0.01, ω = 0.86) were measured on the mRNA level by RT-qPCR. Release of NO was measured by Griess assay (μmol/l; n = 4, H(4) = 64.298, p < 0.001); IGF1 release was measured by ELISA (n = 3, F(3, 24) = 5.587, p < 0.01, ω = 0.57). b Stimulation with IL4 (50 ng/ml) and subsequently with LPS (1 or 10 ng/ml), and resulting expression of M1 and M2 markers. Expression of iNOS (representative experiment, H(4) = 13.500, p < 0.01; t test: t(4) = − 7.6, p < 0.01, d = 12.96) and CD206 (representative experiment, F(4, 10) = 49.487, p < 0.001, ω = 0.96) were measured on the mRNA level by RT-qPCR. NO release was measured by Griess assay (μmol/l; n = 7, H(4) = 28.615, p < 0.001); IGF1 release was measured by ELISA (n = 7, H(4) = 25.794, p < 0.001). c Stimulation with LPS (1 or 10 ng/ml) and subsequently with IL4 (50 ng/ml), and resulting expression of M1 and M2 markers. Expression of iNOS (n = 4, F(4, 27) = 400.684; p < 0.001, ω = 0.99) and CD206 (representative experiment, F(4, 10) = 27.475, p < 0.001, ω = 0.77; t test: t(4) = 3.56, p < 0.05, d = − 2.65) were measured on the mRNA level by RT-qPCR. NO release was measured by Griess assay (μmol/l; n = 6, H(4) = 27.456, p < 0.001); IGF1 release was measured by ELISA (pg/ml, n = 7, F(4, 35) = 121.074, p < 0.001, ω = 0.96)
Fig. 4
Fig. 4
Microglia polarization kinetics. *p < 0.05, **p < 0.01, ***p < 0.001 compared to control; #p < 0.05 compared to different experimental group as marked by horizontal bar; only relevant significant values are highlighted. a Transient exposure to an acute inflammatory stimulus (24 h, followed by media change) of 10 ng/ml LPS (left and middle panel, red vertical bars) or 50 ng/ml IL4 (right panel, green vertical bar). INOS expression as a function of time after transient exposure was measured on the protein level by immunocytochemistry (n = 3, H(4) = 94.638, p < 0.001), NO release by Griess assay (μmol/l; n = 7, H(4) = 32.616, p < 0.001), and IGF1 release by ELISA (pg/ml, n = 5, H(4) = 10.128, p < 0.05). Data were normalized to control. b Permanent exposure to a chronic inflammatory stimulus, applied over the entire observation period of 96 h, of 10 ng/ml LPS (left and middle panel, red horizontal bars) or 50 ng/ml IL4 (right panel, green horizontal bar). INOS expression as a function of time after the beginning of permanent exposure was measured on the protein level by immunocytochemistry (n = 3, H(4) = 95.861, p < 0.001), NO release was measured by Griess assay (μmol/l; n = 7, H(4) = 44.542, p < 0.001); IGF1 release was measured by ELISA (pg/ml, n = 5, F (4, 27) = 259.4, p < 0.001, ω = 0.98). Data were normalized to control
Fig. 5
Fig. 5
Microglia-conditioned media affect key neural stem cell (NSC) functions. **p < 0.01, ***p < 0.001 compared to control; #p < 0.05, ##p < 0.01 compared to different experimental group as marked by horizontal bar; only relevant significant values are highlighted. a Representative images of neurospheres grown for 48 h in the presence of microglia-conditioned medium obtained from “M1” microglia exposed to LPS (10 ng/ml), “M2” microglia exposed to IL4 (50 ng/ml), “hybrid” microglia exposed to LPS plus IL4, or “untreated” microglia that had not been subjected to any inflammatory stimulus; scale bar = 50 μm. b Ratio of viable versus dead NSCs subjected to microglia-conditioned media as assessed by live/dead assay (n = 5, H(6) = 70.833, p < 0.001). Representative immunocytochemical images: all cells regardless of viability were stained by Hoechst (blue); dead cells were identified by propidium iodide incorporation (red); scale bar = 20 μm. c Proliferation rate of NSCs subjected to microglia-conditioned media as measured by BrdU incorporation (n = 7, H(6) = 218.951, p < 0.001). Representative immunocytochemical images: BrdU (green) identified proliferating cells, Hoechst as nuclear counterstain (blue); scale bar = 20 μm. d The migratory potential of NSCs subjected to microglia-conditioned media as assessed by Boyden chamber assay (n = 5, H(6) = 64.214, p < 0.001)
Fig. 6
Fig. 6
Polarized microglia differentially affect NSCs differentiation fate. *p < 0.05, **p < 0.01, ***p < 0.001 compared to control; #p < 0.05, ##p < 0.01, ###p < 0.001 compared to different experimental group as marked by horizontal bar; only relevant significant values are highlighted. a Differentiation speed of NSCs subjected to microglia-conditioned media upon mitogen withdrawal as assessed by loss of “sex determining region Y-box 2” (SOX2) immunoreactivity (n = 6, H(6) = 123.685, p < 0.001); representative images stained for SOX2 (green), identifying undifferentiated NSCs, with Hoechst (blue) as nuclear counterstain; scale bar = 20 μm. b Neurogenic potential of NSCs subjected to microglia-conditioned media as assessed by “neuron specific beta-III tubulin 1” (TuJ1) immunocytochemistry (n = 6, H(6) = 80.356, p < 0.001); representative images stained for TuJ1 (green), identifying young neurons, with Hoechst (blue) as nuclear counterstain; scale bar = 20 μm. c Generation of astrocytes from NSCs subjected to microglia-conditioned media (n = 6, H(6) = 114.744, p < 0.001); representative images stained for “glial fibrillary acidic protein” (GFAP; red), identifying astrocytes, with Hoechst (blue) as nuclear counterstain; scale bar = 20 μm. d Generation of oligodendrocytes from NSCs subjected to microglia-conditioned media (n = 6, H(6) = 37.860, p < 0.001); representative images stained for “2′,3′-cyclic-nucleotide 3′-phosphodiesterase” (CNPase; green), identifying oligodendrocytes, with Hoechst (blue) as nuclear counterstain; scale bar = 20 μm
Fig. 7
Fig. 7
Effects of M1- and M2-conditioned microglia media on endogenous NSCs in vivo. #p < 0.05, ##p < 0.01, ###p < 0.001 compared to different experimental group as marked by horizontal bar. Male adult Wistar rats received a single intracerebroventricular (i.c.v.) injection of M1-conditioned medium (n = 5), M2-conditioned medium (n = 5), or regular culture medium as control (n = 4). All animals received bromodeoxyuridine (BrdU) over 5 days and were sacrificed after 8 days for immunohistochemistry. a Effects of microglia-conditioned media on neurogenesis in the subventricular zone (SVZ) as assessed by staining for doublecortin (DCX)-positive neuroblasts (F(2, 19) = 14.215, p < 0.001, ω = 0.74). Representative images of DCX-immunohistochemistry (red) with Hoechst (blue) as nuclear counterstain; scale bar = 100 μm; in the magnified insert 20 μm. b Effects of microglia-conditioned media on proliferation in the SVZ as assessed by staining for BrdU (F(2, 19) = 2.443, p < 0.1, ω = 0.34). Representative images of BrdU immunohistochemistry (green); scale bar = 100 μm; in the magnified insert 20 μm. c Effects of microglia-conditioned media on the generation of astrocytes in the striatum directly adjacent to the SVZ (H(2) = 7.936, p < 0.05). Representative images of GFAP immunohistochemistry (red) with Hoechst (blue) as nuclear counterstain; scale bar = 50 μm
Fig. 8
Fig. 8
Overview of the experimental results and interpretation. a Schematic overview of the dynamic regulation of microglia polarization: primary untreated microglia (yellow) can be polarized to an M1 phenotype (red) or M2 phenotype (green) in vitro. Prior to exposure to inflammatory mediators, primary microglia in vitro are close to the M2 phenotype regarding characteristic expression patterns. Switching between polarization states using distinct inflammatory mediators such as LPS or IL4 is possible, however much more effective when transforming M2 microglia towards the M1 phenotype (red arrow) than vice versa (green arrow). b Untreated microglia (yellow) are polarized towards an M1 phenotype (red) following exposure to LPS, or to an M2 phenotype (green) in the presence of IL4. Simultaneous exposure to LPS plus IL4 results in a hybrid phenotype (orange) expressing both M1- and M2-characteristic markers. While microglia of all polarization states have similar effects on NSCs (pink) in regard to proliferation and migration, they characteristically differ in their effects on NSCs differentiation potential

Similar articles

Cited by

References

    1. Walberer M, Jantzen SU, Backes H, Rueger MA, Keuters MH, Neumaier B, Hoehn M, Fink GR, Graf R, Schroeter M. In-vivo detection of inflammation and neurodegeneration in the chronic phase after permanent embolic stroke in rats. Brain Res. 2014;1581:80–88. doi: 10.1016/j.brainres.2014.05.030. - DOI - PubMed
    1. Walter HL, Walberer M, Rueger MA, Backes H, Wiedermann D, Hoehn M, Neumaier B, Graf R, Fink GR, Schroeter M. In vivo analysis of neuroinflammation in the late chronic phase after experimental stroke. Neuroscience. 2015;292:71–80. doi: 10.1016/j.neuroscience.2015.02.024. - DOI - PubMed
    1. Stoll G, Jander S, Schroeter M. Inflammation and glial responses in ischemic brain lesions. Prog Neurobiol. 1998;56(2):149–171. doi: 10.1016/S0301-0082(98)00034-3. - DOI - PubMed
    1. Gao HM, Hong JS. Why neurodegenerative diseases are progressive: uncontrolled inflammation drives disease progression. Trends Immunol. 2008;29(8):357–365. doi: 10.1016/j.it.2008.05.002. - DOI - PMC - PubMed
    1. Glass CK, Saijo K, Winner B, Marchetto MC, Gage FH. Mechanisms underlying inflammation in neurodegeneration. Cell. 2010;140(6):918–934. doi: 10.1016/j.cell.2010.02.016. - DOI - PMC - PubMed

MeSH terms

LinkOut - more resources