. 2018 Aug 10;19(1):109.
doi: 10.1186/s13059-018-1485-2.

ChromTime: modeling spatio-temporal dynamics of chromatin marks

Affiliations

ChromTime: modeling spatio-temporal dynamics of chromatin marks

Petko Fiziev et al. Genome Biol. .

Abstract

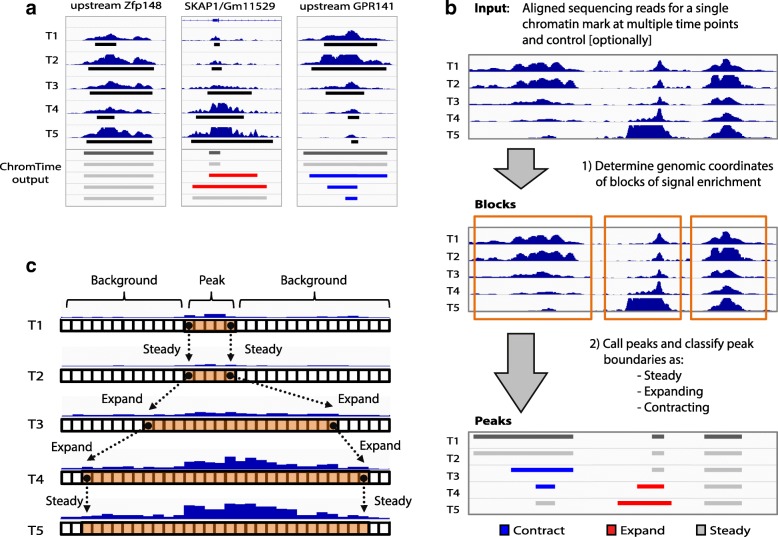
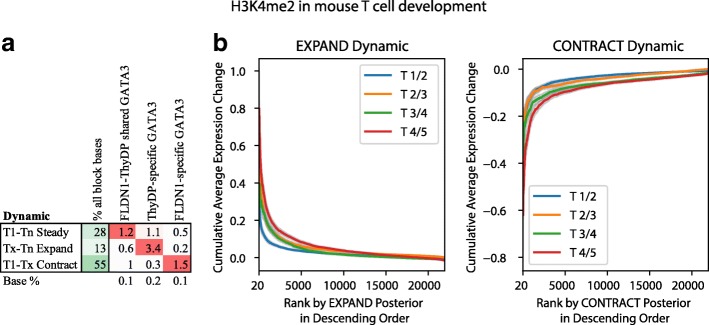
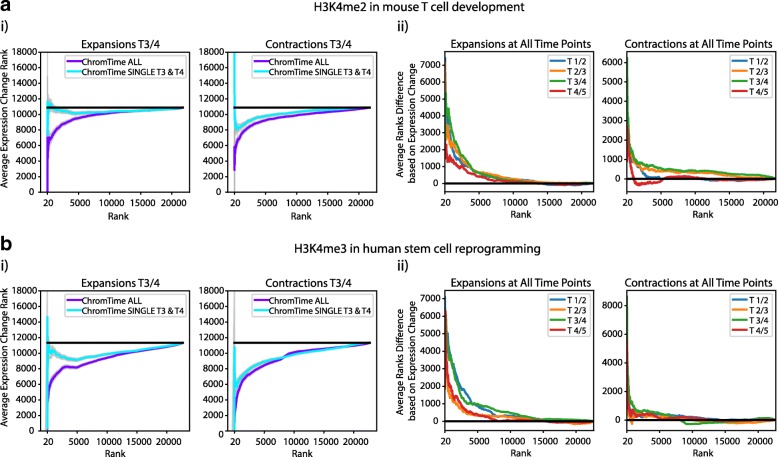
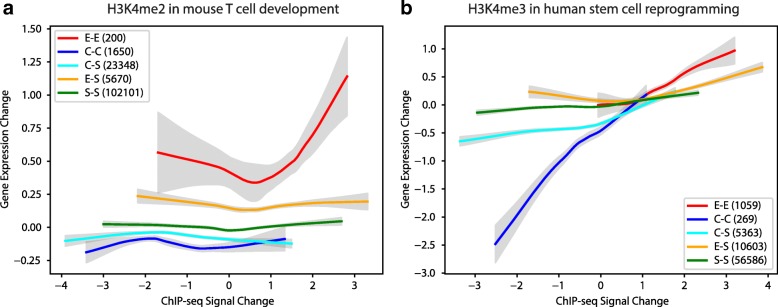
To model spatial changes of chromatin mark peaks over time we develop and apply ChromTime, a computational method that predicts peaks to be either expanding, contracting, or holding steady between time points. Predicted expanding and contracting peaks can mark regulatory regions associated with transcription factor binding and gene expression changes. Spatial dynamics of peaks provide information about gene expression changes beyond localized signal density changes. ChromTime detects asymmetric expansions and contractions, which for some marks associate with the direction of transcription. ChromTime facilitates the analysis of time course chromatin data in a range of biological systems.

Keywords: Chromatin marks; Epigenomics; Histone modifications; Spatial dynamics; Time course.


Conflict of interest statement

Not applicable.

Not applicable.

The authors declare that they have no competing interests.

Springer Nature remains neutral with regard to jurisdictional claims in published maps and institutional affiliations.

Figures

Fig. 1
Fig. 1
Overview of the ChromTime method. a Examples of H3K4me2 peaks with steady, expanding, and contracting boundary dynamics, shown from left to right, respectively, across five time points during mouse T-cell development [17]. Time points 1, 2, and 3 correspond to in vitro differentiated T-cell precursors (FLDN1, FLDN2a, and FLDN2b), whereas time points 4 and 5 correspond to in vivo purified thymocytes (ThyDN3 and ThyDP). Normalized ChIP-seq signal, MACS2 [38] peaks (black rectangles), and ChromTime output are shown for each time point. Peaks upstream of the Zfp148 gene are called steady by ChromTime despite fluctuations of MACS2 peak boundaries. In contrast, ChromTime calls a peak at the Skap1/GM11529 promoter to expand after time points 2 and 3. Conversely, ChromTime calls a peak upstream of the GPR141 gene to contract after time points 2, 3, and 4. b Overview of the ChromTime method. During the block-finding stage, input foreground and, optionally, control reads are used to determine blocks of signal enrichment. In the dynamics prediction stage, for each block, peak boundary positions are predicted at each time point and peak boundary dynamics are predicted at each pair of consecutive time points. c Predicting dynamics for one block. Boxes represent genomic bins at each time point. Foreground signal is depicted as blue bars for each bin whose height represents the number of reads mapped to the bin. ChromTime learns a probabilistic mixture model from the input data to partition each block at each time point into peak and background components. Bins in the peak component (orange) mark peaks of signal enrichment whereas those in the background component (white) mark flanking background signal. The movement of the boundaries on the left and the right side of peaks between consecutive time points is estimated by reasoning jointly about the input data from all time points
Fig. 2
Fig. 2
Sample output from ChromTime with contracting peaks. Genome browser screenshot with sample output of ChromTime for H3K4me2 from the T-cell development time course in mouse [17] with five time points at the Esam/Vsig2/Nrgn locus. Time points 1, 2, and 3 correspond to in vitro differentiated T-cell precursors (FLDN1, FLDN2a, and FLDN2b), whereas time points 4 and 5 correspond to in vivo purified thymocytes (ThyDN3 and ThyDP). The input ChIP-seq signal and MACS2 [38] peaks (black boxes under each signal track) are shown in the upper panel of the screenshot. The ChromTime-predicted peaks colored by their boundary dynamics for each block at each time point are shown in the bottom panel. The first peak in each block is colored in dark gray. Each subsequent peak is colored with respect to the predicted dynamic relative to its previous time point. Peaks with steady boundaries on both sides are shown in light gray, and those with at least one contracting boundary are shown in blue. Nearby peaks that touch boundaries are visualized as one peak by the genome browser. Not shown in the figure are expanding peaks, peaks at single time points, and peaks with opposite dynamics (EXPAND on the left and CONTRACT on the right, or vice versa), which would be colored in red, orange, and black, respectively. See Additional file 1: Figure S2 for examples of predicted expanding peaks
Fig. 3
Fig. 3
Changes in GATA3 binding and gene expression at predicted H3K4me2 dynamics in T-cell development. a Fold enrichments of cell type-specific and shared peaks of GATA3, which is a master regulator in T-cell development [17], are shown for three sets of blocks with predicted H3K4me2 peaks: 1) blocks with peaks present at all time points whose boundaries hold steady on both sides throughout the whole time course (T1-Tn Steady); 2) blocks with non-contracting peaks whose boundaries expand between at least one pair of consecutive time points and have a peak at the last time point (Tx-Tn Expand); and 3) blocks with non-expanding peaks whose boundaries contract between at least one pair of consecutive time points and have a peak at the first time point (T1-Tx Contract). The first column shows the percentage of bases out of all bases covered by peaks of the set. The last row shows the baseline percentage for each feature out of all bases covered by ChromTime peaks at any time point. Percentages are colored from 0 (white) to 100 (green). Fold enrichments in each column are colored from 1 (white) to the maximum value in the column (red). FLDN1 and ThyDP denote differentiated T-cell precursors and purified thymocytes, which are the first and the last time point, respectively. b Boundaries of predicted H3K4me2 peaks in blocks with at least one predicted non-zero length peak overlapping annotated TSSs were sorted in decreasing order by their posterior probability for EXPAND dynamic (left plots) and CONTRACT dynamic (right plots) at each pair of consecutive time points (Additional file 2: Supplementary methods). Gene expression differences between consecutive time points were calculated as the average difference across all genes with overlapping TSSs for each block. For each posterior rank (x-axis) the plot shows the cumulative average gene expression difference across all peak boundaries with equal or higher posterior probabilities (y-axis). Expanding boundaries associated with increase of gene expression and contracting boundaries associated with decrease of gene expression. Shaded regions correspond to 95% confidence intervals
Fig. 4
Fig. 4
ChromTime predictions associate better with expression changes than boundary movements of peaks called in isolation. a For H3K4me2 in mouse T-cell development [17] ChromTime was applied once with data from all time points (ChromTime ALL), and once with single time points in isolation (ChromTime SINGLE; Additional file 2: Supplementary methods). Time points 1, 2, and 3 correspond to T-cell precursors, 4 and 5 to purified thymocytes. Peaks called by both procedures overlapping annotated TSSs were analyzed for their relationship with gene expression changes. i Left: Comparison of agreement with expression for expansions when applying ChromTime ALL and ChromTime SINGLE for the change between time points 3 and 4. Peak boundaries were sorted in decreasing order of their EXPAND posterior probabilities from ChromTime ALL and compared to sorting them in decreasing order of the difference of peak boundary positions in ChromTime SINGLE peaks with positive differences in boundary positions indicating peaks expanding with time. Each boundary was also ranked by the average gene expression difference of TSSs overlapping its block in decreasing order with positive expression differences indicating gain with time. The cumulative average boundary rank of expression change (y-axis) is shown for the boundary change ranking for ChromTime ALL and ChromTime SINGLE (x-axis). Low Y-values indicate stronger association with expression changes. Black line shows expected average expression change rank. Shaded regions indicate 95% confidence intervals. Plots for other time points can be found in Additional file 1: Figure S5. Right: Analogous to left plots for contract posterior probabilities for ChromTime ALL, increasing order of the difference of boundary change positions for ChromTime SINGLE, and increasing order of expression changes. ii Differences between ChromTime ALL and ChromTime SINGLE values shown in i between time points 3 and 4 as well as for all other pairs of time points. Positive values correspond to boundary ranks for which ChromTime ALL posteriors better associate with gene expression changes than boundary movements of ChromTime SINGLE peaks. Black lines show expected difference of zero between random rankings. b As in a for H3K4me3 in human stem cell reprogramming [24]. Time points correspond to human inducible and immortalized fibroblast-like (hiF-T) cells, hiF-T at 5, 10, and 20 days after induction, and human induced pluripotent stem cells (hIPSC)
Fig. 5
Fig. 5
Spatial dynamics can contain additional information about gene expression changes beyond signal density changes. Gene expression change is plotted as function of ChIP-seq signal density change after loess smoothing for each predicted ChromTime dynamic for a H3K4me2 dynamics in T-cell development in mouse [17] and b H3K4me3 dynamics in stem cell reprogramming in human [24] (Additional file 2: Supplementary methods). Peaks of each type of dynamics were pooled from all time points in each dataset for this analysis. Peaks with asymmetric dynamics E/S and S/E were pooled together in the “E-S” group. Similarly C/S and S/C peaks were pooled in the “C-S” group. The total number of peaks in each group is shown in parenthesis. In both systems, for a range of signal density changes, peaks with the same signal density change associated with different gene expression changes depending on the predicted spatial dynamic. Shaded regions represent 95% confidence intervals
Fig. 6
Fig. 6
Spatial dynamics of multiple different chromatin marks co-localize within a time course. Hierarchical clustering with optimal leaf ordering [80] of the geometric average fold enrichments taken across all time points of the overlap of every pair of predicted spatial dynamics for mapped HMs in a mouse adipogenesis [18] and b human stem cell reprogramming [24]. At each pair of time points, “Expand” and “Contract” dynamics are defined as all peaks that are predicted as either unidirectional or bidirectional expansions and contractions, respectively, whereas “Steady” dynamics are defined as all peaks that have predicted steady boundaries at both sides. Peaks with “Expand” dynamic on one side and “Contract” dynamic on the other were excluded from this analysis. In both datasets, expansions, contractions, and steady peaks of H3K4me2, H3K4me3, and H3K27ac and, to a lesser extent, of H3K4me1 tend to cluster together within each of the three classes, whereas spatial dynamics of H3K27me3 and H3K36me3 peaks tend to occupy different locations. All enrichments were capped at 50 before clustering
Fig. 7
Fig. 7
Direction of asymmetric dynamics correlates with direction of transcription. a i Left panel shows a schematic representation of unidirectional expansions that expand in the same direction as transcription and in the opposite direction of transcription. The adjacent plots show, for each mark, the average log2 ratio across all time points in each time course between the fraction of unidirectional expansions that expand in the same directions as transcription of the nearest gene and the fraction of unidirectional expansions that expand in the opposite direction of transcription of the nearest gene, separately for blocks that are within 1 kb of annotated TSSs and for more distal blocks. Positive values correspond to enrichment of unidirectional expansions in the same direction as transcription. For marks mapped in at least six time courses, a black line is plotted representing the average across all data sets and significant differences are denoted with asterisks based on a two-tailed Mann-Whitney test at a P value threshold of 0.05. ii Left panel shows analogous schematic for unidirectional contractions. Likewise, adjacent plots show, for each mark, the average log2 ratio between the fraction of unidirectional contractions that contract in the opposite direction of transcription of the nearest TSS and unidirectional contractions that contract in the same direction as transcription of the nearest TSS. b Left panel shows an example of unidirectional expansions between pairs of time points that expand in the same direction as transcription at the Hs6st1 gene of the H3K4me2 mark in the T-cell development dataset [17]. Right panel shows an example of unidirectional contractions in the opposite direction of transcription at the DNMT3B gene. Time points 1, 2, and 3 correspond to in vitro differentiated T-cell precursors, whereas time points 4 and 5 correspond to in vivo purified thymocytes. The predicted ChromTime peaks colored by their boundary dynamics are shown under the signal track for each time point

Similar articles

Cited by

References

    1. Boyle AP, Davis S, Shulha HP, Meltzer P, Margulies EH, Weng Z, et al. High-resolution mapping and characterization of open chromatin across the genome. Cell. 2008;132:311–322. doi: 10.1016/j.cell.2007.12.014. - DOI - PMC - PubMed
    1. Buenrostro JD, Giresi PG, Zaba LC, Chang HY, Greenleaf WJ. Transposition of native chromatin for fast and sensitive epigenomic profiling of open chromatin, DNA-binding proteins and nucleosome position. Nat Methods. 2013;10:1213–1218. doi: 10.1038/nmeth.2688. - DOI - PMC - PubMed
    1. Ernst J, Kheradpour P, Mikkelsen TS, Shoresh N, Ward LD, Epstein CB, et al. Mapping and analysis of chromatin state dynamics in nine human cell types. Nature. 2011;473:43–49. doi: 10.1038/nature09906. - DOI - PMC - PubMed
    1. Barski A, Cuddapah S, Cui K, Roh T-Y, Schones DE, Wang Z, et al. High-resolution profiling of histone methylations in the human genome. Cell. 2007;129:823–837. doi: 10.1016/j.cell.2007.05.009. - DOI - PubMed
    1. Mikkelsen TS, Ku M, Jaffe DB, Issac B, Lieberman E, Giannoukos G, et al. Genome-wide maps of chromatin state in pluripotent and lineage-committed cells. Nature. 2007;448:553–560. doi: 10.1038/nature06008. - DOI - PMC - PubMed

Publication types