. 2018 Oct 12;92(21):e01151-18.
doi: 10.1128/JVI.01151-18. Print 2018 Nov 1.

Distinctive Roles for Type I and Type II Interferons and Interferon Regulatory Factors in the Host Cell Defense against Varicella-Zoster Virus

Affiliations

Distinctive Roles for Type I and Type II Interferons and Interferon Regulatory Factors in the Host Cell Defense against Varicella-Zoster Virus

Nandini Sen et al. J Virol. .

Abstract

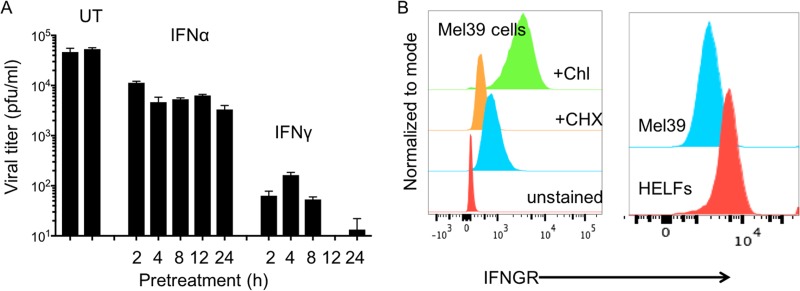
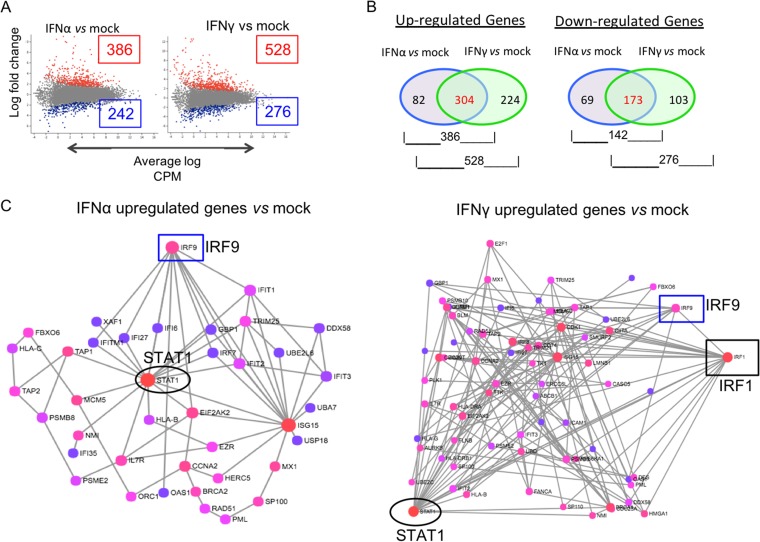
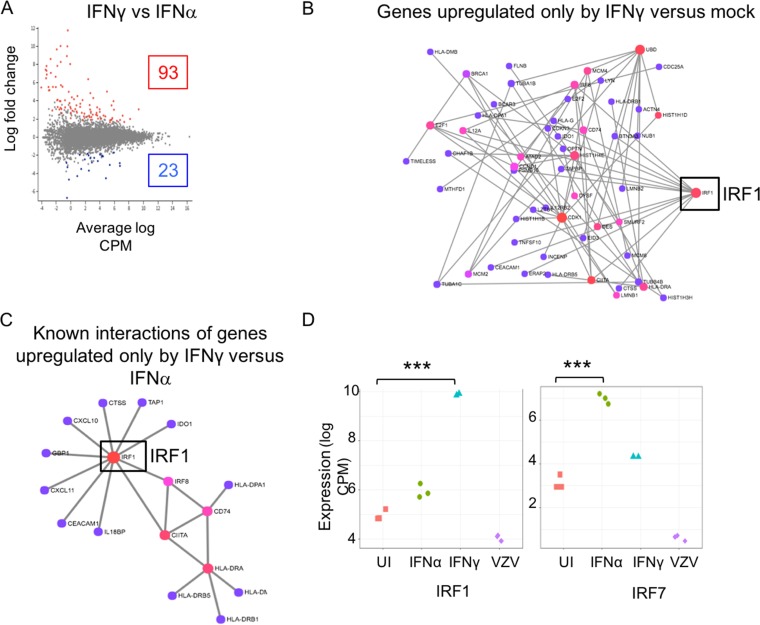
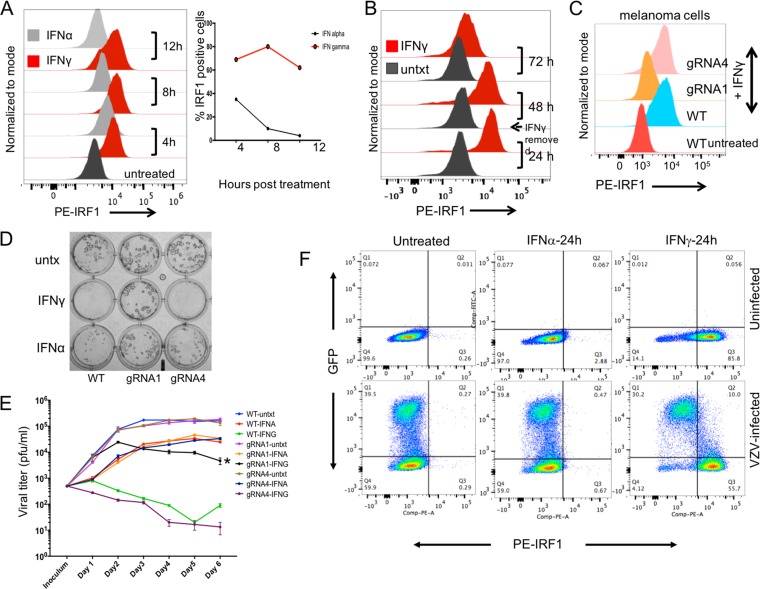
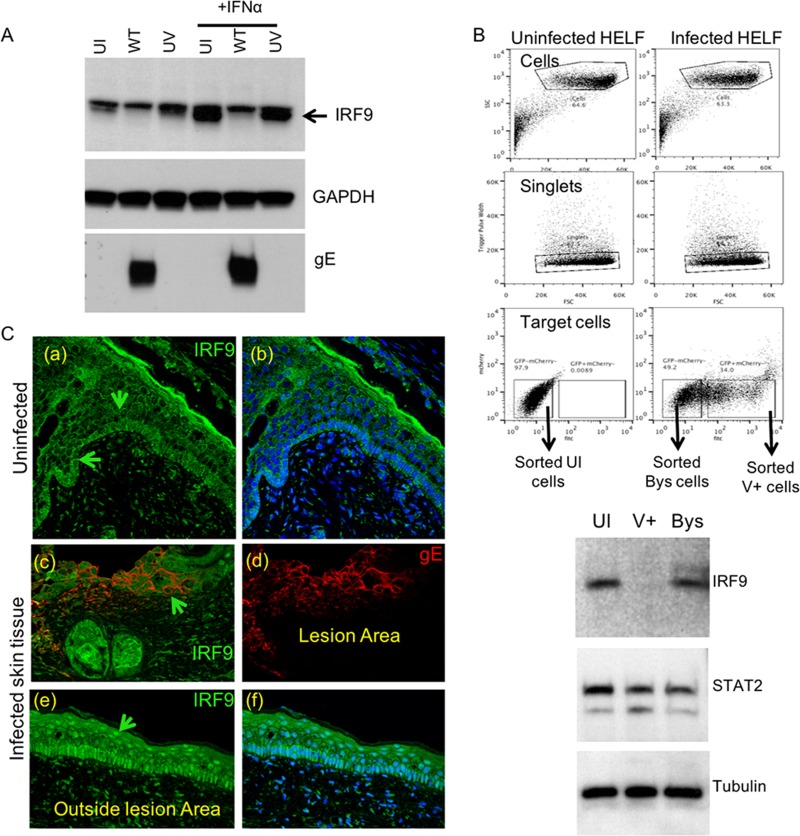
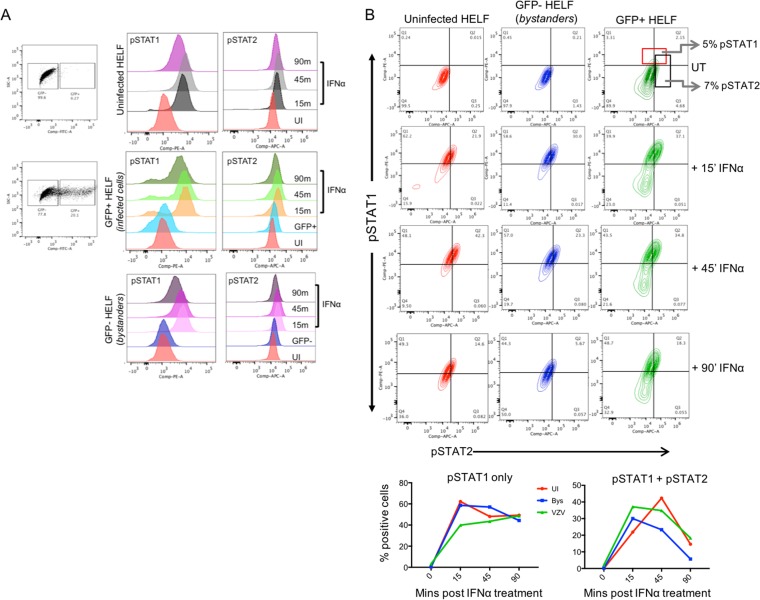
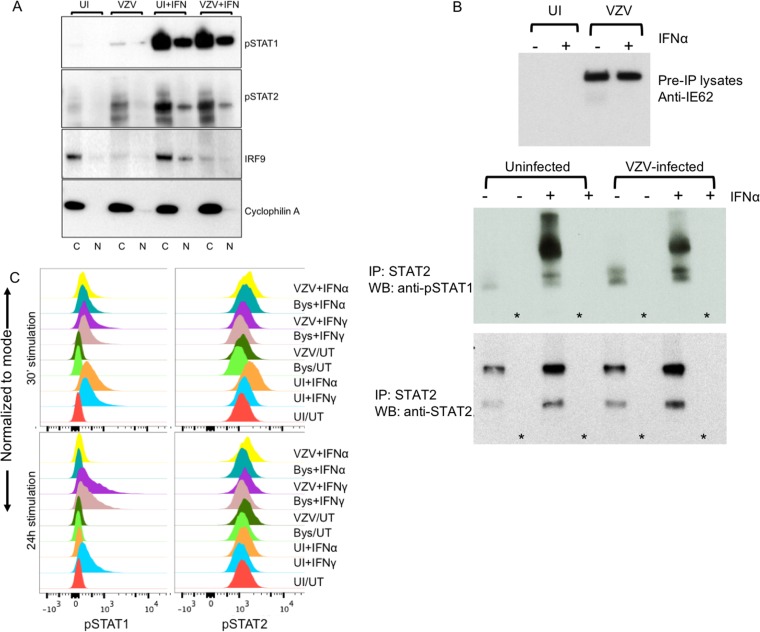
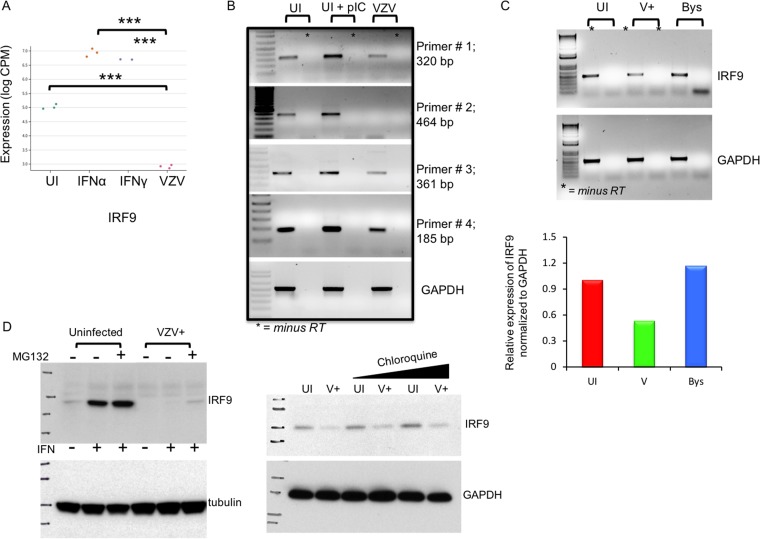
Both type I and type II interferons (IFNs) have been implicated in the host defense against varicella-zoster virus (VZV), a common human herpesvirus that causes varicella and zoster. The purpose of this study was to compare their contributions to the control of VZV replication, to identify the signaling pathways that are critical for mediating their antiviral activity, and to define the mechanisms by which the virus counteracts their effects. Gamma interferon (IFN-γ) was much more potent than IFN-α in blocking VZV infection, which was associated with a differential induction of the interferon regulatory factor (IRF) proteins IRF1 and IRF9, respectively. These observations account for the clinical experience that while the formation of VZV skin lesions is initially controlled by local immunity, adaptive virus-specific T cell responses are required to prevent life-threatening VZV infections.IMPORTANCE While both type I and type II IFNs are involved in the control of herpesvirus infections in the human host, to our knowledge, their relative contributions to the restriction of viral replication and spread have not been assessed. We report that IFN-γ has more potent activity than IFN-α against VZV. Findings from this comparative analysis show that the IFN-α-IRF9 axis functions as a first line of defense to delay the onset of viral replication and spread, whereas the IFN-γ-IRF1 axis has the capacity to block the infectious process. Our findings underscore the importance of IRFs in IFN regulation of herpesvirus infection and account for the clinical experience of the initial control of VZV skin infection attributable to IFN-α production, together with the requirement for induction of adaptive IFN-γ-producing VZV-specific T cells to resolve the infection.

Keywords: IRF1 mediates the inhibitory effects of interferon gamma on VZV; IRF9 mediates the action of interferon alpha on VZV; VZV innate immune control; interferon alpha delays onset of VZV spread; interferon gamma abrogates VZV replication.


Figures

FIG 1
FIG 1
Type I and type II IFNs differentially regulate the onset of VZV infection. (A) HELFs were pretreated with either IFN-α (104 U/ml) or IFN-γ (200 U/ml) for the indicated times, IFNs were removed, and monolayers were inoculated with VZV (400 PFU/ml). The bar graph shows the viral titers in samples collected at 10 days from wells that were untreated (UT) or exposed to IFN-α or IFN-γ for 2 to 24 h before inoculation. Virus titers were assayed in triplicate, and the error bars demonstrate the standard error of the mean. The data are representative of those from two similar independent experiments. (B) Determination of IFN-γ receptor (IFNGR) expression on primary fibroblasts (HELFs) and melanoma (Mel39) cells. Single-cell suspensions of the two cell types were incubated with phycoerythrin-IFNGR antibody and tested by flow cytometry. To confirm antibody specificity, Mel39 cells were treated with cycloheximide (CHX) to block protein synthesis and chloroquine (Chl) to block the lysosomal degradation of IFNGR.
FIG 2
FIG 2
Spatiotemporal effects of IFN-α and IFN-γ on VZV replication and spread. (A) Plaque formation in IFN-pretreated HELFs with or without continued IFN treatment. HELFs were pretreated with either IFN-α or IFN-γ for 2 h or 24 h before inoculation using VZV at a low (400 PFU/ml) or a high (2,000 PFU/ml) inoculum titer. Infection was allowed to proceed for 10 days either in the continued presence of the IFNs or when IFNs were withdrawn after the pretreatment period, just before VZV inoculation. Plaques were visualized by immunohistochemistry staining with anti-VZV antibodies. (B) High-magnification plaque images in IFN-α-pretreated HELFs with or without continued IFN-α treatment. The 2× magnification images of a well at 10 days are shown on the left; the 5× magnification images of four representative plaques at 10 days are shown on the right. (C) High-magnification plaque images after IFN-α or IFN-γ pretreatment for 2 h without continued IFN treatment in monolayers under conditions of a low (400 PFU/ml) or a high (2,000 PFU/ml) inoculum titer. The 2× magnification images of a well at 10 days are shown on the left; the 5× magnification images of four representative plaques are shown on the right. The data shown in panels A to C are representative of those from 12 similar independent experiments. (D) Dose effect of IFN-α and IFN-γ. HELFs were pretreated for 2 h with increasing doses of IFN-α or IFN-γ, as indicated, IFNs were removed, monolayers were inoculated with VZV (400 PFU/ml), and plaque formation was detected by immunohistochemistry at 10 days. (E) Effect of IFN treatment at 48 h after VZV inoculation. HELFs were infected with VZV (WT) and treated with either IFN-α or IFN-γ at 48 h after inoculation, and samples were collected at 72 h and 96 h to measure viral titers by VZV plaque assay, performed in triplicate. The data are representative of those from three similar independent experiments. The error bars show the standard error of the mean. (F) HELFs infected with VZV (WT) were treated with IFN-γ at the indicated times during (0 h) or after (3 to 24 h) virus inoculation. Samples were collected at 96 hpi to measure the viral titers by VZV plaque assay, performed in triplicate. The results are shown as a scatter plot, generated using Prism software. The error bars show the standard error of the mean. The data are representative of those from two similar independent experiments.
FIG 3
FIG 3
Comparative transcriptome analysis of IFN-α- and IFN-γ-treated HELFs and uninfected HELFs. (A) Each scatter plot represents a summary of the differential expression of cell gene transcripts, showing genes from the IFN-α- or IFN-γ-treated cells that were upregulated (red dots) or downregulated (blue dots) in reference to their expression in the mock-treated group. The x axis is the average log CPM, with larger values representing higher average expression levels of a gene across all samples. The y axis is the log fold change in expression between the two treatment groups. (B) Venn diagrams showing the numbers of common and exclusive up- and downregulated genes at 24 h after IFN-α and IFN-γ treatment. (C) Gene interaction networks for genes involved in immune regulation that were upregulated in the IFN-α- or IFN-γ-treated cells compared to mock-treated HELFs. The network maps were generated by the NetworkAnalyst tool using the IMEx database for gene interactions. The color of the nodes indicates the gene topology, with red showing maximum interactions and purple indicating minimum interactions. The boxed and circled genes indicate the transcriptional status of the STATs and IRFs, respectively, under each condition.
FIG 4
FIG 4
Comparative transcriptome analysis of IFN-α- versus IFN-γ-treated HELFs. (A) The scatter plot represents a summary of the differential expression of cell gene transcripts in IFN-α- versus IFN-γ-treated cells. The red dots indicate the genes that were significantly upregulated in the IFN-γ-treated cells, while the blue dots represent those that were upregulated in the IFN-α-treated cells. (B) A gene network map was constructed for genes that were exclusively upregulated in the IFN-γ-treated cells and not by IFN-α treatment compared to their expression in mock-treated HELFs. (C) Network map of the 17 of 93 genes that had significantly higher transcript levels in IFN-γ-treated cells than in IFN-α-treated cells. (D) Mean difference plots using IRF1 and IRF7 as examples of significant differences in expression levels between experimental groups, where the y axis is the log CPM expression level (***, P < 0.0005). UI, uninfected.
FIG 5
FIG 5
IRF1 is critical for the IFN-γ-mediated host cell defense against VZV. (A) HELFs were stimulated with either IFN-α or IFN-γ for the indicated times and then analyzed for IRF1 expression compared to that in the untreated HELFs. Data were collected on an LSR II.UV analyzer using a 561-nm green laser for excitation of the phycoerythrin (PE)-IRF1 antibody. Data analysis was done using FlowJo (version 10.0.5) software, and data are represented as a histogram (left) showing IRF1 expression (x axis). The line graph (right) shows the proportion of cells expressing IRF1 at the indicated time points in IFN-α- and IFN-γ-treated cells. (B) HELFs were stimulated with IFN-γ for 24 h, following which cells were grown in the absence of any stimulation and subsequently analyzed for IRF1 expression. Data were collected and analyzed as described above. (C to E) IRF1-knockout (IRF1KO) stable Mel39 cells (gRNA1) were generated using the CRISPR-Cas9 system; gRNA4 Mel39 cells expressing the empty pLentiCRISPRv2 vector were used as a control. (C) The gRNA1, gRNA4, and wild-type (WT) cell lines were treated with IFN-γ for 24 h and evaluated for IRF1 expression knockdown by flow cytometry. (D) The gRNA1, gRNA4, and WT cell lines were inoculated with 50 PFU/ml of VZV after 24 h of IFN-γ pretreatment, and virus detection was done by immunohistochemistry at day 5 postinfection. (E) Growth curve analysis of VZV replication was carried out in the IRF1KO, control, and WT cells treated with either IFN-γ or IFN-α or untreated for 24 h prior to inoculation with VZV (500 PFU/ml). IFNs were withdrawn at the time of inoculation, and cells were harvested from replicate wells for each of the nine test conditions at days 1 to 6; virus titers were assessed using WT Mel39 cells. The data are representative of those from two similar independent experiments. (F) HELFs were infected with VZV-GFP for 48 hpi or mock infected and exposed to IFN-α or IFN-γ for 24 h or left untreated. Prior to fixation, cells were treated with 50 μM MG132 for 6 h. IRF1 expression was evaluated by flow cytometry using the phycoerythrin-IRF1 antibody followed by analysis with FlowJo software. The data are representative of those from five similar independent experiments. untxt and untx, untreated.
FIG 6
FIG 6
IRF9 is critical for the IFN-α-mediated host cell defense against VZV. (A) HELFs inoculated with WT or UV-treated virus at an equivalent multiplicity of infection were analyzed for IRF9 expression by Western blotting (top). Western blotting for GAPDH (middle) and gE (bottom) was done to determine protein loading and confirm VZV infection, respectively. IFN-α was added as indicated at 8 hpi, and cells were lysed in RIPA buffer at 24 hpi. The data are representative of those from five similar independent experiments. (B) For fluorescence-activated cell sorting, the inoculum cells were stained using the CellTracker red CMTPX, which allowed sorting of newly infected cells. The dot plots show the sorting scheme that was used to isolate uninfected, bystander, and infected cells. Equal numbers of cells from each of the three populations were then used for Western blotting using the indicated antibodies. The data are representative of those from two similar cell sorting experiments. SSC, side scatter; FSC, forward scatter; fitc, fluorescein isothiocyanate; Bys, bystander cells; V+, VSV-infected cells. (C) Immunofluorescence detection of IRF9 (indicated by the green arrows) in uninfected (a to b) and VZV-infected (c to f) skin xenografts. Sections were stained for gE (Alexa Fluor 594; red) and IRF9 (Alexa Fluor 488; green) expression. The data are representative of those from three similar independent experiments.
FIG 7
FIG 7
STAT1 and STAT2 phosphorylation is not inhibited during VZV infection. (A) HELFs were mock or VZV infected for 24 h, followed by stimulation with 104 U of IFN-α or no treatment for the indicated times. Cells were fixed, permeabilized, and stained for pSTAT1-Y701-phycoerythrin and pSTAT2-Y689, detected by the Alexa Fluor 647-rabbit IgG secondary antibody, and analyzed by flow cytometry. The histograms show pSTAT1 (left) and pSTAT2 (right) expression in uninfected, bystander, and GFP-positive populations. (B) The contour plots show the frequency of cells in uninfected, bystander, and infected cell groups that were pSTAT1, pSTAT2, and pSTAT1 plus pSTAT2 positive following IFN-α stimulation. The line graphs show STAT1 and STAT1 plus STAT2 phosphorylation kinetics for each of the three sorted groups of cells. The data are representative of those from two similar independent experiments. SSC-A, side scatter area; FITC, fluorescein isothiocyanate; PE, phycoerythrin; APC, allophycocyanin; Comp, compensated; Q1 to Q4, quadrants 1 to 4, respectively.
FIG 8
FIG 8
STAT1 and STAT2 nuclear localization and heterodimerization are not inhibited during VZV infection. (A) Western blot analysis of IRF9, pSTAT1, and pSTAT2 expression in the cytoplasmic fractions (lanes C) and nuclear fractions (lanes N) purified from VZV-infected and uninfected HELFs that were treated with 104 U of IFN-α or mock treated. Cyclophilin was used as a loading control and for determination of the fractionation purity. The data are representative of those from two similar independent experiments. (B) Immunoblot analysis of mock- and VZV-infected HELF lysates that were treated with IFN-α (lanes +) or mock treated (lanes −) before (top panel) and after (middle and bottom panels) coimmunoprecipitation. The lysates were immunoprecipitated with STAT2 antibody and probed with antibodies to pSTAT1 and pSTAT2. The lanes marked with an asterisk indicate the bead-only (no-antibody) control lanes. The data are representative of those from two similar independent experiments. IP, immunoprecipitation; WB, Western blotting. (C) Flow cytometry analysis of pSTAT1 (phycoerythrin) and pSTAT2 (allophycocyanin) expression in mock- or VZV-infected HELFs treated with IFN-α or IFN-γ for 30 min or 24 h. Cells were analyzed at 48 hpi. The infected and the bystander populations from the VZV-infected samples were distinguished (gated) based on GFP expression during analysis with FlowJo software. The histograms represent the expression of pSTAT1 and pSTAT2 detected in uninfected, bystander (GFP-negative), and infected (GFP-positive) cells treated with either IFN-α or IFN-γ for 30 min or 24 h or left untreated. The data are representative of those from two similar independent experiments.
FIG 9
FIG 9
IRF9 is transcriptionally downregulated by VZV during infection. (A) Mean difference plot illustrating significant differences in the expression level of IRF9 (***, P < 0.0001) between experimental groups, where the y axis is the log CPM expression level. (B) Semiquantitative RT-PCR analysis of IRF9 transcripts, amplified from different regions of the 1,182-bp-long full-length RNA, in uninfected and VZV-infected HELFs. Poly(I·C) was used as a positive control for IRF9 induction in HELFs; GAPDH was the housekeeping gene control. The data are representative of those from two similar independent experiments. (C) Semiquantitative RT-PCR analysis of IRF9 transcripts in flow cytometry-sorted uninfected, bystander, and VZV-infected (V or V+) HELFs. The PCR products were run on a 1% agarose gel and imaged using a GelDoc system. The image was analyzed by ImageJ software to quantify the relative expression of IRF9 under each condition, as shown in the bar graph. The data are representative of those from two similar independent experiments. (D) Western blot analysis of IRF9 expression in unfractionated mock- and VZV-infected HELF lysates that were treated with proteasome (MG132) and lysosome (chloroquine) inhibitors or mock treated, as indicated. The data are representative of those from two similar independent experiments.
FIG 10
FIG 10
IRF9 is transcriptionally downregulated by the VZV-encoded IE62 protein. (A) Western blot analysis of IRF9 expression in HEK293 cells treated with IFN-α and transfected with control and IE62-, IE61-, and IE63-expressing plasmids. The relative expression of IRF9 in the presence of IFN-α and each of the three immediate early proteins was quantified using ImageJ software. IRF9 expression was normalized to GAPDH expression. (B) Quantitative PCR analysis of IRF9 transcript levels in HEK293 cells transfected with control and IE62-expressing plasmids. (C) Quantitative PCR analysis of IRF9 transcript levels in HEK293 cells transfected with control and IE62-, IE61-, and IE63-expressing plasmids. The quantitative PCR data analyses whose results are shown in panels B and C were done in Prism software. Each experiment was done in triplicate, and the error bars denote the standard error of the mean. The data shown are representative of those from three independent experiments. Ct, threshold cycle.

Similar articles

Cited by

  • Human IRF1 governs macrophagic IFN-γ immunity to mycobacteria.
    Rosain J, Neehus AL, Manry J, Yang R, Le Pen J, Daher W, Liu Z, Chan YH, Tahuil N, Türel Ö, Bourgey M, Ogishi M, Doisne JM, Izquierdo HM, Shirasaki T, Le Voyer T, Guérin A, Bastard P, Moncada-Vélez M, Han JE, Khan T, Rapaport F, Hong SH, Cheung A, Haake K, Mindt BC, Pérez L, Philippot Q, Lee D, Zhang P, Rinchai D, Al Ali F, Ahmad Ata MM, Rahman M, Peel JN, Heissel S, Molina H, Kendir-Demirkol Y, Bailey R, Zhao S, Bohlen J, Mancini M, Seeleuthner Y, Roelens M, Lorenzo L, Soudée C, Paz MEJ, González ML, Jeljeli M, Soulier J, Romana S, L'Honneur AS, Materna M, Martínez-Barricarte R, Pochon M, Oleaga-Quintas C, Michev A, Migaud M, Lévy R, Alyanakian MA, Rozenberg F, Croft CA, Vogt G, Emile JF, Kremer L, Ma CS, Fritz JH, Lemon SM, Spaan AN, Manel N, Abel L, MacDonald MR, Boisson-Dupuis S, Marr N, Tangye SG, Di Santo JP, Zhang Q, Zhang SY, Rice CM, Béziat V, Lachmann N, Langlais D, Casanova JL, Gros P, Bustamante J. Rosain J, et al. Cell. 2023 Feb 2;186(3):621-645.e33. doi: 10.1016/j.cell.2022.12.038. Cell. 2023. PMID: 36736301 Free PMC article.
  • Skin Viral Infections: Host Antiviral Innate Immunity and Viral Immune Evasion.
    Lei V, Petty AJ, Atwater AR, Wolfe SA, MacLeod AS. Lei V, et al. Front Immunol. 2020 Nov 6;11:593901. doi: 10.3389/fimmu.2020.593901. eCollection 2020. Front Immunol. 2020. PMID: 33240281 Free PMC article. Review.
  • Lack of strong innate immune reactivity renders macrophages alone unable to control productive Varicella-Zoster Virus infection in an isogenic human iPSC-derived neuronal co-culture model.
    Van Breedam E, Buyle-Huybrecht T, Govaerts J, Meysman P, Bours A, Boeren M, Di Stefano J, Caers T, De Reu H, Dirkx L, Schippers J, Bartholomeus E, Lebrun M, Sadzot-Delvaux C, Rybakowska P, Alarcón-Riquelme ME, Marañón C, Laukens K, Delputte P, Ogunjimi B, Ponsaerts P. Van Breedam E, et al. Front Immunol. 2023 May 23;14:1177245. doi: 10.3389/fimmu.2023.1177245. eCollection 2023. Front Immunol. 2023. PMID: 37287975 Free PMC article.
  • Tofacitinib downregulates antiviral immune defence in keratinocytes and reduces T cell activation.
    Hawerkamp HC, Domdey A, Radau L, Sewerin P, Oláh P, Homey B, Meller S. Hawerkamp HC, et al. Arthritis Res Ther. 2021 May 21;23(1):144. doi: 10.1186/s13075-021-02509-8. Arthritis Res Ther. 2021. PMID: 34020693 Free PMC article.
  • Functional paralysis of human natural killer cells by alphaherpesviruses.
    Campbell TM, McSharry BP, Steain M, Russell TA, Tscharke DC, Kennedy JJ, Slobedman B, Abendroth A. Campbell TM, et al. PLoS Pathog. 2019 Jun 13;15(6):e1007784. doi: 10.1371/journal.ppat.1007784. eCollection 2019 Jun. PLoS Pathog. 2019. PMID: 31194857 Free PMC article.

References

    1. Zerboni L, Sen N, Oliver SL, Arvin AM. 2014. Molecular mechanisms of varicella zoster virus pathogenesis. Nat Rev Microbiol 12:197–210. doi:10.1038/nrmicro3215. - DOI - PMC - PubMed
    1. Ku CC, Zerboni L, Ito H, Graham BS, Wallace M, Arvin AM. 2004. Varicella-zoster virus transfer to skin by T cells and modulation of viral replication by epidermal cell interferon-alpha. J Exp Med 200:917–925. doi:10.1084/jem.20040634. - DOI - PMC - PubMed
    1. Arvin AM, Koropchak CM, Williams BR, Grumet FC, Foung SK. 1986. Early immune response in healthy and immunocompromised subjects with primary varicella-zoster virus infection. J Infect Dis 154:422–429. doi:10.1093/infdis/154.3.422. - DOI - PubMed
    1. Weinberg A, Levin MJ. 2010. VZV T cell-mediated immunity. Curr Top Microbiol Immunol 342:341–357. doi:10.1007/82_2010_31. - DOI - PubMed
    1. Samuel CE. 2001. Antiviral actions of interferons. Clin Microbiol Rev 14:778–809. doi:10.1128/CMR.14.4.778-809.2001. - DOI - PMC - PubMed

Publication types

MeSH terms

LinkOut - more resources