. 2018 Sep 12;38(37):8011-8030.
doi: 10.1523/JNEUROSCI.0083-18.2018. Epub 2018 Aug 6.

Adult Ube3a Gene Reinstatement Restores the Electrophysiological Deficits of Prefrontal Cortex Layer 5 Neurons in a Mouse Model of Angelman Syndrome

Affiliations

Adult Ube3a Gene Reinstatement Restores the Electrophysiological Deficits of Prefrontal Cortex Layer 5 Neurons in a Mouse Model of Angelman Syndrome

Diana C Rotaru et al. J Neurosci. .

Abstract

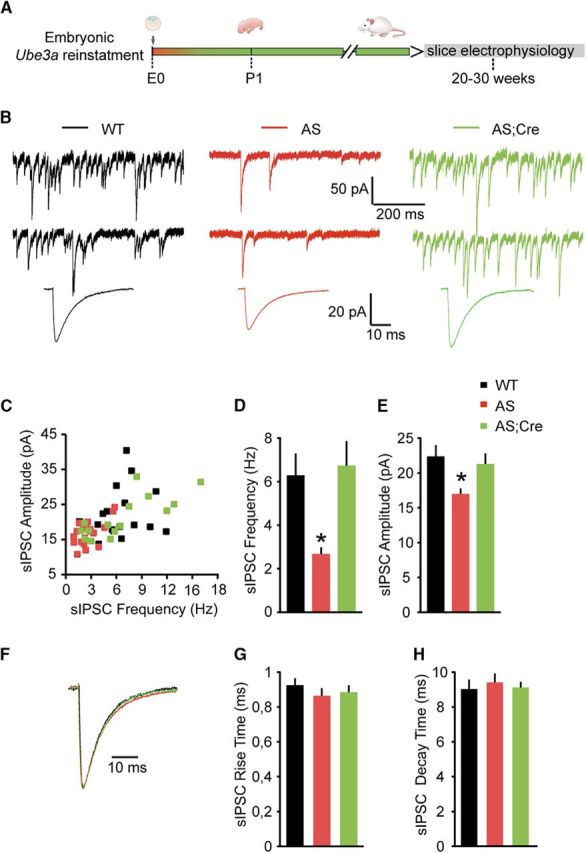
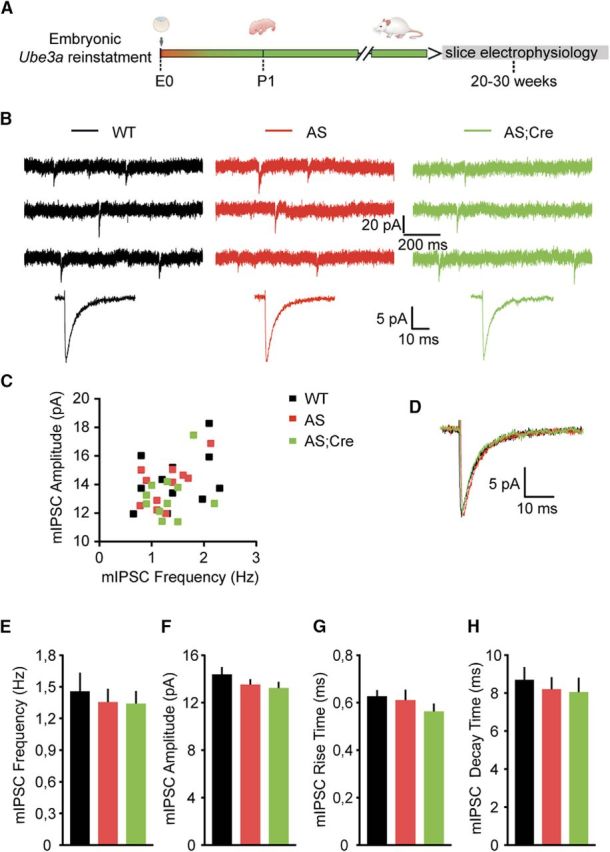
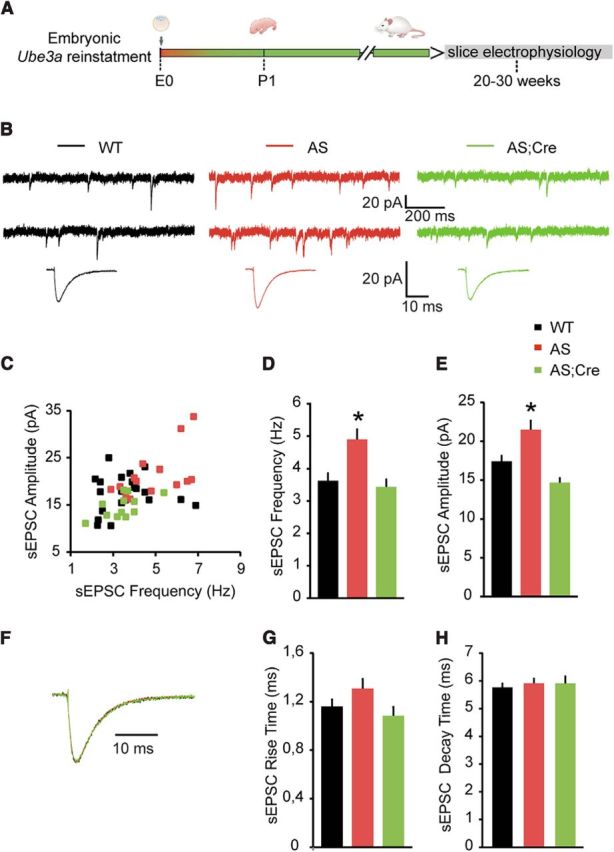
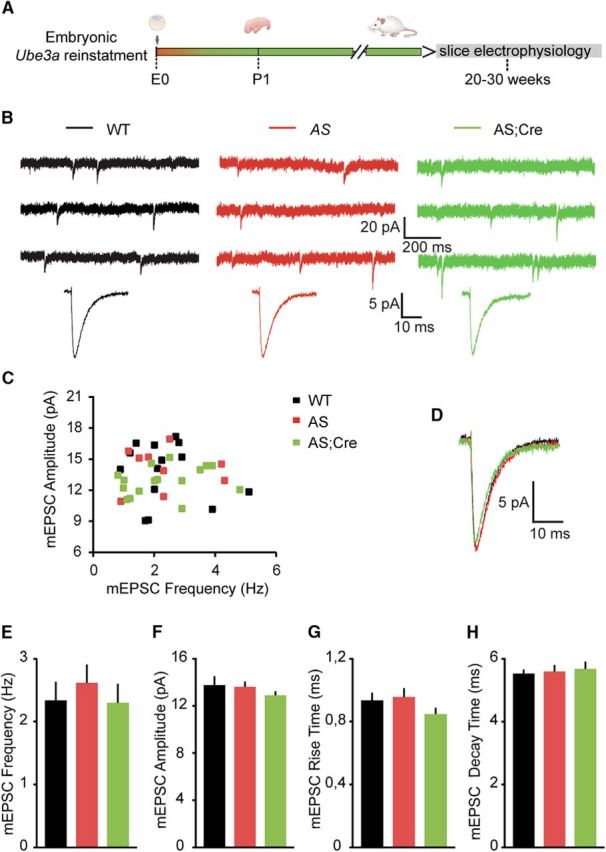
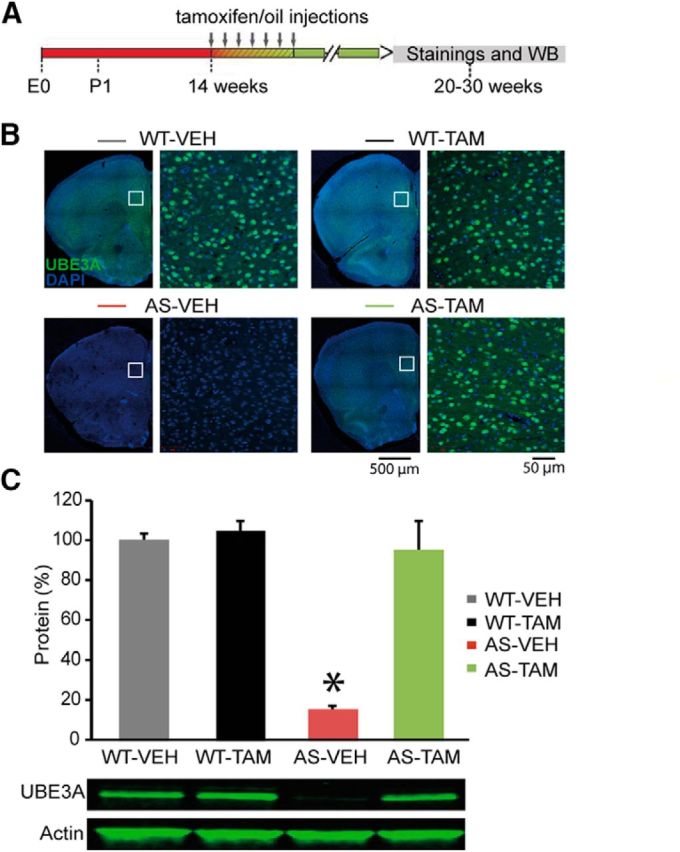
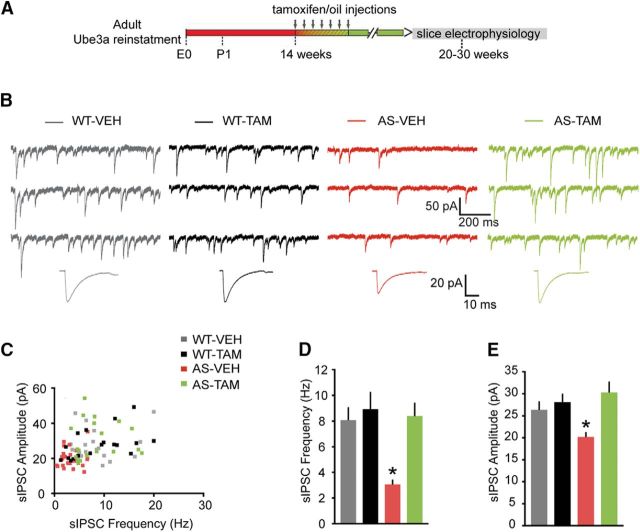
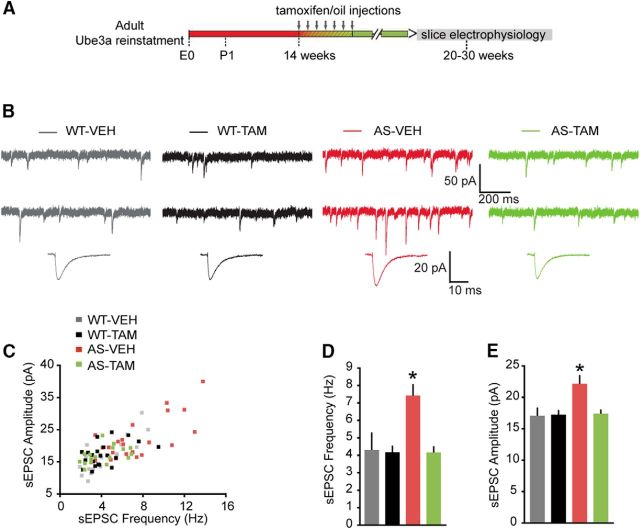
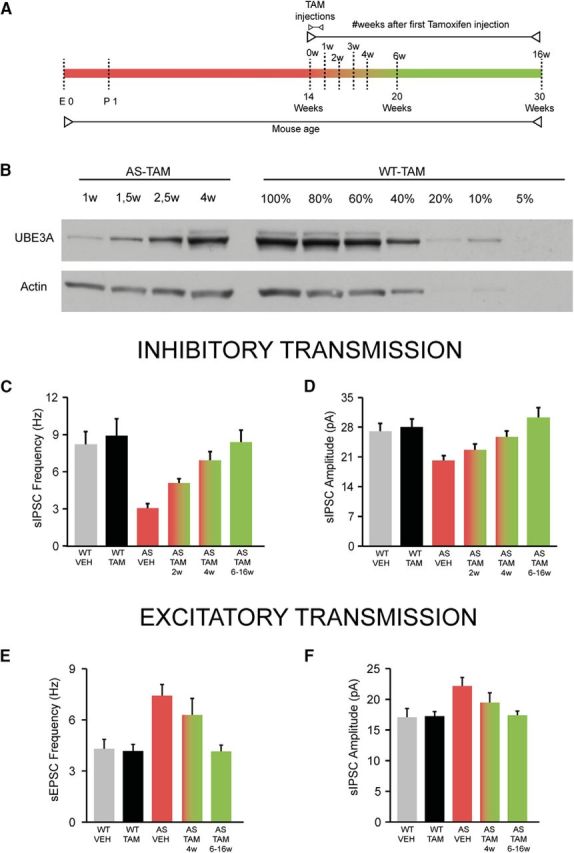
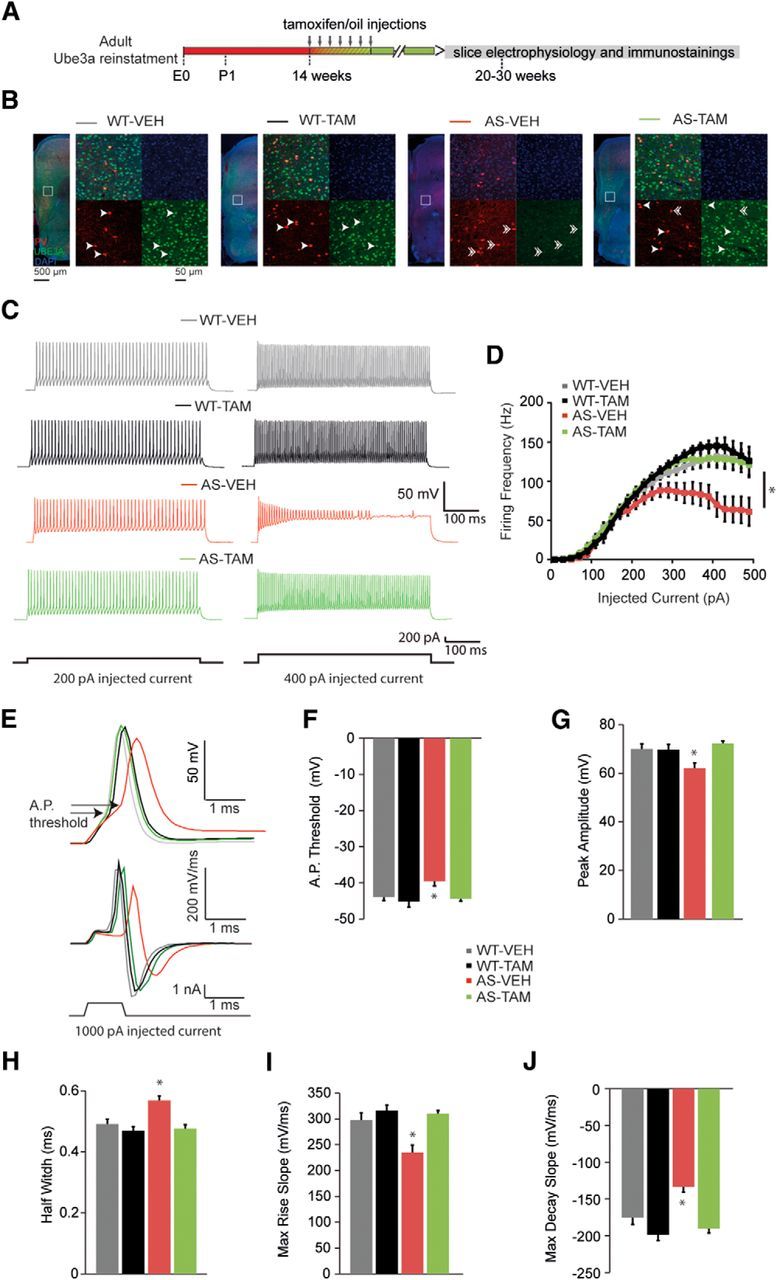
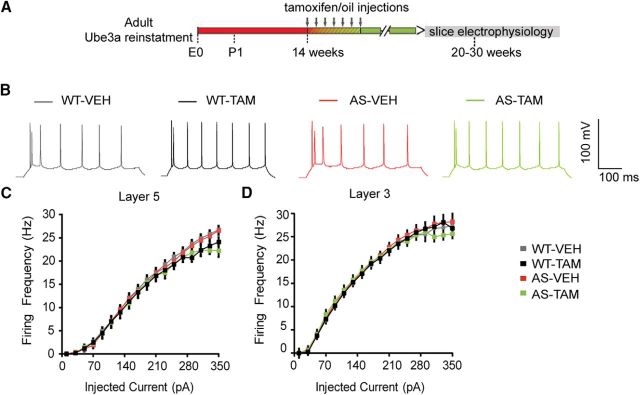
E3 ubiquitin ligase (UBE3A) levels in the brain need to be tightly regulated, as loss of functional UBE3A protein is responsible for the severe neurodevelopmental disorder Angelman syndrome (AS), whereas increased activity of UBE3A is associated with nonsyndromic autism. Given the role of mPFC in neurodevelopmental disorders including autism, we aimed to identify the functional changes resulting from loss of UBE3A in infralimbic and prelimbic mPFC areas in a mouse model of AS. Whole-cell recordings from layer 5 mPFC pyramidal neurons obtained in brain slices from adult mice of both sexes revealed that loss of UBE3A results in a strong decrease of spontaneous inhibitory transmission and increase of spontaneous excitatory transmission potentially leading to a marked excitation/inhibition imbalance. Additionally, we found that loss of UBE3A led to decreased excitability and increased threshold for action potential of layer 5 fast spiking interneurons without significantly affecting the excitability of pyramidal neurons. Because we previously showed that AS mouse behavioral phenotypes are reversible upon Ube3a gene reactivation during a restricted period of early postnatal development, we investigated whether Ube3a gene reactivation in a fully mature brain could reverse any of the identified physiological deficits. In contrast to our previously reported behavioral findings, restoring UBE3A levels in adult animals fully rescued all the identified physiological deficits of mPFC neurons. Moreover, the kinetics of reversing these synaptic deficits closely followed the reinstatement of UBE3A protein level. Together, these findings show a striking dissociation between the rescue of behavioral and physiological deficits.SIGNIFICANCE STATEMENT Here we describe significant physiological deficits in the mPFC of an Angelman syndrome mouse model. We found a marked change in excitatory/inhibitory balance, as well as decreased excitability of fast spiking interneurons. A promising treatment strategy for Angelman syndrome is aimed at restoring UBE3A expression by activating the paternal UBE3A gene. Here we find that the physiological changes in the mPFC are fully reversible upon gene reactivation, even when the brain is fully mature. This indicates that there is no critical developmental window for reversing the identified physiological deficits in mPFC.

Keywords: UBE3A; autistic disorder; disease models; ion channel; prefrontal cortex; synaptic transmission.


Figures

Figure 1.
Figure 1.
Embryonic reactivation of Ube3a expression rescues the spontaneous inhibitory neurotransmission in pyramidal neurons (PN) from mouse layer 5 PFC. A, Schematic representation of Ube3a reactivation during mouse embryonic development and time point of electrophysiological recordings. B, Top, Representative voltage-clamp recordings of sIPSCs from layer 5 PN obtained by clamping the neurons at −70 mV, in the presence of CNQX (10 μm), in Ube3amStop/p+ and WT littermates crossed with an embryonically active Cre line. Bottom, Average sIPSCs obtained by averaging at least 100 nonoverlapping individual events. AS mice show a clear decrease in both sIPSC frequency (B, top) and amplitude (B), which can be rescued by embryonic reactivation of the Ube3a gene in the AS;Cre mice. C, Raster plot of all the cells included in the analysis. Each dot indicates one cell, showing the amplitude of averaged sIPSCs and the sIPSC frequency. D, E, Average data representing mean ± SE, for sIPSC frequency and amplitude, respectively, in layer 5 PN. Number of neurons included in each group: WT, N = 18 neurons/6 mice; AS, N = 20 neurons/6 mice; AS;Cre, N = 17 neurons/6 mice. A one-way ANOVA shows a significant effect of the genotype on both frequency (F(2,52) = 9.182, p = 0.0001) and amplitude (F(2,52) = 5.63, p = 0.006). Post hoc Bonferroni: AS against WT (p = 0.002 for frequency, and p = 0.012 for amplitude), AS against AS;Cre (p = 0.002 for frequency, and p = 0.028 for amplitude), and WT against AS;Cre (p = 1 for frequency, and p = 1 for amplitude). F, Examples of scaled averaged sIPSCs from B (bottom), pointing to no changes in kinetic properties. G, H, Average data representing mean ± SE, for sIPSC 10–90 rise time and decay time, respectively, in layer 5 PN. No significant effect of genotype on either rise time (F(2,52) = 0.76, p = 0.4) or decay time (F(2,52) = 0.21, p = 0.8) is observed (one-way ANOVA). *indicates statistically significant differences for p < 0.05.
Figure 2.
Figure 2.
Loss of Ube3a expression does not affect the miniature inhibitory neurotransmission of pyramidal neurons from mouse mPFC. A, Schematic representation of Ube3a reactivation during mouse embryonic development and time point of electrophysiological recordings. B, Top, Representative voltage-clamp recordings of mIPSCs from layer 5 PN obtained by clamping the neurons at −70 mV, in the presence of CNQX (10 μm) and TTX (1 μm), in AS and WT littermates crossed with an embryonically active Cre line. Bottom, Average mIPSCs obtained by averaging at least 100 nonoverlapping individual events. No difference for any of the measured parameters is observed between groups. C, Raster plot of all the cells included in the analysis. Each dot indicates one cell, showing the amplitude of averaged mIPSCs and the mIPSC frequency. D, Overlapping averaged mIPSCs from B. Bottom, No changes in amplitude or kinetic properties. E–H, Average data representing mean ± SE, for mIPSC frequency, amplitude, rise and decay time constant, in layer 5 PN. Number of neurons included in each group: WT, N = 11 neurons/3 mice; AS, N = 11 neurons/3 mice; AS;Cre, N = 11 neurons/3 mice. No significant effect of genotype on frequency (F(2,30) = 0.36, p = 0.7), amplitude (F(2,30) = 1.19, p = 0.3), rise time (F(2,30) = 1.4, p = 0.2), or decay time (F(2,30) = 0.29, p = 0.74) is observed (one-way ANOVA).
Figure 3.
Figure 3.
Embryonic reactivation of Ube3a expression rescues the spontaneous excitatory neurotransmission of pyramidal neurons from mouse mPFC. A, Schematic representation of Ube3a reactivation during mouse embryonic development and time point of electrophysiological recordings. B, Top, Representative voltage-clamp recordings of sEPSCs from layer 5 PN obtained by clamping the neurons at −70 mV, in the presence of bicuculine (10 μm), in Ube3amStop/p+ and WT littermates crossed with an embryonically active Cre line. B, Bottom, Average sEPSCs obtained by averaging at least 100 nonoverlapping individual events. AS mice show a clear increase in both sEPSC frequency (B, top) and amplitude (B), which can be rescued by embryonic reactivation of the Ube3a gene in the AS;Cre mice. C, Raster plot of all the cells included in the analysis. Each dot indicates one cell, showing the amplitude of averaged sEPSC and the sEPSC frequency. D, E, Average data representing mean ± SE, for sEPSC frequency and amplitude in layer 5 PN. Number of neurons included in each group: WT, N = 22 neurons/5 mice; AS, N = 15 neurons/4 mice; AS;Cre, N = 12 neurons/4 mice. A one-way ANOVA shows a significant effect of the genotype on both frequency (F(2,46) = 6.8, p = 0.003) and amplitude (F(2,46) = 10.47, p = 0.0001). Post hoc Bonferroni: AS against WT (p = 0.007 for frequency, and p = 0.01 for amplitude), AS against AS;Cre (p = 0.007 for frequency, and p = 0.0001 for amplitude), and WT against AS;Cre (p = 1 for frequency, and p = 0.17 for amplitude). F, Examples of scaled averaged sEPSCs from B. Bottom, No changes in kinetic properties. G, H, Average data representing mean ± SE, for sIPSCs 10–90 rise time and decay time, respectively, in layer 5 PN. No significant effect of the genotype on either rise time (F(2,46) = 0.93, p = 0.4) or decay time (F(2,46) = 0.516, p = 0.6) is observed (one-way ANOVA). *indicates statistically significant differences for p < 0.05.
Figure 4.
Figure 4.
Loss of Ube3a expression does not affect the miniature excitatory neurotransmission of pyramidal neurons from mouse mPFC. A, Schematic representation of Ube3a reactivation during mouse embryonic development and time point of electrophysiological recordings. B, Top, Representative voltage-clamp recordings of mEPSCs from layer 5 PN obtained by clamping the neurons at −70 mV, in the presence of bicuculine (10 μm) and TTX (1 μm), in Ube3amStop/p+ and WT littermates crossed with an embryonically active Cre line. Bottom, Average mEPSCs obtained by averaging at least 100 nonoverlapping individual events. No difference for any of the measured parameters is observed between groups. C, Raster plot of all the cells included in the analysis. Each dot indicates one cell, showing the amplitude of averaged mEPSC and the mEPSC frequency. D, Overlapping averaged mEPSCs from B. Bottom, No changes in amplitude or kinetic properties. E–H, Average data representing mean ± SE, for mEPSC frequency, amplitude, rise and decay time constant, in layer 5 PN. Number of neurons included in each group: WT, N = 14 neurons/3 mice; AS, N = 16 neurons/4 mice; AS;Cre, N = 16 neurons/3 mice. No significant effect of the genotype on frequency (F(2,43) = 0.34, p = 0.71), amplitude (F(2,43) = 0.76, p = 0.47), rise time (F(2,43) = 1.42, p = 0.25), or decay time (F(2,43) = 0.12, p = 0.88) is observed (one-way ANOVA).
Figure 5.
Figure 5.
Adult Ube3a reinstatement restores UBE3A levels in mouse mPFC. A, Schematic representation of Ube3a reactivation during mouse embryonic development and time point of staining and Western blot analysis. B, UBE3A and DAPI stainings of PFC coronal sections from Ube3amStop/p+ and WT littermates crossed with inducible Cre (CreERT+) line treated with either vehicle or tamoxifen. Left, Overview of a coronal PFC section, acquired by tiled images obtained at 5× magnification. Right, Zoomed-in image of the white square on the left image, obtained at 20× magnification. There is a presence of UBE3A in the majority of neurons in WT-VEH/TAM mice and a lack of UBE3A in AS-VEH. Tamoxifen treatment restores UBE3A in AS-TAM mice. C, Western blot analysis of UBE3A protein expression in frontal cortex. Average data representing mean ± SE. Number of animals included in each group: WT-VEH, N = 3 mice; WT-TAM, N = 2; AS-VEH, N = 4 mice; AS-TAM, N = 2 mice. Two-way ANOVA (genotype × treatment) showed a significant interaction between genotype (WT;CreERT+ and Ube3amStop/p+;CreERT+) and treatment (vehicle or tamoxifen), (F(1,10) = 44.845, p = 0.0001). Post hoc Bonferroni: AS-VEH against WT-VEH (p = 0.001), AS-VEH against WT-TAM (p = 0.0001), and AS-VEH against AS-TAM (p = 0.001). *indicates statistically significant differences for p < 0.05.
Figure 6.
Figure 6.
Adult reactivation of Ube3a expression rescues the spontaneous inhibitory neurotransmission of pyramidal neurons from mouse mPFC. A, Schematics representing Ube3a reactivation achieved by tamoxifen administration (gray arrows) and time point of electrophysiological recordings. B, Top, Representative voltage-clamp recordings of sIPSCs from layer 5 PN obtained by clamping the neurons at −70 mV, in the presence of CNQX (10 μm), in Ube3amStop/p+ and WT littermates crossed with inducible Cre (CreERT+) line treated with either vehicle or tamoxifen. Bottom, Average sIPSCs obtained by averaging at least 100 nonoverlapping individual events. Ube3amStop/p+;CreERT+ mice treated with vehicle show a clear decrease in both sIPSC frequency and amplitude, which can be rescued by adult reactivation of the Ube3a gene in the Ube3amStop/p+;CreERT+ mice treated with tamoxifen. C, Raster plot of all the cells included in the analysis. Each dot indicates one cell, showing the amplitude of averaged sIPSCs and the sIPSC frequency. D, E, Average data representing mean ± SE, for sIPSC frequency and amplitude in layer 5 PN. Number of neurons included in each group: WT-VEH, N = 21 neurons/4 mice; WT-TAM, N = 18 neurons/6 mice; AS-VEH, N = 24 neurons/4 mice; AS-TAM, N = 19 neurons/6 mice. Two-way ANOVA (genotype × treatment) showed a significant interaction between genotype (WT;CreERT+ and Ube3amStop/p+;CreERT+) and treatment (vehicle or tamoxifen), for both frequency (F(1,78) = 5.96, p = 0.017) and amplitude (F(1,78) = 6.05, p = 0.016) (two-way ANOVA). Post hoc Bonferroni: AS-VEH against WT-VEH (p = 0.001 for frequency, and p = 0.043 for amplitude), AS-VEH against WT-TAM (p = 0.0001 for frequency, and p = 0.02 for amplitude), and AS-VEH against AS-TAM (p = 0.001 for frequency, and p = 0.001 for amplitude). *indicates statistically significant differences for p < 0.05.
Figure 7.
Figure 7.
Adult reactivation of Ube3a expression rescues the spontaneous excitatory neurotransmission of pyramidal neurons from mouse mPFC. A, Schematics representing Ube3a reactivation achieved by tamoxifen administration (gray arrows) and time point of electrophysiological recordings. B, Top, Representative voltage-clamp recordings of sEPSCs from layer 5 PN obtained by clamping the neurons at −70 mV, in the presence of bicuculline (10 μm), in AS and WT littermates treated with either vehicle or tamoxifen. Bottom, Average sEPSCs obtained by averaging at least 100 nonoverlapping individual events. AS-VEH show a clear increase in both sEPSC frequency and amplitude, which can be rescued by adult reactivation of the Ube3a gene in the AS-VEH mice treated with tamoxifen. C, Raster plot of all the cells included in the analysis. Each dot indicates one cell, showing the amplitude of averaged sEPSC and the sEPSC frequency. D, E, Average data representing mean ± SE, for sIPSC frequency and amplitude in layer 5 PN. Number of neurons included in each group: WT-VEH, N = 18 neurons/5 mice; WT-TAM, N = 22 neurons/7 mice; AS-VEH, N = 22 neurons/7 mice; AS-TAM, N = 20 neurons/5 mice. Two-way ANOVA (genotype × treatment) showed a significant interaction between genotype (WT and AS) and treatment (vehicle and tamoxifen); for both frequency (F(1,78) = 9.88, p = 0.002) and amplitude (F(1,78) = 5.30, p = 0.024; two-way ANOVA). Post hoc Bonferroni: AS-VEH against WT-VEH (p = 0.0001 for frequency, and p = 0.009 for amplitude), AS-VEH against WT-TAM (p = 0.0001 for frequency, and p = 0.007 for amplitude), and AS-VEH against AS-TAM (p = 0.0001 for frequency, and p = 0.013 for amplitude). *indicates statistically significant differences for p < 0.05.
Figure 8.
Figure 8.
The restoration of the in inhibitory and excitatory transmission parallels the restoration of the UBE3A levels. A, Schematics representing Ube3a reactivation achieved by tamoxifen administration (TAM injections, lasting 1 week) and time point of Western blot analysis and electrophysiological recordings. Color gradients reflect the gradual restoration of UBE3A levels, spanning over a period of 4–6 weeks. B, Representative Western blot showing UBE3A expression following gene reinstatement (weeks following the first tamoxifen injection) in AS-TAM mice and a comparative gradient of protein levels (amount of protein loaded per lane in percent) in WT-TAM. C, D, Timeline of the recovery for inhibitory transmission. Average data representing mean ± SE, for sIPSC frequency and amplitude in layer 5 PN. For comparison, the same data presented in Figure 6D, E were also included in these bar graphs, along with two other groups of experiments obtained at 2 weeks (AS-TAM 2w) and at 4 weeks (AS-TAM 4w) after the first tamoxifen injection in the AS-TAM mice. The AS-TAM 6–16w group is identical with the AS-TAM group in Figure 6D, E. Number of neurons included in each group: identical with Figure 6D, E: WT-VEH, N = 21 neurons/4 mice; WT-TAM, N = 18 neurons/6 mice; AS-VEH, N = 24 neurons/4 mice; AS-TAM 2w, N = 21 neurons/3 mice; AS-TAM 4w, N = 25 neurons/3 mice; AS-TAM 6–16w (same group as AS-TAM in Fig. 6D,E), N = 19 neurons/6 mice one-way ANOVA (genotype) showed a significant effect for both frequency (F(5,116) = 6.04, p = 0.0001) and amplitude (F(1,116) = 5.43, p = 0.0001). Post hoc Bonferroni: AS-VEH against WT-VEH (p = 0.002 for frequency, and p = 0.05 for amplitude), AS-VEH against WT-TAM (p = 0.001 for frequency, and p = 0.02 for amplitude), and AS-VEH against AS-TAM (p = 0.002 for frequency, and p = 0.001 for amplitude). E, F, Timeline of recovery for excitatory transmission. Average data representing mean ± SE, for sEPSC frequency and amplitude in layer 5 PN. For comparison, the same data presented in Figure 7D, E were also included in these bar graphs, along with one other group of experiments obtained at 4 weeks (AS-TAM 4w) after the first tamoxifen injection in the AS-TAM mice. The AS-TAM 6–16w group is identical with the AS-TAM group in Figure 7. Number of neurons included in each group: identical with Figure 7D, E: WT-VEH, N = 18 neurons/5 mice; WT-TAM, N = 22 neurons/7 mice; AS-VEH, N = 22 neurons/7 mice; AS-TAM; AS-TAM 4w, N = 14 neurons/2 mice; and AS-TAM 6–16w (same group as AS-TAM in Fig. 7D, E), N = 20 neurons/5 mice. One-way ANOVA (genotype) showed a significant effect for both frequency (F(4,91) = 7.13, p = 0.0001) and amplitude (F(4,91) = 5.30, p = 0.006). Post hoc Bonferroni: AS-VEH against WT-VEH (p = 0.002 for frequency, and p = 0.02 for amplitude), AS-VEH against WT-TAM (p = 0.001 for frequency, and p = 0.019 for amplitude), and AS-VEH against AS-TAM (p = 0.001 for frequency, and p = 0.032 for amplitude).
Figure 9.
Figure 9.
Adult reactivation of Ube3a expression rescues the excitability of FS interneurons from mouse PFC. A, Schematics representing Ube3a reactivation achieved by tamoxifen administration (gray arrows) and time point of electrophysiological recordings and immunostainings. B, UBE3A, parvalbumin (PV), and DAPI stainings of PFC coronal sections from Ube3amStop/p+ and WT littermates crossed with inducible Cre (CreERT+) line treated with either vehicle or tamoxifen. Left, Overview of a coronal mPFC section, acquired by tiled images obtained at 5× magnification. Right, Zoomed-in image, (white square on left), obtained at 20× magnification containing 4 individual images showing the following: stainings for PV+UBE3A+DAPI (top left), DAPI (top right), PV (bottom left), UBE3A (bottom right). Arrows indicate PV+ interneurons that costain for UBE3A. Double arrows indicate PV+ interneurons that lack UBE3A. There is a presence of UBE3A in PV interneurons from WT-VEH/TAM, and the lack of UBE3A in staining in PV interneurons from AS-VEH. Tamoxifen treatment restores UBE3A in PV interneurons from AS-TAM mice. C, Representative firing patterns from layer 5 FS interneurons, obtained by delivering 200 pA (left) and 400 pA (right) depolarizing square pulses of 500 ms duration in AS and WT littermates crossed with treated with either vehicle or tamoxifen. AS-VEH show a clear decrease in the firing frequency with 400 pA current injection. The firing frequency can be rescued by adult reactivation of the Ube3a gene in the AS-TAM. D, Averages of input-output curves showing a clear drop in firing frequency in AS-VEH with current injection >300 pA. This decrease is rescued by adult reactivation of the Ube3a gene in the AS-TAM. Number of neurons included in each group: WT-VEH, N = 17 neurons/5 mice; WT-TAM, N = 14 neurons/3 mice; AS-VEH, N = 15 neurons/6 mice; AS-TAM, N = 25 neurons/5 mice. Two-way ANOVA (genotype × treatment) showed a significant interaction between genotype (WT and AS) and treatment (vehicle and tamoxifen), for firing frequency (F(1,68) = 4.98, p = 0.029). Post hoc Bonferroni: AS-VEH against WT-VEH (p = 0.01), AS-VEH against WT-TAM (p = 0.002), and AS-VEH against AS-TAM (p = 0.001). FS neurons from AS-VEH responded with significantly less spikes when current injection was >300 pA. E, Overlapping examples of single AP (top) and their first derivative (dV/dt) (middle), triggered by a current injection of 1 ms and 1 nA (bottom). There is a more depolarized threshold as well as smaller amplitude of AP and in AS-VEH mice compared with WT-VEH/TAM, which are rescued by gene reinstatement in the AS-TAM. Additionally, the first derivative of the AP trace shows decreased maximum rise and decay slopes in rate of depolarization AS-VEH mice. F–J, Averages of AP threshold, amplitude, half-width, maximum rise slope, and maximum decay slope indicate significant differences (*) between AS-VEH mice compared with WT-VEH/TAM, which is rescued by gene reinstatement in the AS-TAM. Number of neurons included in each group, as well as statistical tests used, are included in Table 3.
Figure 10.
Figure 10.
Loss of UBE3A does not affect the excitability of pyramidal neurons from mouse mPFC. A, Schematics representing Ube3a reactivation achieved by tamoxifen administration (gray arrows) and time point of electrophysiological recordings. B, Representative firing patterns from layer 5 pyramidal neurons, obtained by delivering 180 pA depolarizing square pulses of 500 ms duration in AS and WT littermates treated with either vehicle or tamoxifen. No difference can be observed between genotypes. C, D, Averages of input-output curves from pyramidal neurons in layer 5 and layer 3, respectively, pointing to a lack of significant effect between groups in both layers. Number of neurons included in each group: Layer 5: WT-VEH, N = 26 neurons/6 mice; WT-TAM, N = 20 neurons/5 mice; AS-VEH, N = 32 neurons/7 mice; AS-TAM, N = 24 neurons/8 mice. Two-way ANOVA (genotype × treatment) showed no significant interaction between genotype (WT and AS) and treatment (vehicle and tamoxifen), for firing frequency (F(1,100) = 0.16, p = 0.68; two-way ANOVA). Layer 3: WT-VEH, N = 32 neurons/6 mice; WT-TAM, N = 24 neurons/3 mice; AS-VEH, N = 35 neurons/5 mice; AS-TAM, N = 22 neurons/3 mice. A two-way ANOVA showed also no significant interaction between genotype (WT and AS) and treatment (vehicle and tamoxifen), for firing frequency (F(1,100) = 0.19, p = 0.66).

Similar articles

Cited by

References

    1. Adhikari A, Lerner TN, Finkelstein J, Pak S, Jennings JH, Davidson TJ, Ferenczi E, Gunaydin LA, Mirzabekov JJ, Ye L, Kim SY, Lei A, Deisseroth K (2015) Basomedial amygdala mediates top-down control of anxiety and fear. Nature 527:179–185. 10.1038/nature15698 - DOI - PMC - PubMed
    1. Aghakhanyan G, Bonanni P, Randazzo G, Nappi S, Tessarotto F, De Martin L, Frijia F, De Marchi D, De Masi F, Kuppers B, Lombardo F, Caramella D, Montanaro D (2016) From cortical and subcortical grey matter abnormalities to neurobehavioral phenotype of Angelman syndrome: a voxel-based morphometry study. PLoS One 11:e0162817. 10.1371/journal.pone.0162817 - DOI - PMC - PubMed
    1. Auger C, Marty A (2000) Quantal currents at single-site central synapses. J Physiol 526:3–11. 10.1111/j.1469-7793.2000.t01-3-00003.x - DOI - PMC - PubMed
    1. Babst M. (2014) Quality control: quality control at the plasma membrane: one mechanism does not fit all. J Cell Biol 205:11–20. 10.1083/jcb.201310113 - DOI - PMC - PubMed
    1. Balleine BW, O'Doherty JP (2010) Human and rodent homologies in action control: corticostriatal determinants of goal-directed and habitual action. Neuropsychopharmacology 35:48–69. 10.1038/npp.2009.131 - DOI - PMC - PubMed

Publication types

MeSH terms

Substances