. 2018 Aug 1;9(1):3011.
doi: 10.1038/s41467-018-05414-y.

Exploring the role of stromal osmoregulation in cancer and disease using executable modelling

Affiliations

Exploring the role of stromal osmoregulation in cancer and disease using executable modelling

David Shorthouse et al. Nat Commun. .

Abstract

Osmotic regulation is a vital homoeostatic process in all cells and tissues. Cells initially respond to osmotic stresses by activating transmembrane transport proteins to move osmotically active ions. Disruption of ion and water transport is frequently observed in cellular transformations such as cancer. We report that genes involved in membrane transport are significantly deregulated in many cancers, and that their expression can distinguish cancer cells from normal cells with a high degree of accuracy. We present an executable model of osmotic regulation and membrane transport in mammalian cells, providing a mechanistic explanation for phenotype change in varied disease states, and accurately predicting behaviour from single cell expression data. We also predict key proteins involved in cellular transformation, SLC4A3 (AE3), and SLC9A1 (NHE1). Furthermore, we predict and verify a synergistic drug combination in vitro, of sodium and chloride channel inhibitors, which target the osmoregulatory network to reduce cancer-associated phenotypes in fibroblasts.


Conflict of interest statement

The authors declare no competing interests.

Figures
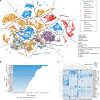
Fig. 1
Fig. 1
Analysis of TCGA gene expression data. a Using the t-SNE dimension reduction technique applied to ion channels/membrane protein gene expression alone we show that samples cluster into subgroups classified by their cellular origin (blue—mesoderm, orange—endoderm, red—ectoderm, purple—ectoderm/mesoderm, grey—unknown), and whether they are from a sample determined to be cancer or non-cancer (dark vs. light colours). We overlay the plot with a Voronoi surface calculated from k-means centres. Within each Voronoi tile is a number, relating to the legend, which denotes the majority tissue/organ of origin of each sample in that tile. Applying a binary classification machine learning method to classify cancer vs. non-cancer sample types results in high classification accuracy. Feature weights are then extracted from the model. b Shown are the top 25 weighted features for subsamples of mesoderm origin, in particular, there are a large number of genes encoding proteins involved in movement of water—aquaporins, or involved in the osmotic response such as SLC12A1, encoding the sodium-potassium-chloride symporter NKCC2 (starred). c Taking 25 randomly selected samples of non-cancer and cancer subtypes we plot the expression of the 25 top weighted features described previously, and show that even within a small random subset of the data, differences can be discerned in the expression of these genes between non-cancer and cancer cells
Fig. 2
Fig. 2
Qualitative network model of osmotic regulation. a Schematic of qualitative network that responds to osmotic pressure. An abstract node for external ions is included, and changes within this node lead to pressure felt by the cell via the osmotic pressure sensor node. Channels involved in the appropriate osmotic response (influx of ions under high osmotic pressure, efflux under low osmotic pressure) are activated or upregulated resulting in an appropriate response to return pressure to normal. The model includes the core osmotic machinery, appropriate ions (sodium, potassium, chloride, and calcium), and abstract nodes for the overall control of external ions, pressure felt by the cell, and cell size. The total model contains 20 nodes. b Simulations of the network reveal the cell response to altered osmotic pressure. Simulations are allowed to stabilise, before osmotic pressure is perturbed through increasing or decreasing the external ions node. This leads to a cascade of events in which the osmotic pressure sensor node recognises the difference between external and internal ion concentrations, leading to a decrease (top) or increase (bottom) of cell size in response to hypertonicity (top) or hypotonicity (bottom), before channels are activated in order to rectify pressure changes, and the cell returns to a normal size
Fig. 3
Fig. 3
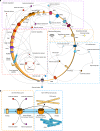
Qualitative Network Model of the wider ion channel regulatory network. a, b Schematic of the network of ion channels involved in the model (a). Included are modules that involve osmotic regulation, calcium signalling, metabolism, and pH maintenance. Modules interact with each other heavily, and in particular osmotic regulation proteins are involved in many other modules. The schematic includes general trends of interactions, and does not show all nodes for completeness, but attempts to show the major protein types involved in each module, and the ionic behaviours considered. Individual nodes, however, can be much more complex than represented in the schematic, one example is shown in (b) of the Na-K-ATPase. In this case the Na-K-ATPase is split into two nodes, one representing the ion transport domain, and one representing the structural interactions of the domain. Both nodes interact with each other as they are part of the same protein, but subunits that associate in the protein complex elicit different effects. FXYD6 influences the ion transport domain only, whereas FXYD5 influences both the ion transport domain, and the structurally connected beta subunit domain, which interacts with the cytoskeleton and cell matrix independently of transport function. This separation of functional subdomains of the protein can also be used to incorporate phosphorylation states of the protein, where two nodes represent an unphosphorylated and phosphorylated state of the same protein
Fig. 4
Fig. 4
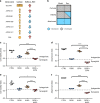
The qualitative network explains cellular phenotypes of Stromal cells in varying experimental conditions. Membrane proteins deregulated under varying stimuli, showing a Transport proteins deregulated in Early (ETDLN) and Late (LTDLN) stage after exposure to TFs, and after exposure to LPS. Proteins are upregulated (red arrows), downregulated (blue arrows), or unchanged (grey) in response to TFs or LPS. b Phenotype change for FRCs upon exposure to TFs for Early (ETDLN) and Late (LTDLN) stage. The Model output represents the physiological behaviour predicted by the model, and the experimental output represents the behaviour observed or implied at the cellular level from experiments or the gene array, and is independent of the model (see methods). Boxes containing two colours indicate phenotypes where there is contradictions/data is unclear. The model predicts an increase in viability, and a sustained increase in attachment and movement/membrane dynamics. Specific protein activity loss predictions are verified with experiments. c, d Knockdown of genes for (c) ATP2A3, and its effect on cellular attachment. The cascade predicted by the model to be underpinning this behaviour change is seen in part (d). e, f Also shown are siRNA knockdowns for SLC9A1 and its effect on cell viability (e), and FXYD5 and its effect on viability and attachment (f). Predicted mechanisms for these knockdowns are included in Supplementary Fig. 6. *P < 0.05, **P < 0.01, ***P < 0.001 using two-tailed unpaired t-test. Error bars represent standard deviation. Shown are 11 replicates (c), and 9 replicates (e, f)
Fig. 5
Fig. 5
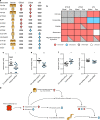
Application of the qualitative network to murine embryonic fibroblasts. Expansion of the QN to p53−/−, KrasG12D/+ (HET) and p53−/−, KrasG12D/G12D (HOM) MEFs. a Transport proteins deregulated within HOM MEFs when compared to HET MEFs. Proteins are upregulated (red arrows), downregulated (blue arrows), or unchanged (grey). b Phenotype change for MEFS when HOM MEFs are compared to HET MEFs. The model output represents the physiological behaviour predicted by the model when proteins from (a) are deregulated in the model in the same manner as in the gene array. Experimental phenotype represents behaviour reported previously, where it is known. The model predicts that attachment will be significantly different between the two cell types, but viability and cell size will remain unchanged. c Effects of application of channel inhibitors to HOM MEFs in vitro showing application of 10 µM DIDs for 72 h, resulting in decreased cellular attachment (left), and application of 10 nM EIPA ± 10 µM DIDs (right). Data are technical replicates. Dotted lines represent calculated Bliss independence values. d Effects of application of 10 µM DIDs ± 10 nM EIPA on viability in HOM MEFs. e Effects of application of 10 µM DIDs ± 10 nM AHCL on attachment in HOM MEFs. f Effects of application of 10 µM DIDs ± 10 nM AHCL on viability in HOM MEFs.*P < 0.05, ***P < 0.001, using two tailed unpaired t-test. Error bars represent standard deviation. Shown are 5 replicates (c), and 4 replicates (df)

Similar articles

Cited by

References

    1. Okada Y, et al. Receptor-mediated control of regulatory volume decrease (RVD) and apoptotic volume decrease (AVD) J. Physiol. 2001;532:3–16. doi: 10.1111/j.1469-7793.2001.0003g.x. - DOI - PMC - PubMed
    1. Lang F. Mechanisms and significance of cell volume regulation. J. Am. Coll. Nutr. 2007;26:613S–623S. doi: 10.1080/07315724.2007.10719667. - DOI - PubMed
    1. Kruse, E., Uehlein, N. & Kaldenhoff, R. The aquaporins. Genome Biol.7, 206 (2006). - PMC - PubMed
    1. Ho SN. Intracellular water homeostasis and the mammalian cellular osmotic stress response. J. Cell. Physiol. 2006;206:9–15. doi: 10.1002/jcp.20445. - DOI - PubMed
    1. Hoffmann EK, Lambert IH, Pedersen SF. Physiology of cell volume regulation in vertebrates. Physiol. Rev. 2009;89:193–277. doi: 10.1152/physrev.00037.2007. - DOI - PubMed

Publication types

LinkOut - more resources