. 2018 Aug 1;10(8):2023-2036.
doi: 10.1093/gbe/evy149.

Species-Specific Changes in a Primate Transcription Factor Network Provide Insights into the Molecular Evolution of the Primate Prefrontal Cortex

Affiliations

Species-Specific Changes in a Primate Transcription Factor Network Provide Insights into the Molecular Evolution of the Primate Prefrontal Cortex

Stefano Berto et al. Genome Biol Evol. .

Abstract

The human prefrontal cortex (PFC) differs from that of other primates with respect to size, histology, and functional abilities. Here, we analyzed genome-wide expression data of humans, chimpanzees, and rhesus macaques to discover evolutionary changes in transcription factor (TF) networks that may underlie these phenotypic differences. We determined the co-expression networks of all TFs with species-specific expression including their potential target genes and interaction partners in the PFC of all three species. Integrating these networks allowed us inferring an ancestral network for all three species. This ancestral network as well as the networks for each species is enriched for genes involved in forebrain development, axonogenesis, and synaptic transmission. Our analysis allows us to directly compare the networks of each species to determine which links have been gained or lost during evolution. Interestingly, we detected that most links were gained on the human lineage, indicating increase TF cooperativity in humans. By comparing network changes between different tissues, we discovered that in brain tissues, but not in the other tissues, the human networks always had the highest connectivity. To pinpoint molecular changes underlying species-specific phenotypes, we analyzed the sub-networks of TFs derived only from genes with species-specific expression changes in the PFC. These sub-networks differed significantly in structure and function between the human and chimpanzee. For example, the human-specific sub-network is enriched for TFs implicated in cognitive disorders and for genes involved in synaptic plasticity and cognitive functions. Our results suggest evolutionary changes in TF networks that might have shaped morphological and functional differences between primate brains, in particular in the human PFC.


Figures
<sc>Fig</sc>. 1.
Fig. 1.
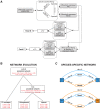
—Methodological workflow for calculating wTO networks. (A) Schematic of analytical workflow: data set comprising PFC samples of adult individuals per each species has been used to identify the species-specifically differentially expressed genes and TFs. Differentially expressed TFs and Genes were used for calculating two types of networks, (B) for inferring network evolution and (C) species-specifically changed EC-sub-networks, using a stringent criteria for correlation and nominal P value cutoffs. (B) Network evolution: We calculated Spearman rank correlations for each of the TFs with species-specific expression with all expressed genes. Correlated genes were filtered according to the criteria shown in red in each box, whereby pval stands for the P value of the correlation and rho for the correlation strength, which needed to have the same sign (positive or negative) in the species to inferred that a link was present in the networks of the ancestors of these species. We then calculated a wTO network from all genes that passed the respective filtering criteria for humans, chimpanzees, rhesus macaques, the HC-, and the HCR macaque-ancestor. A comparison of these five networks allowed us to investigate the evolution of network links. (C) Species-specific EC-sub-networks: For the species-specific EC-sub-networks we only considered TFs that were changed in expression in the respective species. Their correlated genes (Spearman rank correlation, P<0.05) were filtered for also being species-specifically expressed in the same species and for displaying an expression change that is in the direction that is in agreement with the direction of the expression change of the TF and the sign of the correlation to that TF (see text). In blue, species-specifically upregulated TFs and correlated genes; in orange, species-specifically downregulated TFs and correlated genes. The wTO of the species-specific sub-networks were calculated from the genes that passed this filter.
<sc>Fig</sc>. 2.
Fig. 2.
—Human-specific differential expression. Expression patterns of human-specifically changed “Brain TFs,” that is, TFs that are known to be involved in brain functions and disorders are displayed. Shown are Z-scores. Red = high expression, blue = low expression in human PFC.
<sc>Fig</sc>. 3.
Fig. 3.
—Ancestral and species-specific links in the TF wTO network of the PFC. In light blue are links common to the human, chimpanzee, and rhesus macaque network; in purple are links common to the human and chimpanzee network; in green are rhesus macaque-specific links; in red are chimpanzee-specific links; and in blue are human-specific links. Highlighted are the hubs of each network. Note that we cannot predict links that have been lost during evolution.
<sc>Fig</sc>. 4.
Fig. 4.
—Gain and loss of links during primate evolution. Shown are (A) BBX, as an example for a TF with relatively little changes in connectivity, and (B) CC2D1A, as an example for a TF with gain of many human-specific links. Numbers represent how many links were gained on each lineage.
<sc>Fig</sc>. 5.
Fig. 5.
—Species network differences in multiple tissues. (A) Multidimensional scaling plot representing the Euclidean distances between the wTO networks calculated based on all wTO values of each network. In red, the PFC samples of Bozek et al. (2014) (adPFC); in green, the visual cortec (VIS) samples of Bozek et al. (2014); in blue, the cerebellum (CBC) samples of Bozek et al. (2014); in black, the PFC; in brown, the kidney (KD) samples of Bozek et al. (2014); in pink, the muscle (MSC) samples of Bozek et al. (2014). The networks of the rhesus macaque PFC and CBC are the most different ones. (B) Change in connectivity per million years of all TF wTO networks. lsPFC refers to the data set from Somel et al. (2011), while adPFC represents the Bozek et al. (2014) data set. Human networks have a higher number of changes compared with the other primates in brain regions. (C) One-sided Wilcoxon signed rank test comparing connectivity between human and non-human primates. Humans showed a greater connectivity compared with chimpanzee and rhesus macaques in all brain regions whereas not in kidney and muscle.
<sc>Fig</sc>. 6.
Fig. 6.
—Species-specific EC-sub networks. On the top part, the PFC from Bozek et al. (2014) (adPFC) EC-sub-networks and on the bottom, the PFC (adPFC) EC-sub-networks. (A) Human EC-sub-networks. (B) Chimpanzee EC-sub-networks. In blue, the up-regulated TFs are shown. In orange, the down-regulated TFs are shown. TFs with expression changes into the same direction are connected by a blue link whereas TFs with expression changes into opposite directions by an orange link. The size of the nodes is proportional to the number of links the node has.

Similar articles

Cited by

  • Genomics at cellular resolution: insights into cognitive disorders and their evolution.
    Berto S, Liu Y, Konopka G. Berto S, et al. Hum Mol Genet. 2020 Sep 30;29(R1):R1-R9. doi: 10.1093/hmg/ddaa117. Hum Mol Genet. 2020. PMID: 32566943 Free PMC article. Review.
  • Identifying nootropic drug targets via large-scale cognitive GWAS and transcriptomics.
    Lam M, Chen CY, Ge T, Xia Y, Hill DW, Trampush JW, Yu J, Knowles E, Davies G, Stahl EA, Huckins L, Liewald DC, Djurovic S, Melle I, Christoforou A, Reinvang I, DeRosse P, Lundervold AJ, Steen VM, Espeseth T, Räikkönen K, Widen E, Palotie A, Eriksson JG, Giegling I, Konte B, Hartmann AM, Roussos P, Giakoumaki S, Burdick KE, Payton A, Ollier W, Chiba-Falek O, Koltai DC, Need AC, Cirulli ET, Voineskos AN, Stefanis NC, Avramopoulos D, Hatzimanolis A, Smyrnis N, Bilder RM, Freimer NB, Cannon TD, London E, Poldrack RA, Sabb FW, Congdon E, Conley ED, Scult MA, Dickinson D, Straub RE, Donohoe G, Morris D, Corvin A, Gill M, Hariri AR, Weinberger DR, Pendleton N, Bitsios P, Rujescu D, Lahti J, Le Hellard S, Keller MC, Andreassen OA, Deary IJ, Glahn DC, Huang H, Liu C, Malhotra AK, Lencz T. Lam M, et al. Neuropsychopharmacology. 2021 Sep;46(10):1788-1801. doi: 10.1038/s41386-021-01023-4. Epub 2021 May 25. Neuropsychopharmacology. 2021. PMID: 34035472 Free PMC article.
  • Accelerated evolution of oligodendrocytes in the human brain.
    Berto S, Mendizabal I, Usui N, Toriumi K, Chatterjee P, Douglas C, Tamminga CA, Preuss TM, Yi SV, Konopka G. Berto S, et al. Proc Natl Acad Sci U S A. 2019 Nov 26;116(48):24334-24342. doi: 10.1073/pnas.1907982116. Epub 2019 Nov 11. Proc Natl Acad Sci U S A. 2019. PMID: 31712436 Free PMC article.
  • Dendritic Spines: Synaptogenesis and Synaptic Pruning for the Developmental Organization of Brain Circuits.
    Petanjek Z, Banovac I, Sedmak D, Hladnik A. Petanjek Z, et al. Adv Neurobiol. 2023;34:143-221. doi: 10.1007/978-3-031-36159-3_4. Adv Neurobiol. 2023. PMID: 37962796
  • A strategy for designing allosteric modulators of transcription factor dimerization.
    Oasa S, Vukojević V, Rigler R, Tsigelny IF, Changeux JP, Terenius L. Oasa S, et al. Proc Natl Acad Sci U S A. 2020 Feb 4;117(5):2683-2686. doi: 10.1073/pnas.1915531117. Epub 2020 Jan 17. Proc Natl Acad Sci U S A. 2020. PMID: 31953259 Free PMC article.

References

    1. Allen NC, et al. 2008. Systematic meta-analyses and field synopsis of genetic association studies in schizophrenia: the SzGene database. Nat Genet. 40(7):827–834. - PubMed
    1. Anders S, Huber W.. 2012. Differential expression of RNA-Seq data at the gene level–the DESeq package. Heidelberg (Germany): European Molecular Biology Laboratory (EMBL).
    1. Babbitt CC, et al. 2010. Both noncoding and protein-coding RNAs contribute to gene expression evolution in the primate brain. Genome Biol Evol. 2:67–79. - PMC - PubMed
    1. Bailey TL, et al. 2009. MEME SUITE: tools for motif discovery and searching. Nucleic Acids Res. 37(Web Server issue):W202–W208. - PMC - PubMed
    1. Ballester B, et al. 2014. Multi-species, multi-transcription factor binding highlights conserved control of tissue-specific biological pathways. eLife 3:e02626.. - PMC - PubMed

Publication types

Substances