Analysis of nanobody paratopes reveals greater diversity than classical antibodies
- PMID: 30053276
- PMCID: PMC6277174
- DOI: 10.1093/protein/gzy017
Analysis of nanobody paratopes reveals greater diversity than classical antibodies
Abstract
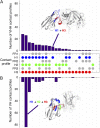
Nanobodies (Nbs) are a class of antigen-binding protein derived from camelid immune systems, which achieve equivalent binding affinities and specificities to classical antibodies (Abs) despite being comprised of only a single variable domain. Here, we use a data set of 156 unique Nb:antigen complex structures to characterize Nb-antigen binding and draw comparison to a set of 156 unique Ab:antigen structures. We analyse residue composition and interactions at the antigen interface, together with structural features of the paratopes of both data sets. Our analysis finds that the set of Nb structures displays much greater paratope diversity, in terms of the structural segments involved in the paratope, the residues used at these positions to contact the antigen and furthermore the type of contacts made with the antigen. Our findings suggest a different relationship between contact propensity and sequence variability from that observed for Ab VH domains. The distinction between sequence positions that control interaction specificity and those that form the domain scaffold is much less clear-cut for Nbs, and furthermore H3 loop positions play a much more dominant role in determining interaction specificity.
Figures


Similar articles
-
Comparative analysis of nanobody sequence and structure data.Proteins. 2018 Jul;86(7):697-706. doi: 10.1002/prot.25497. Epub 2018 Apr 15. Proteins. 2018. PMID: 29569425 Free PMC article.
-
General strategy to humanize a camelid single-domain antibody and identification of a universal humanized nanobody scaffold.J Biol Chem. 2009 Jan 30;284(5):3273-3284. doi: 10.1074/jbc.M806889200. Epub 2008 Nov 14. J Biol Chem. 2009. PMID: 19010777
-
Antigen recognition by single-domain antibodies: structural latitudes and constraints.MAbs. 2018 Aug/Sep;10(6):815-826. doi: 10.1080/19420862.2018.1489633. Epub 2018 Aug 15. MAbs. 2018. PMID: 29916758 Free PMC article. Review.
-
Structural Basis of Epitope Recognition by Heavy-Chain Camelid Antibodies.J Mol Biol. 2018 Oct 19;430(21):4369-4386. doi: 10.1016/j.jmb.2018.09.002. Epub 2018 Sep 8. J Mol Biol. 2018. PMID: 30205092
-
Structure, function and properties of antibody binding sites.J Mol Biol. 1991 Jan 5;217(1):133-51. doi: 10.1016/0022-2836(91)90617-f. J Mol Biol. 1991. PMID: 1988675 Review.
Cited by
-
Broad Reactivity Single Domain Antibodies against Influenza Virus and Their Applications to Vaccine Potency Testing and Immunotherapy.Biomolecules. 2021 Mar 10;11(3):407. doi: 10.3390/biom11030407. Biomolecules. 2021. PMID: 33802072 Free PMC article. Review.
-
Mapping paratopes of nanobodies using native mass spectrometry and ultraviolet photodissociation.Chem Sci. 2022 May 16;13(22):6610-6618. doi: 10.1039/d2sc01536f. eCollection 2022 Jun 7. Chem Sci. 2022. PMID: 35756525 Free PMC article.
-
Discrete analysis of camelid variable domains: sequences, structures, and in-silico structure prediction.PeerJ. 2020 Mar 6;8:e8408. doi: 10.7717/peerj.8408. eCollection 2020. PeerJ. 2020. PMID: 32185102 Free PMC article.
-
Bypassing the Need for Cell Permeabilization: Nanobody CDR3 Peptide Improves Binding on Living Bacteria.Bioconjug Chem. 2023 Jul 19;34(7):1234-1243. doi: 10.1021/acs.bioconjchem.3c00116. Epub 2023 Jul 7. Bioconjug Chem. 2023. PMID: 37418494 Free PMC article.
-
Structural Modeling of Nanobodies: A Benchmark of State-of-the-Art Artificial Intelligence Programs.Molecules. 2023 May 9;28(10):3991. doi: 10.3390/molecules28103991. Molecules. 2023. PMID: 37241731 Free PMC article.
References
Publication types
MeSH terms
Substances
LinkOut - more resources
Full Text Sources
Other Literature Sources
Research Materials
Miscellaneous

