Error-Discovery Learning Boosts Student Engagement and Performance, while Reducing Student Attrition in a Bioinformatics Course
- PMID: 30040529
- PMCID: PMC6234822
- DOI: 10.1187/cbe.17-04-0061
Error-Discovery Learning Boosts Student Engagement and Performance, while Reducing Student Attrition in a Bioinformatics Course
Abstract
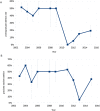
We sought to test a hypothesis that systemic blind spots in active learning are a barrier both for instructors-who cannot see what every student is actually thinking on each concept in each class-and for students-who often cannot tell precisely whether their thinking is right or wrong, let alone exactly how to fix it. We tested a strategy for eliminating these blind spots by having students answer open-ended, conceptual problems using a Web-based platform, and measured the effects on student attrition, engagement, and performance. In 4 years of testing both in class and using an online platform, this approach revealed (and provided specific resolution lessons for) more than 200 distinct conceptual errors, dramatically increased average student engagement, and reduced student attrition by approximately fourfold compared with the original lecture course format (down from 48.3% to 11.4%), especially for women undergraduates (down from 73.1% to 7.4%). Median exam scores increased from 53% to 72-80%, and the bottom half of students boosted their scores to the range in which the top half had scored before the pedagogical switch. By contrast, in our control year with the same active-learning content (but without this "zero blind spots" approach), these gains were not observed.
Figures


Similar articles
-
The flipped classroom stimulates greater learning and is a modern 21st century approach to teaching today's undergraduates.J Anim Sci. 2015 Jul;93(7):3722-31. doi: 10.2527/jas.2015-9087. J Anim Sci. 2015. PMID: 26440038
-
The use of an active learning approach in a SCALE-UP learning space improves academic performance in undergraduate General Biology.PLoS One. 2018 May 24;13(5):e0197916. doi: 10.1371/journal.pone.0197916. eCollection 2018. PLoS One. 2018. PMID: 29795683 Free PMC article.
-
Development of a self-report instrument for measuring in-class student engagement reveals that pretending to engage is a significant unrecognized problem.PLoS One. 2018 Oct 17;13(10):e0205828. doi: 10.1371/journal.pone.0205828. eCollection 2018. PLoS One. 2018. PMID: 30332460 Free PMC article.
-
Implementation of a Learning Assistant Program Improves Student Performance on Higher-Order Assessments.CBE Life Sci Educ. 2017 Winter;16(4):ar62. doi: 10.1187/cbe.16-12-0341. CBE Life Sci Educ. 2017. PMID: 29167224 Free PMC article.
-
Evaluating the effectiveness of a practical inquiry-based learning bioinformatics module on undergraduate student engagement and applied skills.Biochem Mol Biol Educ. 2016 May 6;44(3):304-13. doi: 10.1002/bmb.20954. Biochem Mol Biol Educ. 2016. PMID: 27161812 Clinical Trial.
Cited by
-
Reimagining the Introductory Math Curriculum for Life Sciences Students.CBE Life Sci Educ. 2021 Dec;20(4):ar62. doi: 10.1187/cbe.20-11-0252. CBE Life Sci Educ. 2021. PMID: 34846919 Free PMC article.
-
Demystifying the Meaning of Active Learning in Postsecondary Biology Education.CBE Life Sci Educ. 2020 Dec;19(4):ar52. doi: 10.1187/cbe.20-04-0068. CBE Life Sci Educ. 2020. PMID: 33001767 Free PMC article.
-
Design-Based Research: A Methodology to Extend and Enrich Biology Education Research.CBE Life Sci Educ. 2020 Sep;19(3):es11. doi: 10.1187/cbe.19-11-0245. CBE Life Sci Educ. 2020. PMID: 32870086 Free PMC article.
References
-
- Adams W. K., Wieman C. E. (2011). Development and validation of instruments to measure learning of expert-like thinking. International Journal of Science Education, (9), 1289–1312.
-
- Ambrose S. A., Bridges M. W., DiPietro M., Lovett M. C., Norman M. K. (2010). How learning works: Seven research-based principles for smart teaching. San Francisco, CA: Wiley.
-
- Anderson L. W., Krathwohl D. R., Airasian P. W., Cruikshank K. A., Mayer R. E., Pintrich P. R., Wittrock M. C. (2001). A taxonomy for learning, teaching, and assessing: A revision of Bloom’s taxonomy of educational objectives (abridged ed.). New York: Addison Wesley Longman.
Publication types
MeSH terms
Grants and funding
LinkOut - more resources
Full Text Sources
Other Literature Sources

