Antibiotic-induced microbiome depletion alters metabolic homeostasis by affecting gut signaling and colonic metabolism
- PMID: 30030441
- PMCID: PMC6054678
- DOI: 10.1038/s41467-018-05336-9
Antibiotic-induced microbiome depletion alters metabolic homeostasis by affecting gut signaling and colonic metabolism
Abstract
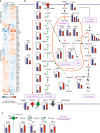
Antibiotic-induced microbiome depletion (AIMD) has been used frequently to study the role of the gut microbiome in pathological conditions. However, unlike germ-free mice, the effects of AIMD on host metabolism remain incompletely understood. Here we show the effects of AIMD to elucidate its effects on gut homeostasis, luminal signaling, and metabolism. We demonstrate that AIMD, which decreases luminal Firmicutes and Bacteroidetes species, decreases baseline serum glucose levels, reduces glucose surge in a tolerance test, and improves insulin sensitivity without altering adiposity. These changes occur in the setting of decreased luminal short-chain fatty acids (SCFAs), especially butyrate, and the secondary bile acid pool, which affects whole-body bile acid metabolism. In mice, AIMD alters cecal gene expression and gut glucagon-like peptide 1 signaling. Extensive tissue remodeling and decreased availability of SCFAs shift colonocyte metabolism toward glucose utilization. We suggest that AIMD alters glucose homeostasis by potentially shifting colonocyte energy utilization from SCFAs to glucose.
Conflict of interest statement
The authors declare no competing interests.
Figures


Similar articles
-
Antibiotic-induced microbiome depletion alters renal glucose metabolism and exacerbates renal injury after ischemia-reperfusion injury in mice.Am J Physiol Renal Physiol. 2021 Oct 1;321(4):F455-F465. doi: 10.1152/ajprenal.00111.2021. Epub 2021 Aug 23. Am J Physiol Renal Physiol. 2021. PMID: 34423680
-
Alteration of gut microbiota by vancomycin and bacitracin improves insulin resistance via glucagon-like peptide 1 in diet-induced obesity.FASEB J. 2015 Jun;29(6):2397-411. doi: 10.1096/fj.14-265983. Epub 2015 Feb 20. FASEB J. 2015. PMID: 25713030
-
Oral hydroxysafflor yellow A reduces obesity in mice by modulating the gut microbiota and serum metabolism.Pharmacol Res. 2018 Aug;134:40-50. doi: 10.1016/j.phrs.2018.05.012. Epub 2018 May 19. Pharmacol Res. 2018. PMID: 29787870
-
The Short-Chain Fatty Acid Acetate in Body Weight Control and Insulin Sensitivity.Nutrients. 2019 Aug 18;11(8):1943. doi: 10.3390/nu11081943. Nutrients. 2019. PMID: 31426593 Free PMC article. Review.
-
Secondary Bile Acids and Short Chain Fatty Acids in the Colon: A Focus on Colonic Microbiome, Cell Proliferation, Inflammation, and Cancer.Int J Mol Sci. 2019 Mar 11;20(5):1214. doi: 10.3390/ijms20051214. Int J Mol Sci. 2019. PMID: 30862015 Free PMC article. Review.
Cited by
-
Depletion of gut microbiota induces skeletal muscle atrophy by FXR-FGF15/19 signalling.Ann Med. 2021 Dec;53(1):508-522. doi: 10.1080/07853890.2021.1900593. Ann Med. 2021. PMID: 33783283 Free PMC article.
-
Long-Term Exposure to Polystyrene Microspheres and High-Fat Diet-Induced Obesity in Mice: Evaluating a Role for Microbiota Dysbiosis.Environ Health Perspect. 2024 Sep;132(9):97002. doi: 10.1289/EHP13913. Epub 2024 Sep 3. Environ Health Perspect. 2024. PMID: 39226184 Free PMC article.
-
Protein O-GlcNAc Modification Links Dietary and Gut Microbial Cues to the Differentiation of Enteroendocrine L Cells.Cell Rep. 2020 Aug 11;32(6):108013. doi: 10.1016/j.celrep.2020.108013. Cell Rep. 2020. PMID: 32783937 Free PMC article.
-
Systemic antibiotics adjuvants to scaling and root planing in type 2 diabetic and periodontitis individuals: Systematic review with network meta-analysis.Jpn Dent Sci Rev. 2023 Dec;59:167-178. doi: 10.1016/j.jdsr.2023.06.001. Epub 2023 Jun 18. Jpn Dent Sci Rev. 2023. PMID: 38152384 Free PMC article. Review.
-
Microbiota-gut-brain axis and its therapeutic applications in neurodegenerative diseases.Signal Transduct Target Ther. 2024 Feb 16;9(1):37. doi: 10.1038/s41392-024-01743-1. Signal Transduct Target Ther. 2024. PMID: 38360862 Free PMC article. Review.
References
Publication types
MeSH terms
Substances
Grants and funding
- R01 DK115214/DK/NIDDK NIH HHS/United States
- KL2 TR000099/TR/NCATS NIH HHS/United States
- R24 DK080506/DK/NIDDK NIH HHS/United States
- UL1 TR001442/TR/NCATS NIH HHS/United States
- TL1 TR001443/TR/NCATS NIH HHS/United States
- T32 DK007202/DK/NIDDK NIH HHS/United States
- R01 DK091618/DK/NIDDK NIH HHS/United States
- R03 DK114536/DK/NIDDK NIH HHS/United States
- P30 EY019005/EY/NEI NIH HHS/United States
- P50 GM085764/GM/NIGMS NIH HHS/United States
- U24 DK097153/DK/NIDDK NIH HHS/United States
- K08 DK102902/DK/NIDDK NIH HHS/United States
- P30 CA014195/CA/NCI NIH HHS/United States
LinkOut - more resources
Full Text Sources
Other Literature Sources
Medical
Molecular Biology Databases

