. 2018 Nov;21(4):883-900.
doi: 10.1007/s10456-018-9634-5. Epub 2018 Jul 16.

PDGF-BB regulates splitting angiogenesis in skeletal muscle by limiting VEGF-induced endothelial proliferation

Affiliations

PDGF-BB regulates splitting angiogenesis in skeletal muscle by limiting VEGF-induced endothelial proliferation

R Gianni-Barrera et al. Angiogenesis. 2018 Nov.

Abstract

VEGF induces normal or aberrant angiogenesis depending on its dose in the microenvironment around each producing cell in vivo. This transition depends on the balance between VEGF-induced endothelial stimulation and PDGF-BB-mediated pericyte recruitment, and co-expression of PDGF-BB normalizes aberrant angiogenesis despite high VEGF doses. We recently found that VEGF over-expression induces angiogenesis in skeletal muscle through an initial circumferential vascular enlargement followed by longitudinal splitting, rather than sprouting. Here we investigated the cellular mechanism by which PDGF-BB co-expression normalizes VEGF-induced aberrant angiogenesis. Monoclonal populations of transduced myoblasts, expressing similarly high levels of VEGF alone or with PDGF-BB, were implanted in mouse skeletal muscles. PDGF-BB co-expression did not promote sprouting and angiogenesis that occurred through vascular enlargement and splitting. However, enlargements were significantly smaller in diameter, due to a significant reduction in endothelial proliferation, and retained pericytes, which were otherwise lost with high VEGF alone. A time-course of histological analyses and repetitive intravital imaging showed that PDGF-BB co-expression anticipated the initiation of vascular enlargement and markedly accelerated the splitting process. Interestingly, quantification during in vivo imaging suggested that a global reduction in shear stress favored the initiation of transluminal pillar formation during VEGF-induced splitting angiogenesis. Quantification of target gene expression showed that VEGF-R2 signaling output was significantly reduced by PDGF-BB co-expression compared to VEGF alone. In conclusion, PDGF-BB co-expression prevents VEGF-induced aberrant angiogenesis by modulating VEGF-R2 signaling and endothelial proliferation, thereby limiting the degree of circumferential enlargement and enabling efficient completion of vascular splitting into normal capillary networks despite high VEGF doses.

Keywords: Intussusception; PDGF-BB; Pericytes; Shear stress; VEGF; Vascular splitting.


Conflict of interest statement

Conflict of interest

The authors declare that they have no conflict of interest.

Ethical standards

All procedures performed in studies involving animals were in accordance with the ethical standards of the Institutions at which the studies were conducted and were approved by the local Swiss and German Animal Welfare Committees.

Figures

Fig. 1
Fig. 1
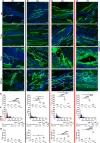
PDGF-BB co-expression anticipates vascular enlargement formation and accelerates vascular splitting: clonal populations of transduced myoblasts expressing high levels of VEGF alone (Vhigh myoblast) or co-expressed together with PGF-BB (VIPhigh myoblast) and control myoblasts (ctrl) were implanted in TA and GC muscles of SCID mice. a–h Vascular corrosion casts of the entire legs were performed at 2, 3, 4, and 7 days post-implantation. The time point labels (2, 3, 4, and 7 days) refer to all images in each column delimited by the red vertical lines. The white rectangles in panels b-Vhigh, c-Vhigh, a-VIPhigh, and b-VIPhigh are shown at higher magnification in e–h. White arrowheads: small indentations and holes indicative of transluminal tissue pillar formation. Dash rectangle in h vascular splitting after transluminal pillar fusion. Asterisks in d-Vhigh angioma-like structures devoid of further signs of pillar formation. n = 3 independent samples per group, per time point. ad Scale bars = 100 µm, eh Scale bars = 25 µm. i Quantification of the relative numerical pillar density (number of pillars per vessel area) at equivalent biological stages; data points represent the means of individual measurements in each sample, while bars show the overall mean ± SEM. n = 3 independent samples per group, per time point
Fig. 2
Fig. 2
Absence of abluminal endothelial sprouting. Immunostaining with antibodies against endomucin (endothelial cells, green), laminin (basal lamina, red), and with DAPI (nuclei, blue) was performed on cryosections of TA and GC muscles 2 (ac) and 3 days (df) after implantation with VIPhigh myoblast clone. Enlarged vessels displayed no evidence of abluminal endothelial cell processes sprouting outside the basal lamina, but rather appeared pierced by numerous transluminal holes (white arrows in high-magnification panels in a and d) and displayed intraluminal vascular ridges (white arrowheads in high-magnification panel in d). *Vascular lumen. n = 2 muscles per time point; scale bars = 20 µm in all panels
Fig. 3
Fig. 3
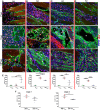
PDGF-BB co-expression limits the degree of vascular enlargement and induces robust normal angiogenesis. The time point labels (2, 3, 4, and 7 days) refer to all images and graphs in each column delimited by the red vertical lines. a–d Cryosections of TA and GC muscles implanted with Vhigh, VIPhigh, Phigh, and control myoblasts were immunostained for CD31 (endothelial cells, green) and DAPI (nuclei, blue). bc *Lumen of vascular enlargement and d of aberrant structure. e Values represent means (in µm) of individual measurements in each sample ± SEM quantified in areas of myoblast implantation at day 2, 3, 4, and 7 post-implantation. *p < 0.05, **p < 0.01, ****p < 0.0001 by 1-way ANOVA. f Distribution of vessel diameters (in µm). g The amount of angiogenesis was quantified in the same areas: VLD vessel length density, expressed as millimeters of vessel length per square millimeter of area of effect (mm/mm2). Data represent mean values ± SEM. *p < 0.05, **p < 0.01, ***p < 0.001, ****p < 0.0001 by 1-way ANOVA. n = 3–5 independent muscles per each group; per time point. Scale bars = 20 µm in all panels
Fig. 4
Fig. 4
PDGF-BB co-expression limits endothelial proliferation. ad Immunostaining with antibodies against CD31 (endothelial cells, green), Ki-67 (nuclei of proliferating cells, red), and with DAPI (nuclei, blue) was performed on cryosections of limb muscles injected with Vhigh, VIPhigh, and Phigh myoblast clones at day 2, 3, 4, and 7 after myoblast implantation. The time point labels (2, 3, 4, and 7 days) refer to all images and graphs in each column delimited by the red vertical lines. ac *Lumen of vascular enlargements and d of aberrant angioma-like structure. ef Quantification of KI67 marker in areas of effect showed that PDGFB co-expression reduced the total amount of proliferating endothelial cells compared to VEGF alone. Values represent means of individual measurements in each sample ± SEM. *p < 0.05, **p < 0.01, ***p < 0.001, ****p < 0.0001 by 1-way ANOVA. n = 3–5 independent muscles per each group, per time point. Scale bars = 20 µm in all panels
Fig. 5
Fig. 5
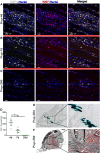
PDGF-BB over-expression does not cause fibrosis. ac Immunostaining with antibodies against FSP1 (fibroblasts, white), Ki-67 (nuclei of proliferating cells, red), and with DAPI (nuclei, blue) was performed on cryosections of limb muscles injected with Phigh myoblasts at day 4, 7, and 28 days after myoblast implantation. Scale bars = 20 µm. d Quantification of the number of Ki-67 + fibroblast/field of view in areas of effect showed no sustained fibroblast proliferation by 4 weeks. Values represent means ± SEM. *p < 0.05, **p < 0.01 by 1-way ANOVA. ef X-Gal staining (e) and Masson trichrome staining (f) showed persistent engraftment of LacZ-expressing myoblasts and the absence of fibrosis, respectively, after 28 days. The panels on the right in e and f represent high-magnification views of the areas marked by black boxes in the left panels. Scale bars = 500 µm in low-magnification panels (left) and 100 µm in high-magnification panels (right). n = 4 muscles per time point
Fig. 6
Fig. 6
Mural cell coverage. ad Vessels induced by implantation of VHigh and VIPHigh myoblast clones were immunostained with antibodies against CD31 (endothelial cells, red), NG2 (pericytes, green), α-SMA (smooth muscle cells, cyan), and with DAPI (nuclei, blue) in cryosections of TA and GC muscles. a and c *Lumen of vascular enlargements. e The maturation index was quantified in areas implanted with each cell population at stage 1 and 2 of VEGF-induced vascular enlargements. Co-expression of PDGF-BB caused a marked increase in mural cell coverage at both time points compared to high VEGF alone. Data represent mean values ± SEM; *p < 0.05 by Kruskal–Wallis test. n = 3–6 independent muscles per each group; per time point. Scale bars = 20 µm in all panels
Fig. 7
Fig. 7
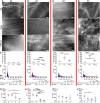
Microhemodynamics and vascular splitting. VHigh, VIPHigh, and control myoblasts were implanted into the panniculus carnosus muscle of SCID mice in a dorsal skinfold chamber. The time point labels (0, 2, 3, and 4 days) refer to all images and graphs in each column delimited by the red vertical lines. ad Intravital fluorescence microscopic images of capillaries in areas of myoblast implantation. e Values represent means (in µm) of individual measurements in each sample ± SEM quantified in areas of myoblast implantation at day 0, 2, 3, and 4 post cell implantation. *p < 0.05, **p < 0.01, ***p < 0.001 ****p < 0.0001 by 1-way ANOVA. f The distribution of vessel diameters (in µm) was quantified in areas of myoblast implantation. gj Blood flow velocity (BV, in µm/s) and wall shear rate (γ, in s−1) were quantified off-line concomitantly with onset of vascular enlargements. Data represent mean values ± SEM; *p < 0.05, *p < 0.05, ***p < 0.001, ****p < 0.0001 by 1-way ANOVA or by Kruskal–Wallis test. n = 2–6 independent muscles per each group; per time point. Scale bars = 100 µm in all panels
Fig. 8
Fig. 8
PDGF-BB co-expression reduces the activation of the VEGF signaling pathway. ac Cryosections of TA and GC muscles implanted with VIPhigh were immunostained for CD31 (endothelial cells, green) and DAPI (nuclei, blue). a 1 day after cell implantation the pre-existing vessels were not yet affected. b Values represent diameter mean (in µm) of individual measurements in each sample ± SEM quantified in areas of myoblast implantation. c Distribution of vessel diameters (in µm). n = 2 muscles. Scale bar = 20 µm. d Total VEGF protein content of muscle extracts was measured by ELISA (pg/mg of total protein). Data represent mean values ± SEM; *p < 0.05, **p < 0.01, ****p < 0.0001 by 1-way ANOVA. n = 5 independent muscles per group, per time point. eg In vivo expression of Esm1, Igfbp3, and Itgb3 genes, which are specifically induced by activation of VEGF-R2 signaling, was quantified in calf muscles at day 1, 2, and 3 after injections of control, Vhigh, and VIPhigh myoblasts. PDGF-BB co-expression significantly reduced the signaling output downstream of VEGF-R2, despite similar or even higher levels of VEGF protein in the tissues. *p < 0.05, **p < 0.01, ***p < 0.001, ****p < 0.0001 by 1-way ANOVA. n = 4–6 independent muscles per group, per time point

Similar articles

Cited by

References

    1. Benjamin EJ, Virani SS, Callaway CW, Chang AR, Cheng S, Chiuve SE, Cushman M, Delling FN, Deo R, de Ferranti SD, Ferguson JF, Fornage M, Gillespie C, Isasi CR, Jimenez MC, Jordan LC, Judd SE, Lackland D, Lichtman JH, Lisabeth L, Liu S, Longenecker CT, Lutsey PL, Matchar DB, Matsushita K, Mussolino ME, Nasir K, O’Flaherty M, Palaniappan LP, Pandey DK, Reeves MJ, Ritchey MD, Rodriguez CJ, Roth GA, Rosamond WD, Sampson UKA, Satou GM, Shah SH, Spartano NL, Tirschwell DL, Tsao CW, Voeks JH, Willey JZ, Wilkins JT, Wu JH, Alger HM, Wong SS, Muntner P. Heart disease and stroke statistics-2018 update: a report from the American Heart Association. Circulation. 2018 doi: 10.1161/CIR.0000000000000558. - DOI - PubMed
    1. Potente M, Gerhardt H, Carmeliet P. Basic and therapeutic aspects of angiogenesis. Cell. 2011;146(6):873–887. doi: 10.1016/j.cell.2011.08.039. - DOI - PubMed
    1. Annex BH. Therapeutic angiogenesis for critical limb ischaemia. Nat Rev Cardiol. 2013;10(7):387–396. doi: 10.1038/nrcardio.2013.70. - DOI - PubMed
    1. Yla-Herttuala S, Bridges C, Katz MG, Korpisalo P. Angiogenic gene therapy in cardiovascular diseases: dream or vision? Eur Heart J. 2017;38(18):1365–1371. doi: 10.1093/eurheartj/ehw547. - DOI - PMC - PubMed
    1. Gianni-Barrera R, Bartolomeo M, Vollmar B, Djonov V, Banfi A. Split for the cure: VEGF, PDGF-BB and intussusception in therapeutic angiogenesis. Biochem Soc Trans. 2014;42(6):1637–1642. doi: 10.1042/BST20140234. - DOI - PubMed

Publication types

MeSH terms

Substances

LinkOut - more resources