

In Vitro Exposure to Prostratin but Not Bryostatin-1 Improves Natural Killer Cell Functions Including Killing of CD4+ T Cells Harboring Reactivated Human Immunodeficiency Virus
- PMID: 30008723
- PMCID: PMC6033996
- DOI: 10.3389/fimmu.2018.01514
In Vitro Exposure to Prostratin but Not Bryostatin-1 Improves Natural Killer Cell Functions Including Killing of CD4+ T Cells Harboring Reactivated Human Immunodeficiency Virus
Abstract
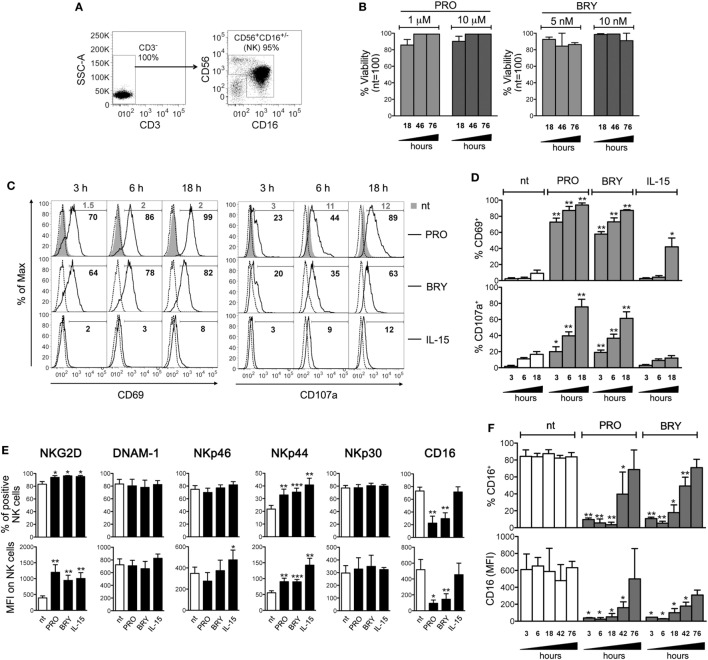
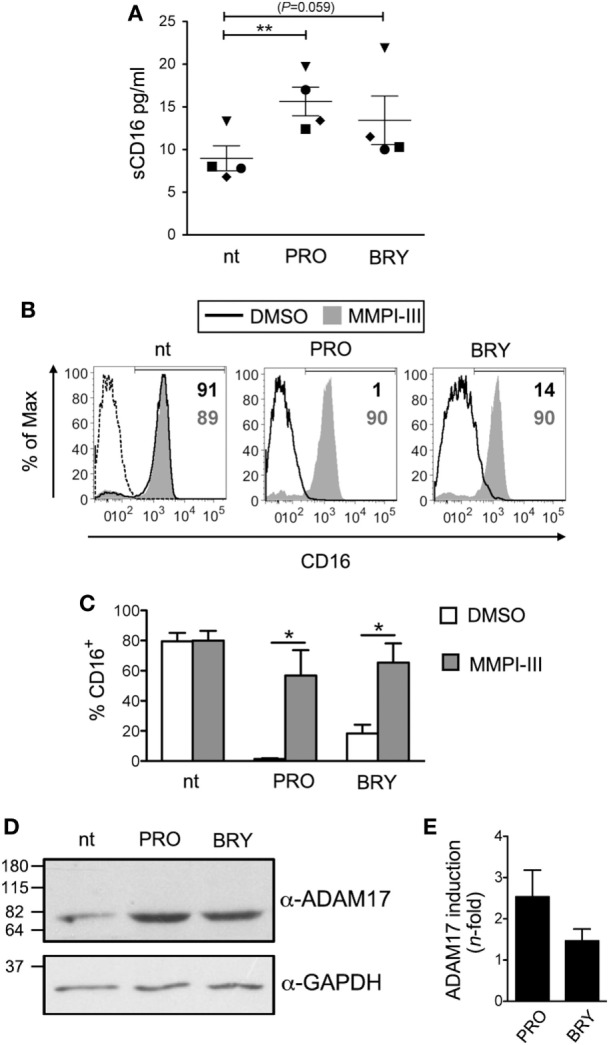
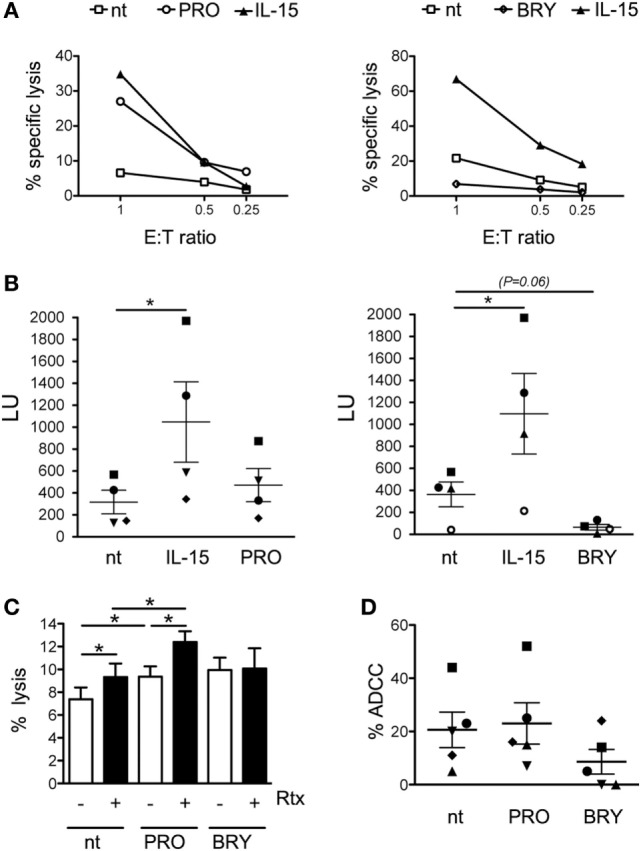
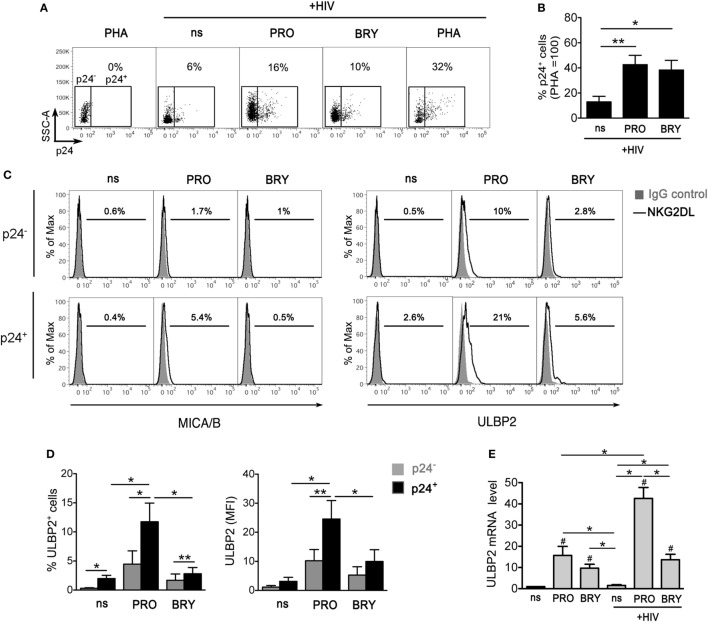
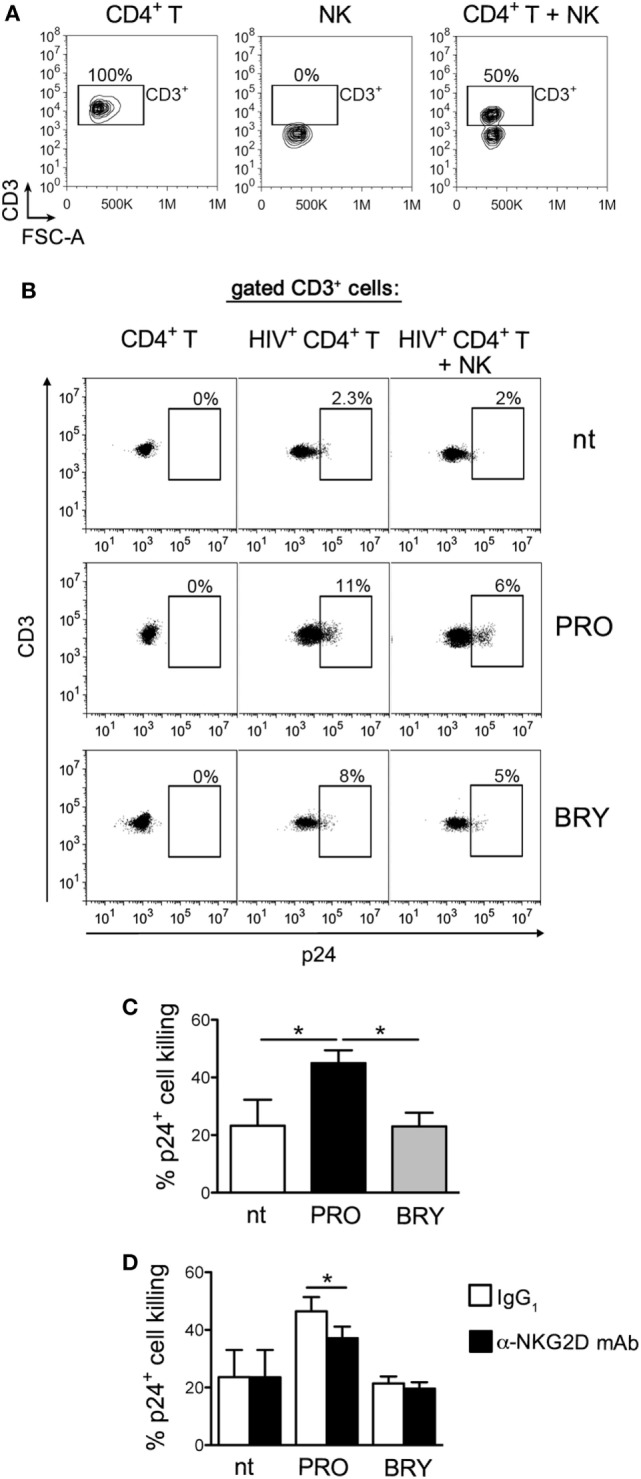
In the attempt of purging the HIV-1 reservoir through the "shock-and-kill" strategy, it is important to select latency-reversing agents (LRAs) devoid of deleterious effects on the antiviral function of immune effector cells. Here, we investigated two LRAs with PKC agonist activity, prostratin (PRO) and bryostatin-1 (BRY), for their impact on the function of natural killer (NK) cells, the major effectors of innate immunity whose potential in HIV-1 eradication has emerged in recent clinical trials. Using NK cells of healthy donors, we found that exposure to either PRO or BRY potently activated NK cells, resulting in upmodulation of NKG2D and NKp44 activating receptors and matrix metalloprotease-mediated shedding of CD16 receptor. Despite PRO and BRY affected NK cell phenotype in the same manner, their impact on NK cell function was diverse and showed considerable donor-to-donor variation. Altogether, in most tested donors, the natural cytotoxicity and antibody-dependent cellular cytotoxicity (ADCC) of NK cells were either improved or maintained by PRO, while both activities were impaired by BRY. Moreover, we analyzed the effect of these drugs on the capacity of treated NK cells to kill autologous latently infected CD4+ T cells reactivated via the same treatment. First, we found that PRO but not BRY increased upmodulation of the ULBP2 ligand for NKG2D on reactivated p24+ cells. Importantly, we showed that clearance of reactivated p24+ cells by NK cells was enhanced when both targets and effectors were exposed to PRO but not to BRY. Overall, PRO had a superior potential compared with BRY as to the impact on key NK cell functions and on NK-cell-mediated clearance of the HIV-1 reservoir. Our results emphasize the importance of considering the effects on NK cells of candidate "shock-and-kill" interventions. With respect to combinative approaches, the impact on NK cells of each LRA should be re-evaluated upon combination with a second LRA, which may have analogous or opposite effects, or with immunotherapy targeting NK cells. In addition, avoiding co-administration of LRAs that negatively impact ADCC activity by NK cells might be essential for successful application of antibodies or vaccination to "shock-and-kill" strategies.
Keywords: HIV; NKG2D; antibody-dependent cellular cytotoxicity; bryostatin-1; latency-reversing agents; natural killer cell function; prostratin; protein kinase C agonists.
Figures
Similar articles
-
Combinations of Histone Deacetylase Inhibitors with Distinct Latency Reversing Agents Variably Affect HIV Reactivation and Susceptibility to NK Cell-Mediated Killing of T Cells That Exit Viral Latency.Int J Mol Sci. 2021 Jun 22;22(13):6654. doi: 10.3390/ijms22136654. Int J Mol Sci. 2021. PMID: 34206330 Free PMC article.
-
Potential of the NKG2D/NKG2DL Axis in NK Cell-Mediated Clearance of the HIV-1 Reservoir.Int J Mol Sci. 2019 Sep 11;20(18):4490. doi: 10.3390/ijms20184490. Int J Mol Sci. 2019. PMID: 31514330 Free PMC article. Review.
-
The histone deacetylase inhibitor SAHA simultaneously reactivates HIV-1 from latency and up-regulates NKG2D ligands sensitizing for natural killer cell cytotoxicity.Virology. 2017 Oct;510:9-21. doi: 10.1016/j.virol.2017.06.033. Epub 2017 Jul 6. Virology. 2017. PMID: 28689087
-
Interleukin-15-Stimulated Natural Killer Cells Clear HIV-1-Infected Cells following Latency Reversal Ex Vivo.J Virol. 2018 May 29;92(12):e00235-18. doi: 10.1128/JVI.00235-18. Print 2018 Jun 15. J Virol. 2018. PMID: 29593039 Free PMC article.
-
Natural Killer (NK) Cell Education Differentially Influences HIV Antibody-Dependent NK Cell Activation and Antibody-Dependent Cellular Cytotoxicity.Front Immunol. 2017 Aug 24;8:1033. doi: 10.3389/fimmu.2017.01033. eCollection 2017. Front Immunol. 2017. PMID: 28883824 Free PMC article. Review.
Cited by
-
Engineering CAR T Cells to Target the HIV Reservoir.Front Cell Infect Microbiol. 2020 Aug 13;10:410. doi: 10.3389/fcimb.2020.00410. eCollection 2020. Front Cell Infect Microbiol. 2020. PMID: 32903563 Free PMC article. Review.
-
Hexamethylene bisacetamide impairs NK cell-mediated clearance of acute T lymphoblastic leukemia cells and HIV-1-infected T cells that exit viral latency.Sci Rep. 2019 Mar 13;9(1):4373. doi: 10.1038/s41598-019-40760-x. Sci Rep. 2019. PMID: 30867508 Free PMC article.
-
Defining the Effects of PKC Modulator HIV Latency-Reversing Agents on Natural Killer Cells.Pathog Immun. 2024 Apr 24;9(1):108-137. doi: 10.20411/pai.v9i1.673. eCollection 2024. Pathog Immun. 2024. PMID: 38765786 Free PMC article.
-
Combinations of Histone Deacetylase Inhibitors with Distinct Latency Reversing Agents Variably Affect HIV Reactivation and Susceptibility to NK Cell-Mediated Killing of T Cells That Exit Viral Latency.Int J Mol Sci. 2021 Jun 22;22(13):6654. doi: 10.3390/ijms22136654. Int J Mol Sci. 2021. PMID: 34206330 Free PMC article.
-
Potential of the NKG2D/NKG2DL Axis in NK Cell-Mediated Clearance of the HIV-1 Reservoir.Int J Mol Sci. 2019 Sep 11;20(18):4490. doi: 10.3390/ijms20184490. Int J Mol Sci. 2019. PMID: 31514330 Free PMC article. Review.
References
LinkOut - more resources
Full Text Sources
Other Literature Sources
Research Materials