. 2018 Jun 27:9:1494.
doi: 10.3389/fimmu.2018.01494. eCollection 2018.

Interaction Between Macrophage Migration Inhibitory Factor and CD74 in Human Immunodeficiency Virus Type I Infected Primary Monocyte-Derived Macrophages Triggers the Production of Proinflammatory Mediators and Enhances Infection of Unactivated CD4+ T Cells

Affiliations

Interaction Between Macrophage Migration Inhibitory Factor and CD74 in Human Immunodeficiency Virus Type I Infected Primary Monocyte-Derived Macrophages Triggers the Production of Proinflammatory Mediators and Enhances Infection of Unactivated CD4+ T Cells

César Trifone et al. Front Immunol. .

Abstract

Understanding the mechanisms of human immunodeficiency virus type I (HIV-1) pathogenesis would facilitate the identification of new therapeutic targets to control the infection in face of current antiretroviral therapy limitations. CD74 membrane expression is upregulated in HIV-1-infected cells and the magnitude of its modulation correlates with immune hyperactivation in HIV-infected individuals. In addition, plasma level of the CD74 activating ligand macrophage migration inhibitory factor (MIF) is increased in infected subjects. However, the role played by MIF/CD74 interaction in HIV pathogenesis remains unexplored. Here, we studied the effect of MIF/CD74 interaction on primary HIV-infected monocyte-derived macrophages (MDMs) and its implications for HIV immunopathogenesis. Confocal immunofluorescence analysis of CD74 and CD44 (the MIF signal transduction co-receptor) expression indicated that both molecules colocalized at the plasma membrane specifically in wild-type HIV-infected MDMs. Treatment of infected MDMs with MIF resulted in an MIF-dependent increase in TLR4 expression. Similarly, there was a dose-dependent increase in the production of IL-6, IL-8, TNFα, IL-1β, and sICAM compared to the no-MIF condition, specifically from infected MDMs. Importantly, the effect observed on IL-6, IL-8, TNFα, and IL-1β was abrogated by impeding MIF interaction with CD74. Moreover, the use of a neutralizing αMIF antibody or an MIF antagonist reverted these effects, supporting the specificity of the results. Treatment of unactivated CD4+ T-cells with MIF-treated HIV-infected MDM-derived culture supernatants led to enhanced permissiveness to HIV-1 infection. This effect was lost when CD4+ T-cells were treated with supernatants derived from infected MDMs in which CD74/MIF interaction had been blocked. Moreover, the enhanced permissiveness of unactivated CD4+ T-cells was recapitulated by exogenous addition of IL-6, IL-8, IL-1β, and TNFα, or abrogated by neutralizing its biological activity using specific antibodies. Results obtained with BAL and NL4-3 HIV laboratory strains were reproduced using transmitted/founder primary isolates. This evidence indicated that MIF/CD74 interaction resulted in a higher production of proinflammatory cytokines from HIV-infected MDMs. This caused the generation of an inflammatory microenvironment which predisposed unactivated CD4+ T-cells to HIV-1 infection, which might contribute to viral spreading and reservoir seeding. Overall, these results support a novel role of the MIF/CD74 axis in HIV pathogenesis that deserves further investigation.

Keywords: CD4+ T-cells; CD74; human immunodeficiency virus; immunopathogenesis; macrophage migration inhibitory factor; primary monocyte-derived macrophages.


Figures

Figure 1
Figure 1
CD74 upregulation in human immunodeficiency virus (HIV)-infected monocyte-derived macrophages (MDMs) and macrophage migration inhibitory factor (MIF) plasma levels in HIV+ subjects. (A) Flow cytometry analysis of CD74 surface expression in primary uninfected MDMs (left panel); infected MDMs with a Nef-defective virus expressing the reporter molecule GFP (ΔNef HIV-1, middle panel); and infected with a wild type (WT) HIV-1 also expressing the reporter molecule GFP (WT HIV, right panel). The plots show CD74 versus GFP expression (HIV-1 infection) on MDMs [gated previously in a forward scatter (FSC) versus side scatter plot]. In each dot plot, two different populations were gated: the HIV-1 negative population (GFP negative) and the HIV-1 positive population (GFP positive). One representative healthy donor, out of three donors, is shown. (B) Quantitation of Nef-mediated upregulation of CD74, calculated as the ratio between FL-2 MFI obtained for cells infected with the WT virus and the FL-2 MFI obtained for cells infected with the ΔNef virus. Each black dot represents one out of three independent experiments (donors). Horizontal red bars stand for the mean value. (C) MIF concentration in plasma obtained from HIV-negative (HIV−, N = 13) and HIV-positive (HIV+, N = 13) donors. Each plasma was evaluated in duplicate. Dots represent the average of duplicates for each donor. Data were normally distributed and analyzed by two-tailed unpaired Student’s t-test. Horizontal lines within boxes represent the median and whiskers extend from min to max. ****p < 0.0001.
Figure 2
Figure 2
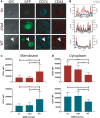
CD74 and CD44 expression in uninfected and infected monocyte-derived macrophages (MDMs). (A) Confocal immunofluorescence microscopy of primary uninfected MDMs (UN, upper panels); primary ΔNef human immunodeficiency virus (HIV)-infected MDMs (ΔNef, middle panels); and primary wild type (WT) HIV-infected MDMs (WT, lower panels). From left to right: bright field, GFP (HIV-1 infection), CD74 staining and CD44 staining are shown, in one representative cell for each condition. (B) Plots show cross-sectional mean fluorescence intensity (mFI) for CD74 (left axis, cyan line) and CD44 (right axis, red line) corresponding to the depicted cells (in the lower panel, cross-sectional mFI was evaluated in the cell pointed with an arrow). The black lines indicate the area comprising the cell according to the DIC. (C,D) Cross-sectional mFI quantification for CD44 (upper panel) and CD74 (lower panel) intensity at plasma membrane (C) and cytoplasm (D). Quantifications were performed in 15 individual cells for each condition. Bars represent mean ± SD. Data were analyzed by one-way ANOVA followed by Dunnett’s post-test. *p < 0.05, **p < 0.01, ***p < 0.001, ****p < 0.0001.
Figure 3
Figure 3
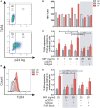
TLR4 expression after macrophage migration inhibitory factor (MIF) stimulation in primary human immunodeficiency virus (HIV)-infected monocyte-derived macrophages (MDMs). (A) TLR4 expression in uninfected (UN, upper panel), bystander (By, lower panel), and productively infected cells identified on the bases of intracellular p24 staining (In, lower panel). Living MDMs were gated previously on a forward scatter versus side scatter dot plot. An isotype-matched FITC-conjugated antibody was used to accurately set the p24-negative population. (B) TLR4 MFI in uninfected MDMs (Un), in productively infected MDMs (p24 positive population within the well inoculated with the virus, In) and in the bystander uninfected MDMs (p24-negative population within the well inoculated with the virus, By) after MIF treatment. These data represent the results obtained from one representative donor. (C) Ratio between the TLR4 MFI of the infected (or bystander population) and the TLR4 MFI of the uninfected cells after treatment with MIF, with or without CD74 blockade with an anti-CD74 antibody. Fold up from four independent donors, evaluated in duplicate are shown collectively. Data represent the mean ± SD. (D) Flow cytometry histogram overlay for TLR4 expression on Un, By, and In MDMs all treated with 25 ng/ml MIF (E) Ratio between the TLR4 MFI of the infected (or by-stander population) and the TLR4 MFI of the uninfected cells using the different CD74-blocking conditions represented in the x-axis. Data were analyzed by two-way ANOVA followed by Tukey’s post-test. *p < 0.05, **p < 0.01, ***p < 0.001, ****p < 0.0001.
Figure 4
Figure 4
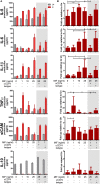
Expression of cytokines after macrophage migration inhibitory factor (MIF) stimulation in primary human immunodeficiency virus (HIV)-infected and uninfected monocyte-derived macrophages (MDMs). (A) Expression of IL-8, IL-6, IL-1β, TNF-α, sICAM, and IL-10 in supernatants from HIV-infected (In) and uninfected (Un) MDMs obtained from one representative healthy donor. (B) Data combined from six independent experiments (donors), each evaluated in triplicate. Here, data are shown as the ratio between cytokine concentrations found under the infection condition versus the uninfected counterpart. Cells were stimulated with MIF as follows: 0, 1, 10, or 25 ng/ml. Data shown in the gray boxes depict CD74 blocking (10 ng/ml of αCD74 or the corresponding isotype control) followed by MIF stimulation (1 or 25 ng/ml as denoted). Data represent the mean ± SD. Data were analyzed by one-way ANOVA followed by Tukey’s post-test. *p < 0.05, **p < 0.01, ***p < 0.001.
Figure 5
Figure 5
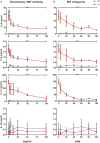
Effect of macrophage migration inhibitory factor (MIF) neutralization in the expression of cytokines from primary human immunodeficiency virus-infected and uninfected monocyte-derived macrophages (MDMs). Serial dilutions of a neutralizing αMIF antibody (clone NIHlllD.9) (A), and the MIF antagonist MIF098 (B) were used to inhibit MIF activity in infected (In, red lines) and uninfected (Un, gray lines) MDMs at a constant concentration of this cytokine (25 ng/ml). Data represent three independent experiments (donors), each evaluated in duplicate. Data represent the mean ± SD. Data were analyzed by two-way ANOVA followed by Tukey’s post-test (intragroup analysis, In group only; ****p < 0.0001) or by Sidak’s post-test (intergroup, In versus Un; #1p < 0.05, #2p < 0.01, #3p < 0.001, #4p < 0.0001). Asterisks corresponding to the intragroup analysis are shown above the horizontal bars, and those from the intergroup analysis are shown above points corresponding to each antagonist or antibody dilution.
Figure 6
Figure 6
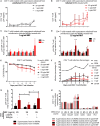
Induction of permissiveness to human immunodeficiency virus type I (HIV-1) infection in primary CD4+ T-cells after stimulation with macrophage migration inhibitory factor (MIF)-treated monocyte-derived macrophages (MDMs)-derived supernatants. (A,B) Seven-day kinetics of HIV p24 antigen production from primary unactivated CD4+ T-cell incubated with supernatants from uninfected (A) and infected (B) MDMs treated with 0, 1, or 25 ng/ml MIF. (C,D) Ratio of p24 production from unactivated CD4+ T-cell incubated with supernatants from uninfected MDMs and infected MDMs treated with 1 ng/ml MIF (C) or 25 ng/ml MIF (D) over the no-MIF condition. (E) Percentage of living CD4+ T-cells stimulated with supernatants derived from uninfected (black, dark gray, and light gray lines) and infected (pink, red, and dark red lines) MDMs. (F) Percentage of infected (GFP+) CD4+ T-cells after stimulation with MDM-derived supernatants obtained from MIF-treated uninfected MDMs (black, dark gray, and light gray lines), infected (pink, red, and dark red lines) MDMs, RPMI (negative control, black line with diamonds), or PHA (positive control, black line with triangles). (G) Ratio of p24 production from unactivated CD4+ T-cell incubated with supernatants from uninfected MDMs and infected MDMs treated with 25 ng/ml MIF, with or without CD74 blockade with an anti-CD74 antibody. (H) Expression of surface markers on CD4+ T-cells subjected to 72 h stimulation with supernatants derived from infected and uninfected MDMs and exposed or not to MIF treatment (0 and 25 ng/ml MIF). Data represent the mean ± SD from six independent donors evaluated in duplicate. In (C,D), data were analyzed by two-way ANOVA followed by Sidak’s post-test. In (G), data were analyzed by two-way ANOVA followed by Tukey’s post-test. *p < 0.05, ****p < 0.0001.
Figure 7
Figure 7
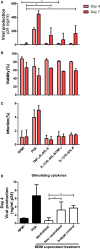
Identification of cytokines as responsible for enhancing human immunodeficiency virus type I (HIV-1) infection in unactivated CD4+ T-cells. (A) Unactivated CD4+ T-cells were stimulated with different combinations of cytokines for 72 h. Then, cells were infected and p24 antigen production was evaluated at days 4 and 7 post-infection. Each condition was compared with the corresponding RPMI condition (negative control). As a positive control, PHA stimulation was used. Percentage of living CD4+ T-cells (B) and percentage of infected (GFP+) CD4+ T-cells (C) after stimulation with the denoted treatments are shown. Data represent mean ± SD from four independent donors evaluated in duplicate. Concentrations of cytokines used in these experiments corresponded to the average concentrations found in monocyte-derived macrophage (MDM) supernatants stimulated with 25 ng/ml macrophage migration inhibitory factor (MIF) (peak effect) as follows: 250 pg/ml IL-6, 9,000 pg/ml IL-8, 1,400 pg/ml TNF-α, and 20 pg/ml IL-1β. (D) Neutralization of IL-8, IL-6, IL-1 β, and TNFα biological activity with monoclonal neutralizing antibodies. Primary CD4+ T-cells were incubated with supernatants derived from the 25 ng/ml MIF-treated HIV-infected MDM neutralized previously with 18 µg/ml anti-IL-8, 20 ng/ml anti-IL-6, 2 µg/ml anti-IL-1β, and 2 µg/ml anti-TNFα antibodies. Non-neutralized and isotype control antibody conditions were tested for comparison. Also, RPMI and PHA controls were included. Viral production was evaluated at day 4 post-infection. Data were analyzed by one-way ANOVA followed by Dunnett’s post-test (all conditions versus the corresponding RMPI control) in (A) and Tukey’s post-test in (D). *p < 0.05.
Figure 8
Figure 8
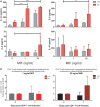
Infection of monocyte-derived macrophages (MDMs) and unactivated CD4+ T-cells with T/F viruses reproduce the results obtained with the R5-tropic (BAL) and the X4-tropic (NL4-3) laboratory strains. (A) Expression of IL-1β, IL-8, IL-6, and IL-10 in supernatants from uninfected (Un) and R5-tropic T/F-infected (In) MDMs. Data represent mean ± SD from three independent donors. Data were analyzed by two-way ANOVA followed by Tukey’s post-test. *p < 0.05, **p < 0.01, ****p < 0.0001. (B) Human immunodeficiency virus (HIV) p24 antigen production from primary unactivated CD4+ T-cells incubated with supernatants from uninfected and infected MDMs treated with 1 ng/ml (left panel) or 25 ng/ml (right panel) macrophage migration inhibitory factor (MIF). Treated CD4+ T-cells were infected with a dual-tropic T/F virus and viral production was evaluated at 4 and 7 days post-infection. Data represent mean ± SD from five independent donors. Data were analyzed by two-way ANOVA followed by Sidak’s post-test. *p < 0.05.

Similar articles

Cited by

References

    1. Hull M, Lange J, Montaner JS. Treatment as prevention – where next? Curr HIV/AIDS Rep (2014) 11(4):496–504.10.1007/s11904-014-0237-5 - DOI - PMC - PubMed
    1. Deeks SG, Tracy R, Douek DC. Systemic effects of inflammation on health during chronic HIV infection. Immunity (2013) 39(4):633–45.10.1016/j.immuni.2013.10.001 - DOI - PMC - PubMed
    1. Sattentau QJ, Stevenson M. Macrophages and HIV-1: an unhealthy constellation. Cell Host Microbe (2016) 19(3):304–10.10.1016/j.chom.2016.02.013 - DOI - PMC - PubMed
    1. Rodrigues V, Ruffin N, San-Roman M, Benaroch P. Myeloid cell interaction with HIV: a complex relationship. Front Immunol (2017) 8:1698.10.3389/fimmu.2017.01698 - DOI - PMC - PubMed
    1. Stumptner-Cuvelette P, Benaroch P. Multiple roles of the invariant chain in MHC class II function. Biochim Biophys Acta (2002) 1542(1–3):1–13.10.1016/S0167-4889(01)00166-5 - DOI - PubMed