. 2018 Jul 9;7(14):e009289.
doi: 10.1161/JAHA.118.009289.

Aberrant Mitochondrial Fission Is Maladaptive in Desmin Mutation-Induced Cardiac Proteotoxicity

Affiliations

Aberrant Mitochondrial Fission Is Maladaptive in Desmin Mutation-Induced Cardiac Proteotoxicity

Shafiul Alam et al. J Am Heart Assoc. .

Abstract

Background: Desmin filament proteins interlink the contractile myofibrillar apparatus with mitochondria, nuclei and the sarcolemma. Mutations in the human desmin gene cause cardiac disease, remodeling, and heart failure but the pathophysiological mechanisms remain unknown.

Methods and results: Cardiomyocyte-specific overexpression of mutated desmin (a 7 amino acid deletion R172-E178, D7-Des Tg) causes accumulations of electron-dense aggregates and myofibrillar degeneration associated with cardiac dysfunction. Though extensive studies demonstrated that these altered ultrastructural changes cause impairment of cardiac contractility, the molecular mechanism of cardiomyocyte death remains elusive. In the present study, we report that the D7-Des Tg mouse hearts undergo aberrant mitochondrial fission associated with increased expression of mitochondrial fission regulatory proteins. Mitochondria isolated from D7-Des Tg hearts showed decreased mitochondrial respiration and increased apoptotic cell death. Overexpression of mutant desmin by adenoviral infection in cultured cardiomyocytes led to increased mitochondrial fission, inhibition of mitochondrial respiration, and activation of cellular toxicity. Inhibition of mitochondrial fission by mitochondrial division inhibitor mdivi-1 significantly improved mitochondrial respiration and inhibited cellular toxicity associated with D7-Des overexpression in cardiomyocytes.

Conclusions: Aberrant mitochondrial fission results in mitochondrial respiratory defects and apoptotic cell death in D7-Des Tg hearts. Inhibition of aberrant mitochondrial fission using mitochondrial division inhibitor significantly preserved mitochondrial function and decreased apoptotic cell death. Taken together, our study shows that maladaptive aberrant mitochondrial fission causes desminopathy-associated cellular dysfunction.

Keywords: cardiomyopathy; desminopathy; mitochondrial fission; mitochondrial respiration.


Figures

Figure 1
Figure 1
Desmin expression in D7‐Des Tg mice hearts. A, Western blot analysis of desmin and αB‐crystallin protein expression in the soluble and insoluble protein fractions derived from 6‐month‐old D7‐Des Tg and Ntg hearts. n=5 mice per group. B, Confocal microscopy images of immunostaining of desmin (red) in heart sections showing aberrant desmin aggregates in D7‐Des Tg cardiomyocytes (Scale bars: 5 μm). CryAB indicates αB‐Crystallin; D7‐Des Tg, mutant desmin transgenic mouse; Ntg, non‐transgenic.
Figure 2
Figure 2
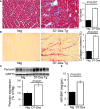
D7‐Des expression results in cardiac hypertrophy and fibrosis. A, Representative micrographs of Masson's trichrome‐stained LV myocardium and quantification of the cardiac fibrosis in Ntg and D7‐Des Tg hearts (n=5 mice per group). B, Representative micrographs of Sirius Red–stained LV myocardium and quantification of the myocardial collagen deposition in Ntg and D7‐Des Tg hearts (n=5 mice per group). C, Representative Western blot and densitometric quantification showing significantly increased expression of periostin in D7‐Des Tg hearts (n=5 mice per group). D, Heart‐weight‐to‐body‐weight ratios (HW/BW) showing LV hypertrophy in the D7‐Des Tg hearts (n≥6 or more mice per group). Bars represent mean±SEM. P values were determined by Tukey's post hoc test. Scale bars: 50 μm. D7‐Des Tg indicates mutant desmin transgenic mouse; LV, left ventricular; Ntg, non‐transgenic.
Figure 3
Figure 3
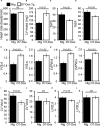
M‐mode echocardiography indices of cardiac structure and function in 6‐month‐old D7‐Des Tg mice. A, Heart rate (beats/min), (B) Left ventricular (LV) mass. (C) Percent fractional shortening (%FS). D, Percent ejection fraction (%EF). E and F, LV interventricular septum diastolic (IVS;d) and systolic (IVS;s) thickness. G and H, LV posterior wall diastolic (LVPW;d) and systolic (LVPW;s) thickness. I and J, LV diastolic (LV Vol;d) and systolic volume (LV Vol;s). K and L, LV internal dimension in end‐diastole (LVID;d) and end‐systole (LVIDs). Bars represent mean±SEM. n=10 mice per group. P value vs Ntg mice by Tukey's post hoc test. D7‐Des Tg indicates mutant desmin transgenic mouse; NS, not significant; Ntg, non‐transgenic.
Figure 4
Figure 4
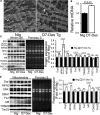
Aberrant mitochondrial fission and altered expression of fission regulatory proteins in D7‐Des Tg hearts. A, Representative transmission electron micrographs of hearts from D7‐Des Tg mice (Scale bars: 2 μm). B, Relative mtDNA content expressed compared with total genomic DNA (nDNA) in hearts of D7‐Des Tg was significantly increased compared with Ntg. Representative Western blot and densitometric quantification of the (C) whole cell fraction and (D) mitochondrial fraction showing expression of mitochondrial dynamic regulatory proteins in the D7‐Des Tg hearts: Drp1, pDrp1 (Ser 616), Fis 1, OPA1, OMA1, MFN2, Mff, Tom20, Tim23, and PGC1α. Ponceau S protein staining of the transfer membrane confirmed approximately equal loading across the gel. Bars represent mean±SEM. n=6 mice per group. P values were determined by Tukey's post hoc test. D7‐Des Tg indicates mutant desmin transgenic mouse; mtDNA, mitochondrial DNA; NS, not significant; Ntg, non‐transgenic.
Figure 5
Figure 5
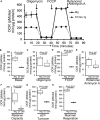
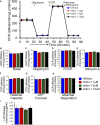
Suppression of mitochondrial respiration in D7‐Des Tg mice hearts. A, Mitochondrial oxygen consumption rate (OCR) profiles in isolated mitochondria from 6‐month‐old Ntg and D7‐Des Tg hearts. Arrow indicates the sequential addition of oligomycin (1 μmol/L), FCCP (4 μmol/L), and rotenone (0.5 μmol/L) plus antimycin A (0.5 μmol/L). OCR profiles are expressed as pmol O2/min per μg of protein. Graph shows OCR under (B) baseline as well as with the addition of (C) oligomycin, (D) FCCP, and (E) rotenone plus antimycin A. Key parameters of mitochondrial function, including (F) reserve capacity, (G) ATP turnover, and (H) maximal respiration were significantly decreased in D7‐Des Tg mice. n=3 mice per group. Boxes represent interquartile ranges, lines represent medians, whiskers represent ranges, and P values were determined by Kruskal–Wallis test. D7‐Des Tg indicates mutant desmin transgenic mouse; FCCP, carbonyl cyanide‐p‐trifluoromethoxy‐phenylhydrazone; Ntg, non‐transgenic.
Figure 6
Figure 6
Impaired OXPHOS protein expression and ATP content in the D7‐Des Tg hearts. A, Representative Western blot showing expression of Complex I, Complex II, Complex III, Complex V, and PDH complex protein derived from the mitochondrial fractions isolated from 6‐month‐old D7‐Des Tg hearts. Ponceau S protein stain of the transfer membrane was used to confirm approximately equal loading. Actin was used as a whole cell lysate and COX IV as a mitochondrial marker to indicate the purity of the fractionation. B, Densitometric quantification of OXPHOS complex and PDH complex protein. C, Mitochondrial and whole cellular ATP content in the D7‐Des Tg hearts. n=3 mice per group. Boxes represent interquartile ranges, lines represent medians, whiskers represent ranges, and P values were determined by Kruskal–Wallis test. D7‐Des Tg indicates mutant desmin transgenic mouse; NS, not significant; Ntg, non‐transgenic; PDH, pyruvate dehydrogenase.
Figure 7
Figure 7
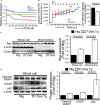
Altered mitochondrial swelling and calcium retention capacity in D7‐Des Tg hearts. A, Representative images of calcium‐induced mitochondrial swelling isolated from the D7‐Des Tg and Ntg hearts at 6 months of age. Mitochondrial swelling was induced by the addition of 200 μmol/L CaCl2. The assay was performed in 3 independent experiments, and representative tracings are shown. B, Representative traces and quantification of mitochondrial Ca2+‐retention capacity of D7‐Des Tg and Ntg hearts at 6 months of age. Fluorescence reading of Ca2+ measured with Calcium Green‐5N indicator in solution with subsequent addition of Ca2+ pulses of 20 nmol/mg of mitochondrial protein. Cumulative Ca2+ additions are shown at each arrowhead (n=5–6 mice per group). C, Representative Western blot and densitometric quantification shows significantly increased Bax expression and mitochondrial localization in the D7‐Des Tg mice hearts. D, Representative Western blot and densitometric quantification showing increased expression of cleaved PARP1, CHOP, and p62 protein isolated from the D7‐Des Tg mice heart (n=6 mice per group). Bars represent mean±SEM. P values were determined by Tukey's post hoc test. D7‐Des Tg indicates mutant desmin transgenic mouse; Ntg, non‐transgenic.
Figure 8
Figure 8
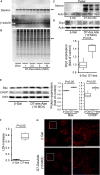
D7‐Des overexpression in NRCs. A, Overexpression of D7‐Des (indicated by arrow) in NRCs by adenoviral‐mediated infection at 1.0, 2.5, 5.0, and 10.0 MOI. B, Coomassie staining shows the D7‐Des protein (indicated by arrow). C, Pellet (insoluble) fraction shows accumulated desmin indicating aggregation. D, Drp1 expression in the NRCs is consistent with increased mitochondrial fission. E, Expression of Bax and CHOP in NRCs by D7‐Des overexpression. F, LDH release. n=3 replicates per group. Boxes represents interquartile ranges, lines represent medians, whiskers represent ranges, and P values were determined by Kruskal–Wallis test. G, NRCs were infected with D7‐Des adenovirus at 10 MOI and mitochondrial morphology was monitored by staining with mitochondrial marker Tom 20 (Red). Tom 20 staining shows fragmented mitochondria in the D7‐Des adeno‐infected NRCs (scale bar: 25 μm). D7‐Des Ade indicates mutant desmin adenovirus; LDH, lactate dehydrogenase; MOI, multiplicity of infection; NRCs, neonatal rat cardiomyocytes.
Figure 9
Figure 9
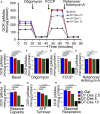
Suppression of mitochondrial respiration by adenovirus overexpression of D7‐Des in NRCs. A, Mitochondrial OCR profile in NRCs infected with D7‐Des adenovirus at 2.5, 5.0, and 10.0 multiplicities of infection or control adenovirus (β‐Gal). Arrows indicate the sequential addition of oligomycin (1 μmol/L), FCCP (4 μmol/L), and rotenone (0.5 μmol/L) plus antimycin A (0.5 μmol/L). OCR profile is expressed as pmol O2/min per μg of protein. Graph showing OCR at (B) baseline as well as with the addition of (C) oligomycin, (D) FCCP, and (E) rotenone plus antimycin A. Key parameters of mitochondrial function include (F) reserve capacity, (G) ATP turnover, and (H) maximal respiration. Bars represent mean±SEM. n=5 wells per group. P values were determined by Tukey's post hoc test. D7‐Des Tg indicates mutant desmin transgenic mouse; FCCP, carbonyl cyanide‐p‐trifluoromethoxy‐phenylhydrazone; NRCs, neonatal rat cardiomyocytes; NS, not significant; OCR, oxygen consumption rate.
Figure 10
Figure 10
Effects of mitochondrial fission inhibitor mdivi‐1 on mitochondrial respiration in NRCs. A, Mitochondrial oxygen consumption rate (OCR) profile in NRCs treated with 1, 5, and 10 μmol/L mdivi‐1 treatment for 24 hours in NRCs. Arrows indicate the sequential addition of oligomycin (1 μmol/L), FCCP (4 μmol/L), and rotenone (0.5 μmol/L) plus antimycin A (0.5 μmol/L). OCR profile is expressed as pmol O2/min per μg of protein. Graph shows OCR at (B) baseline as well as with the addition of (C) oligomycin, (D) FCCP, and (E) rotenone plus antimycin A. Key parameters of mitochondrial function including (F) reserve capacity, (G) ATP turnover, and (H) maximal respiration were not significantly changed by mdivi‐1 treatment. I, LDH release in the medium with increasing dose of mdivi‐1. Bars represent mean±SEM. n=5 wells per group. P values were determined by Tukey's post hoc test. FCCP indicates carbonyl cyanide‐p‐trifluoromethoxy‐phenylhydrazone; LDH, lactate dehydrogenase; NRC, neonatal rat cardiomyocyte.
Figure 11
Figure 11
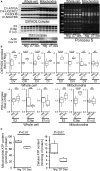
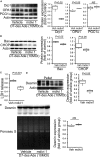
Mitochondrial fission inhibition by mdivi‐1 in D7‐Des overexpressed NRCs. A, Representative Western blot and densitometric quantification showing Drp1, OPA1, and PGC1α expression after 5 μmol/L mdivi‐1 or vehicle for 24 hours in D7‐Des overexpressed cardiomyocytes. B, Expression of Bax and CHOP in the whole cell lysate, and (C) LDH release in the medium after 5 μmol/L mdivi‐1 or vehicle treatment. D, Desmin expression in the pellet fraction was significantly decreased after mdivi‐1 treatment. E, Desmin expression in the whole cell fraction was not significantly changed after mdivi‐1 treatment. Ponceau S protein stain of the transfer membrane was used to confirm approximately equal loading. n=3 replicates per group. Boxes represents interquartile ranges, lines represent medians, whiskers represent ranges, and P values were determined by Kruskal–Wallis test. LDH indicates lactate dehydrogenase; MOI, multiplicities of infection; NRCs, neonatal rat cardiomyocytes; NS, not significant.
Figure 12
Figure 12
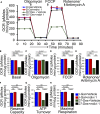
Mitochondrial fission inhibition by mdivi‐1 preserved mitochondrial respiration in D7‐Des overexpressed NRCs. A, Mitochondrial oxygen consumption rate (OCR) profile in NRCs treated with 5 μmol/L mdivi‐1 or vehicle for 24 hours in D7‐Des overexpressed cardiomyocytes. Arrow indicates the sequential addition of oligomycin (1 μmol/L), FCCP (4 μmol/L), and rotenone (0.5 μmol/L) plus antimycin A (0.5 μmol/L). OCR profile is expressed as pmol O2/min per μg of protein. Graph shows OCR under (B) baseline as well as with the addition of (C) oligomycin, (D) FCCP, and (E) rotenone plus antimycin A. Critical parameters of mitochondrial function including (F) reserve capacity, (G) ATP turnover, and (H) maximal respiration were significantly rescued by mdivi‐1 treatment in D7‐Des overexpressed NRCs. Bars represent mean±SEM. n=5 wells per group. P values were determined by Tukey's post hoc test. FCCP indicates carbonyl cyanide‐p‐trifluoromethoxy‐phenylhydrazone; NRCs, neonatal rat cardiomyocytes; NS, not significant.

Similar articles

Cited by

References

    1. Reipert S, Steinbock F, Fischer I, Bittner RE, Zeold A, Wiche G. Association of mitochondria with plectin and desmin intermediate filaments in striated muscle. Exp Cell Res. 1999;252:479–491. - PubMed
    1. Wang K, Ramirez‐Mitchell R. A network of transverse and longitudinal intermediate filaments is associated with sarcomeres of adult vertebrate skeletal muscle. J Cell Biol. 1983;96:562–570. - PMC - PubMed
    1. Bar H, Strelkov SV, Sjoberg G, Aebi U, Herrmann H. The biology of desmin filaments: how do mutations affect their structure, assembly, and organisation? J Struct Biol. 2004;148:137–152. - PubMed
    1. Li Z, Colucci‐Guyon E, Pincon‐Raymond M, Mericskay M, Pournin S, Paulin D, Babinet C. Cardiovascular lesions and skeletal myopathy in mice lacking desmin. Dev Biol. 1996;175:362–366. - PubMed
    1. Milner DJ, Weitzer G, Tran D, Bradley A, Capetanaki Y. Disruption of muscle architecture and myocardial degeneration in mice lacking desmin. J Cell Biol. 1996;134:1255–1270. - PMC - PubMed

Publication types

LinkOut - more resources