. 2018 Oct;67(10):1999-2011.
doi: 10.2337/db17-1174. Epub 2018 Jul 9.

Restoration of Glucose-Stimulated Cdc42-Pak1 Activation and Insulin Secretion by a Selective Epac Activator in Type 2 Diabetic Human Islets

Affiliations

Restoration of Glucose-Stimulated Cdc42-Pak1 Activation and Insulin Secretion by a Selective Epac Activator in Type 2 Diabetic Human Islets

Rajakrishnan Veluthakal et al. Diabetes. 2018 Oct.

Abstract

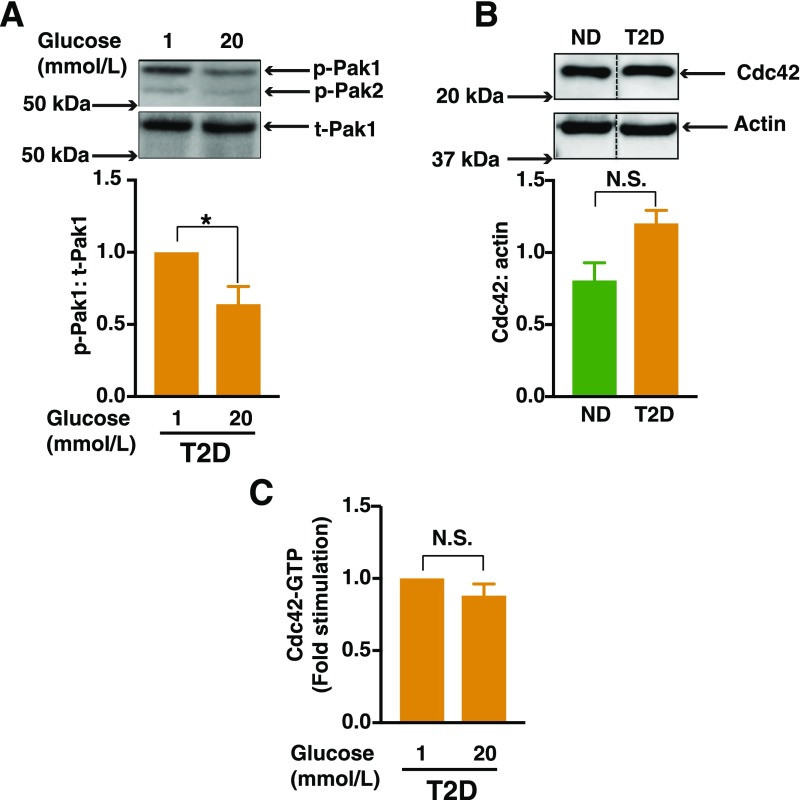
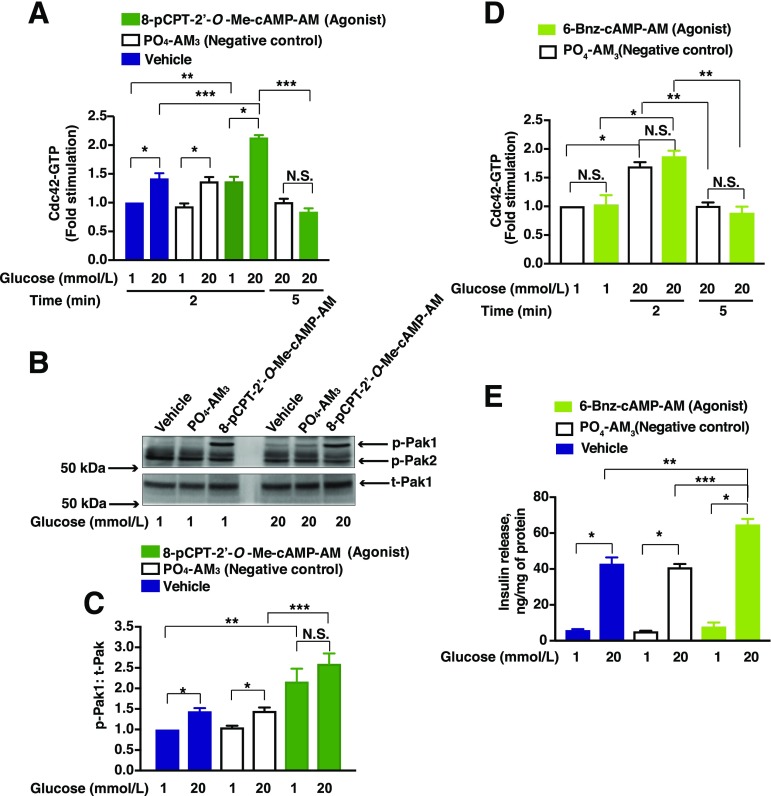
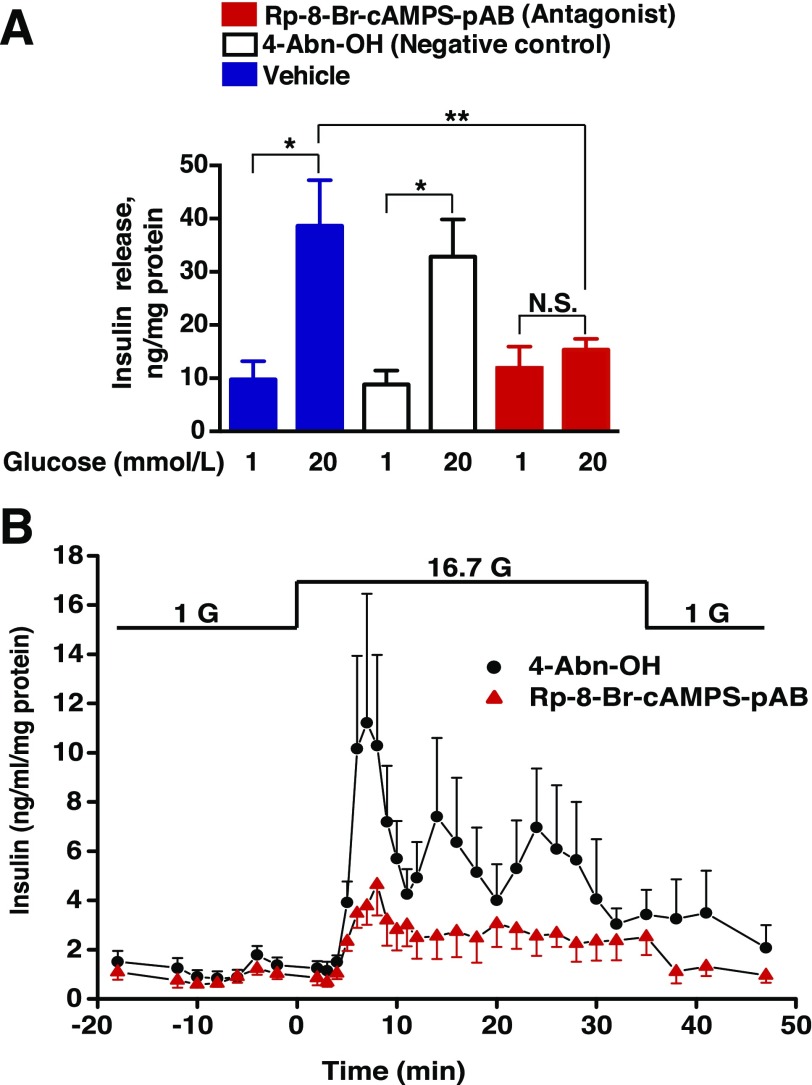
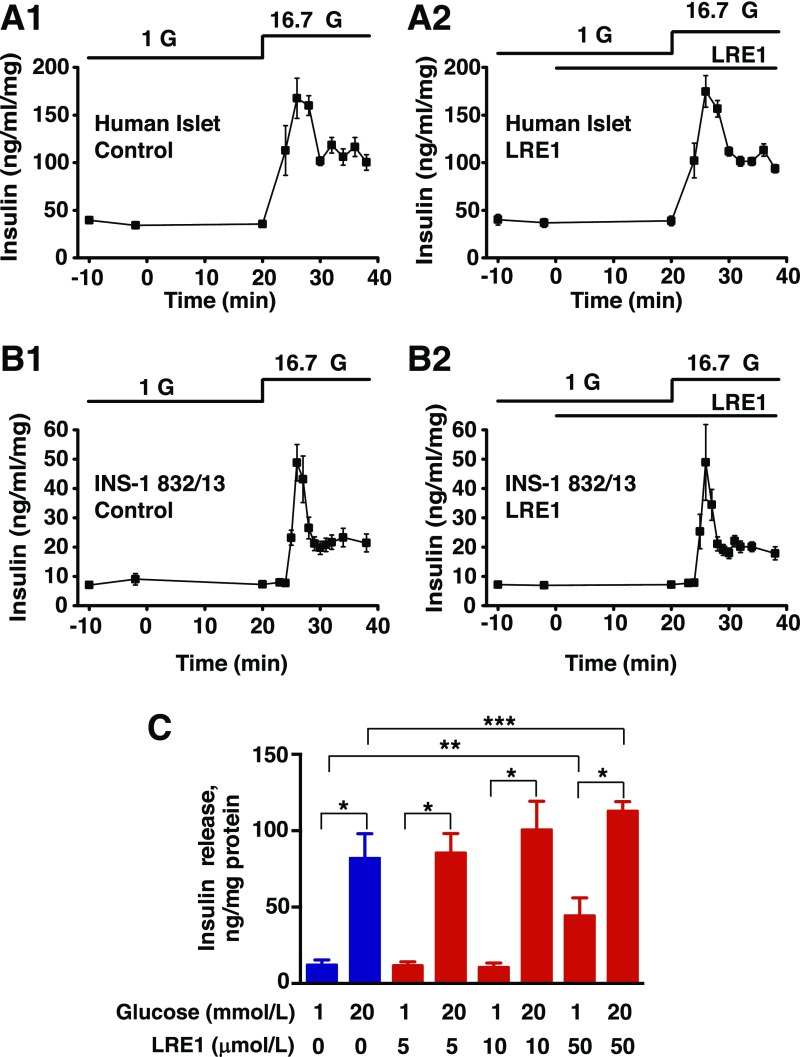
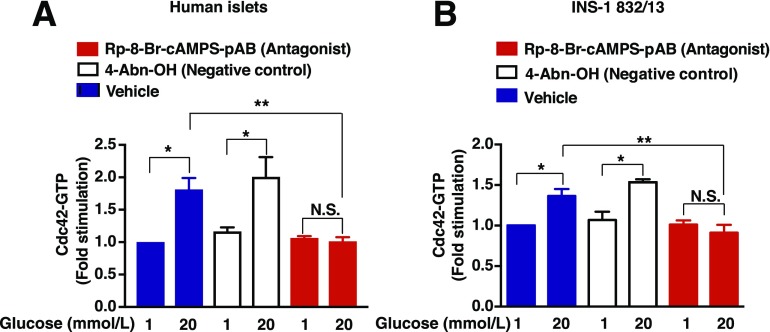
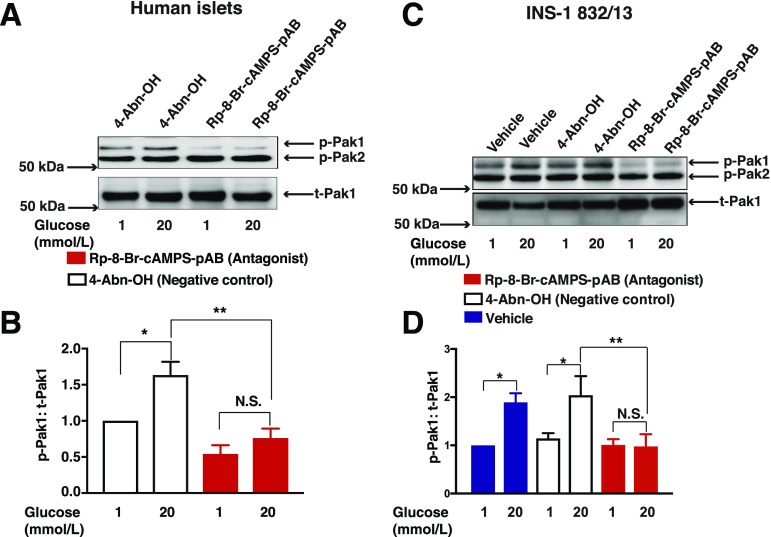
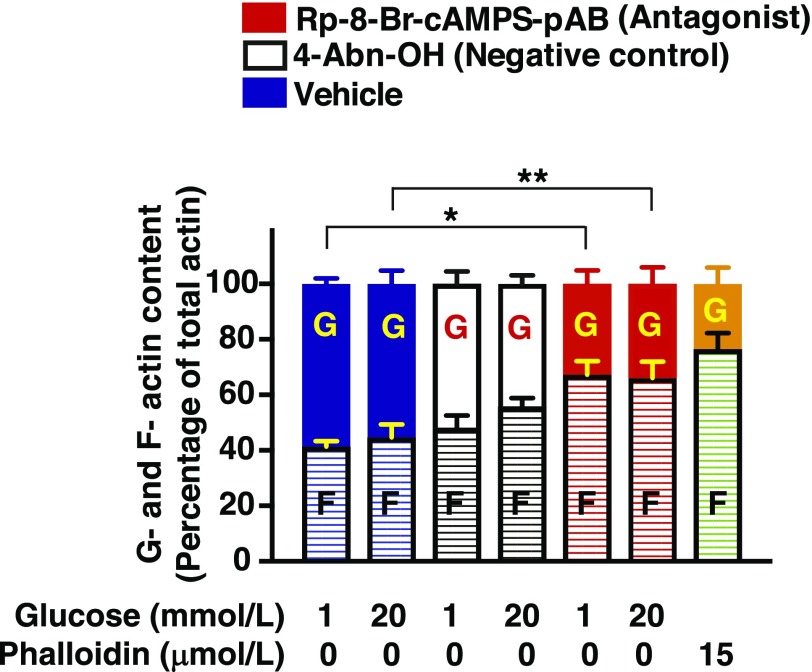
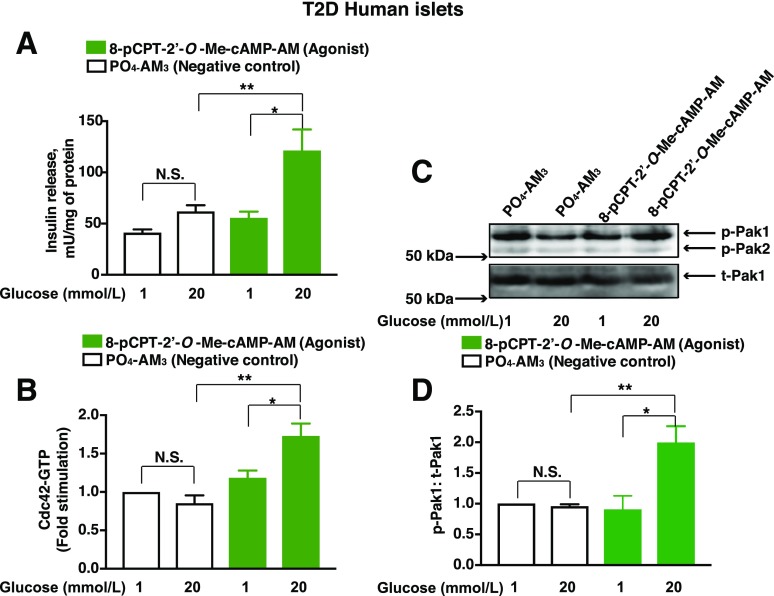
Glucose metabolism stimulates cell division control protein 42 homolog (Cdc42)-p21-activated kinase (Pak1) activity and initiates filamentous actin (F-actin) cytoskeleton remodeling in pancreatic β-cells so that cytoplasmic secretory granules can translocate to the plasma membrane where insulin exocytosis occurs. Since glucose metabolism also generates cAMP in β-cells, the cross talk of cAMP signaling with Cdc42-Pak1 activation might be of fundamental importance to glucose-stimulated insulin secretion (GSIS). Previously, the type-2 isoform of cAMP-regulated guanine nucleotide exchange factor 2 (Epac2) was established to mediate a potentiation of GSIS by cAMP-elevating agents. Here we report that nondiabetic human islets and INS-1 832/13 β-cells treated with the selective Epac activator 8-pCPT-2'-O-Me-cAMP-AM exhibited Cdc42-Pak1 activation at 1 mmol/L glucose and that the magnitude of this effect was equivalent to that which was measured during stimulation with 20 mmol/L glucose in the absence of 8-pCPT-2'-O-Me-cAMP-AM. Conversely, the cAMP antagonist Rp-8-Br-cAMPS-pAB prevented glucose-stimulated Cdc42-Pak1 activation, thereby blocking GSIS while also increasing cellular F-actin content. Although islets from donors with type 2 diabetes had profound defects in glucose-stimulated Cdc42-Pak1 activation and insulin secretion, these defects were rescued by the Epac activator so that GSIS was restored. Collectively, these findings indicate an unexpected role for cAMP as a permissive or direct metabolic coupling factor in support of GSIS that is Epac2 and Cdc42-Pak1 regulated.


Figures

Figure 1
Figure 1
Defective activation of Pak1 and Cdc42 in islets from human donors with T2D. A: Human T2D islets were allowed to recover for 2 h in CMRL media and were then further incubated for 1 h with KRBH prior to each experiment. Islets were then incubated in the presence of either a low (1 mmol/L) or high (20 mmol/L) glucose concentration for 5 min. Pak1 activity (phosphorylation of Pak1 [p-Pak1] Thr423) was normalized to total Pak1 (t-Pak1) protein content by Western blot analysis. Densitometry analysis of n = 3 independent experiments, shown as the mean ± SEM; *P < 0.05 vs. 1 mmol/L glucose concentration. B: Cdc42 expression from islets from humans without diabetes (ND) (n = 5) or islets from humans with T2D (n = 5). Densitometry analysis of n = 5 independent experiments, shown as the mean ± SEM; black vertical dashed lines indicate the splicing of lanes from within the same gel exposure. C: T2D islets incubated either in the presence of low (1 mmol/L) or high (20 mmol/L) glucose for 2 min prior to their lysis. Cdc42-GTP was quantified by the G-LISA method. Data represent the mean ± SEM from n = 3 independent experiments. P > 0.05. N.S., not significant.
Figure 2
Figure 2
8-pCPT-2′-O-Me-cAMP-AM increases levels of Cdc42-GTP and phosphorylation of Pak1 (p-Pak1). INS-1 832/13 cells were incubated overnight in low-serum and low-glucose culture media, and further incubated for 1 h with low glucose KRBH prior to each experiment. Cells were then pretreated for 20 min with low-glucose solutions containing the vehicle, PO4-AM3 (3.3 μmol/L), 8-pCPT-2′-O-Me-cAMP-AM (10 μmol/L), or 6-Bnz-cAMP-AM (10 μmol/L). Cells were then exposed for an additional 2 or 5 min (for Cdc42 activation assay) and 5 min (for p-Pak1) to KRBH containing either low glucose (1 mmol/L) or high glucose (20 mmol/L) prior to their lysis. Cdc42-GTP was quantified by the G-LISA method. A: Data represent the mean ± SEM from n = 3 independent experiments; *P < 0.05 vs. 1 mmol/L glucose within the respective treatment group; **P < 0.05 vs. 1 mmol/L glucose treated with vehicle; ***P < 0.05, 20 mmol/L glucose treated with 8-pCPT-2′-O-Me-cAMP-AM vs. vehicle; ***P < 0.05, 20 mmol/L glucose treated with 8-pCPT-2′-O-Me-cAMP-AM at 5 min vs. at 2 min. N.S., not significant. B: Representative immunoblots from one of four experiments demonstrate the p-Pak1 vs. total Pak1 (t-Pak1). C: Densitometry analysis of n = 4 independent experiments, shown as the mean ± SEM; *P < 0.05 vs. 1 mmol/L glucose with vehicle or PO4-AM3; **P < 0.05 vs. 1 mmol/L glucose treated with vehicle; ***P < 0.05 vs. 20 mmol/L glucose with PO4-AM3. N.S., not significant. D: Data represent the mean ± SEM from n = 3 independent experiments; *P < 0.05 vs. 1 mmol/L glucose within the respective treatment group; **P < 0.05 vs. 20 mmol/L glucose treated with PO4-AM3 at 2 min. N.S., not significant. E: Data represent the mean ± SEM from n = 3 independent experiments; *P < 0.05 vs. 1 mmol/L glucose within the respective treatment group; **P < 0.05 vs. 20 mmol/L glucose treated with vehicle; ***P < 0.05 vs. 20 mmol/L glucose treated with PO4-AM3.
Figure 3
Figure 3
Rp-8-Br-cAMPS-pAB inhibits GSIS from INS-1 832/13 cells. Rp-8-Br-cAMPS-pAB (10 μmol/L) and 4-Abn-OH (10 μmol/L) were tested for their abilities to alter GSIS in 30-min static incubation assays using INS-1 832/13 cell monolayers (A) or in perifusion assays using pseudoislets (B). Rp-8-Br-cAMPS-pAB and 4-Abn-OH were each dissolved in a KRBH vehicle solution containing 0.1% DMSO and either low or high concentrations of glucose (1 G, 1 mmol/L glucose; 16.7 G, 16.7 mmol/L glucose). Data points for A indicate the mean ± SEM for n = 3 independent experiments; *P < 0.05 vs. 1 mmol/L glucose in the presence of the vehicle or 4-Abn-OH; **P < 0.05 vs. 20 mmol/L glucose in the presence of the vehicle. Data points for B indicate the mean ± SEM for n = 3 independent experiments. Values of secreted insulin were normalized relative to the total cellular protein content. N.S., not significant.
Figure 4
Figure 4
LRE1 fails to inhibit GSIS from human islets and INS-1 832/13 cells. LRE1 failed to inhibit basal (1 mmol/L glucose) or stimulated (20 mmol/L glucose) insulin secretion from perifused human islets (A1 and A2) and perifused INS-1 832/13 pseudoislets (B1 and B2). C: LRE1 also failed to inhibit GSIS from monolayers of INS-1 832/13 cells in static incubation assays. Values of secreted insulin in (AC) were normalized relative to the total cellular protein content. For perifusion assays, LRE1 was tested at a concentration of 50 μmol/L (A and B) dissolved in solutions containing 1 or 16.7 mmol/L glucose (G). Data for human islets indicate the mean ± SD for n = 2 independent experiments (A1 and A2). Data for perifused INS-1 832/13 pseudoislets indicate the mean ± SEM for n = 3 independent experiments (B1 and B2). Data for static incubations of INS-1 832/13 cells indicate the mean ± SEM for n = 3 independent experiments (C); *P < 0.05 vs. 1 mmol/L glucose; **P < 0.05 vs. 1 mmol/L glucose in the absence of LRE1; ***P < 0.05 vs. 20 mmol/L glucose in the absence of LRE1.
Figure 5
Figure 5
Rp-8-Br-cAMPS-pAB blocks Cdc42 activation in human islets and INS-1 832/13 cells. Human islets (A) or INS-1 832/13 cells (B) were pretreated for 20 min with a vehicle solution containing 1 mmol/L glucose and 0.1% DMSO dissolved in KRBH. For comparison, cells were also pretreated with 4-Abn-OH (10 μmol/L) or Rp-8-Br-cAMPS-pAB (10 μmol/L) dissolved in KRBH containing 1 mmol/L glucose and 0.1% DMSO. Cells were then treated for 2 min with KRBH containing 1 or 20 mmol/L glucose and either 0.1% DMSO, 4-Abn-OH (10 μmol/L), or Rp-8-Br-cAMPS-pAB (10 μmol/L). After lysis, Cdc42-GTP was detected by G-LISA, and a value of 1.0 was assigned to the baseline level of Cdc42-GTP detected in cells treated with the vehicle solution containing 1 mmol/L glucose alone. Data are the mean ± SEM fold-stimulation relative to baseline for n = 3 independent experiments in replicates; *P < 0.05 vs. 1 mmol/L glucose with vehicle or 4-Abn-OH; **P < 0.05 vs. 20 mmol/L glucose with vehicle. N.S., not significant.
Figure 6
Figure 6
Rp-8-Br-cAMPS-pAB blocks Pak1 activation in human islets and INS-1 832/13 cells. Human islets (A and B) or INS-1 832/13 cells (C and D) were pretreated for 20 min with a vehicle solution composed of KRBH containing 1 mmol/L glucose and 0.1% DMSO. For comparison, cells were also pretreated with 4-Abn-OH (10 μmol/L) or Rp-8-Br-cAMPS-pAB (10 μmol/L) dissolved in KRBH containing 1 mmol/L glucose and 0.1% DMSO. Cells were then treated for 5 min with KRBH containing 1 or 20 mmol/L glucose and 0.1% DMSO, 4-Abn-OH (10 μmol/L), or Rp-8-Br-cAMPS-pAB (10 μmol/L). A and C: Immunoblots are representative of three or five identical independent experiments using human islets or INS-1 832/13 cells, respectively, showing the stimulation of Pak1 phosphorylation (p-Pak1) vs. total Pak1 (t-Pak1) present in the cell lysates. B and D: Densitometry analysis of n = 3 for human islets and n = 5 independent experiments for INS-1 832/13 cells, shown as the mean ± SEM. *P < 0.05 vs. 1 mmol/L glucose with vehicle or 4-Abn-OH; **P < 0.05 vs. 20 mmol/L glucose with 4-Abn-OH. N.S., not significant.
Figure 7
Figure 7
Rp-8-Br-cAMPS-pAB alters the G-actin (G)/F-actin (F) ratio. INS-1 832/13 cells were incubated overnight in low-serum and low-glucose culture media and were further incubated for 1 h with low-glucose KRBH prior to each experiment. Cells were then pretreated for 20 min with low-glucose KRBH containing the vehicle, 4-Abn-OH (10 μmol/L), or Rp-8-Br-cAMPS-pAB (10 μmol/L). Next, cells were exposed for 5 min to KRBH containing low glucose (1 mmol/L) or high glucose (20 mmol/L) prior to lysis in a buffer that solubilizes G-actin but not F-actin. Centrifugation was used to pellet F-actin while leaving G-actin in the supernatant. Proteins were subjected to 10% SDS-PAGE and Western blot analysis to detect G- and F-actin. Densitometry analysis of three independent experiments is shown as the mean ± SEM. The y-axis scaling indicates the percentage of total actin; *P < 0.05 vs. 1 mmol/L glucose in the presence of vehicle; **P < 0.05 vs. 20 mmol/L glucose in the presence of vehicle.
Figure 8
Figure 8
Restoration of Cdc42-Pak1 activation and GSIS in human T2D islets by Epac activator 8-pCPT-2′-O-Me-cAMP-AM. A: T2D islets were pretreated for 20 min with low-glucose solutions containing PO4-AM3 (3.3 μmol/L) or 8-pCPT-2′-O-Me-cAMP-AM (10 μmol/L). Islets were then exposed for 30 min to KRBH containing either a low-glucose (1 mmol/L) or high-glucose (20 mmol/L) concentration, and the supernatants were collected to measure insulin released into the media. Data represent the mean ± SEM from three independent experiments; *P < 0.05 vs. 1 mmol/L glucose treated with 8-pCPT-2′-O-Me-cAMP-AM and **P < 0.05 vs. 20 mmol/L glucose treated with PO4-AM3. B and C: T2D islets were pretreated for 20 min with low-glucose solutions containing PO4-AM3 (3.3 μmol/L) or 8-pCPT-2′-O-Me-cAMP-AM (10 μmol/L). Islets were then exposed for 2 min (B, Cdc42 activation) or 5 min (C, Pak1 activation) to KRBH containing either a low-glucose (1 mmol/L) or high-glucose (20 mmol/L) concentration prior to their lysis. Cdc42-GTP was quantified by the G-LISA method. Data represent the mean ± SEM from three independent experiments: *P < 0.05 vs. 1 mmol/L glucose treated with 8-pCPT-2′-O-Me-cAMP-AM and **P < 0.05 vs. 20 mmol/L glucose treated with PO4-AM3. C: Representative immunoblots from one of three experiments demonstrate the phosphorylation of Pak1 (p-Pak1) (C) vs. total Pak1 (t-Pak1) (D). Densitometry analysis of n = 3 independent experiments, shown as the mean ± SEM; *P < 0.05 vs. 1 mmol/L glucose with 8-pCPT-2′-O-Me-cAMP-AM and **P < 0.05 vs. 20 mmol/L glucose treated with PO4-AM3. N.S., not significant.

Similar articles

Cited by

References

    1. Prentki M, Nolan CJ. Islet beta cell failure in type 2 diabetes. J Clin Invest 2006;116:1802–1812 - PMC - PubMed
    1. Prentki M, Matschinsky FM, Madiraju SR. Metabolic signaling in fuel-induced insulin secretion. Cell Metab 2013;18:162–185 - PubMed
    1. Seino S, Shibasaki T, Minami K. Dynamics of insulin secretion and the clinical implications for obesity and diabetes. J Clin Invest 2011;121:2118–2125 - PMC - PubMed
    1. Rorsman P, Braun M. Regulation of insulin secretion in human pancreatic islets. Annu Rev Physiol 2013;75:155–179 - PubMed
    1. Wang Z, Oh E, Thurmond DC. Glucose-stimulated Cdc42 signaling is essential for the second phase of insulin secretion. J Biol Chem 2007;282:9536–9546 - PMC - PubMed

Publication types

MeSH terms