. 2018 Jul 5;71(1):129-141.e8.
doi: 10.1016/j.molcel.2018.06.008.

A Muscle-Specific Enhancer RNA Mediates Cohesin Recruitment and Regulates Transcription In trans

Affiliations

A Muscle-Specific Enhancer RNA Mediates Cohesin Recruitment and Regulates Transcription In trans

Pei-Fang Tsai et al. Mol Cell. .

Abstract

The enhancer regions of the myogenic master regulator MyoD give rise to at least two enhancer RNAs. Core enhancer eRNA (CEeRNA) regulates transcription of the adjacent MyoD gene, whereas DRReRNA affects expression of Myogenin in trans. We found that DRReRNA is recruited at the Myogenin locus, where it colocalizes with Myogenin nascent transcripts. DRReRNA associates with the cohesin complex, and this association correlates with its transactivating properties. Despite being expressed in undifferentiated cells, cohesin is not loaded on Myogenin until the cells start expressing DRReRNA, which is then required for cohesin chromatin recruitment and maintenance. Functionally, depletion of either cohesin or DRReRNA reduces chromatin accessibility, prevents Myogenin activation, and hinders muscle cell differentiation. Thus, DRReRNA ensures spatially appropriate cohesin loading in trans to regulate gene expression.

Keywords: Myogenin; cohesin; enhancer RNA; muscle gene transcription; non-coding RNA.


Conflict of interest statement

DECLARATION OF INTERESTS

The authors declare no competing interests.

Figures
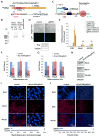
Figure 1
Figure 1. DRReRNA is Required for Myogenin Expression
(A) Schematic representation of DRReRNA transcripts and donor and acceptor sites. (B) Reverse-transcription PCR analysis of DRReRNA. C2C12 MB (MB); C2C12 MT (MT); R, random hexamers; dT, oligo dT primers used in RT. PCR products were run on a 1.0% agarose gel. (C) Schematic representation of DRRsgRNAs-directed dCAS9-KRAB at the DRR locus. (D) Detection of dCAS9-KRAB-GFP-FLAG fusion protein expressed in C2C12 cells transduced with control or dCAS9-KRAB-DRRsgRNA1 lentivirus (top panel). Cell extracts were immunoblotted with Flag and tubulin antibodies (bottom panel). (E) H3K9me3 ChIP-qPCR at DRR, and MyoD and GAPDH promoters in C2C12 cells transduced with control dCAS9-KRAB, dCAS9-KRAB-DRRsgRNA1 and dCAS9-KRAB-DRRsgRNA2 viruses, respectively. Data are presented as mean ± SD (n=5), (*) P < 0.05. NS, not significant. (F,G) Relative expression of DRReRNA, MyoD, and Myogenin transcripts measured by RT-qPCR in C2C12 cells transduced with either control dCAS9-KRAB or dCAS9-KRAB-DRRsgRNA1 and induced to differentiate for either 4 hr or 24 hr. Data are presented as mean ± SD (n=3), (*) P < 0.05, (***) P < 0.005. (H) Immunoblotting with MyoD, Myogenin, and tubulin antibodies of cell extracts derived from C2C12 cells transduced with either dCAS9-KRAB or dCAS9-KRAB-DRRsgRNA1 and differentiated (differentiation medium, DM) for 24 hr. (I) Immunofluorescence detection of Myogenin (red) in C2C12 cells transduced with either dCAS9-KRAB or dCAS9-KRAB-DRRsgRNA1 and differentiated for 24 hr. Quantification of Myogenin-positive control and dCAS9-KRAB-DRRsgRNA1 cells. Data are presented as mean ± SD (10 randomly chosen microscopic fields), (***) P < 0.005. (J) Immunofluorescence detection of Myosin Heavy Chain (MHC) (red) in C2C12 cells transduced with either dCAS9-KRAB or dCAS9-KRAB-DRRsgRNA1 and differentiated for 48 hr. Fusion index (percentage of myotubes containing > 3 nuclei) in control and dCAS9-KRAB-DRRsgRNA1 cells. Data are presented as mean ± SD (10 randomly chosen microscopic fields), (***) P < 0.005.
Figure 2
Figure 2. DRReRNA is Recruited to the Myogenin Locus
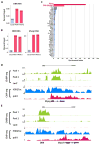
(A,B) PCR quantification, expressed as percentage of input, of RNA (DRR) and DNA (DRR and Myogenin) recovered after lacZ ChIRP or DRReRNA ChIRP with two different biotinylated probe sets (Pool1 and Pool2) in C2C12 MT. (C) Enrichment index of DRReRNA ChIRP-seq peaks at assigned genes obtained by calculating the area and width of low-error peaks of two independent replicates as described in Experimental Procedures. (D) DRReRNA ChIRP-seq profiles at the Myogenin locus in C2C12 MT. The signals in Pool 1 track were obtained with “odd” DRReRNA and those in Pool 2 with “even” DRReRNA oligonucleotide probes. ChIP-seq tracks for H3K27ac and polII (Dell’Orso et al., 2016). (E) DRReRNA ChIRP profiles at the DRR and MyoD locus in C2C12 MT.
Figure 3
Figure 3. DRReRNA Colocalizes with Pre-mRNA Myogenin
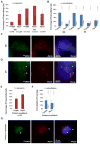
(A) Single molecule RNA FISH (smFISH) quantification of signals corresponding to DRReRNA and pre-mRNA Myogenin transcripts in undifferentiated C2C12 myoblasts (MB) and C2C12 cells differentiated for 24 hr (myotubes, MT); and of pre-mRNA MyoD transcripts in C2C12 MT. Cells containing at least one spot in the nucleus were classified as “transcribing”. Data are presented as mean± SD. Total number of signal-positive cells is indicated. (B) Percentage of observed DRReRNA-pre-mRNA Myogenin and pre-mRNA Myogenin-DRReRNA colocalization signals in C2C12 MB and MT; and of DRReRNA-pre-mRNA MyoD and pre-mRNA-MyoD-DRReRNA colocalization signals in C2C12 MT. (C) Representative images of smFISH in C2C12 MB cells using DRReRNA (Cy3, green) and Myogenin intronic probes (Cy5, red). Colocalizated fluorescent spots are identified by yellow arrows. (D) Representative images of smFISH in C2C12 MT cells using DRReRNA probes and Myogenin intronic probes. Colocalizated fluorescent spots are identified by yellow arrows. DRReRNA non-colocalizated fluorescent spots are identified by white arrowheads. (E) smFISH quantification for DRReRNA and pre-mRNA Myogenin transcripts in primary myoblasts. Cells containing at least one spot in the nucleus were classified as “transcribing”. Data are presented as mean± SD. The total number of signal-positive cells is indicated. (F) Percentage of observed DRReRNA-pre-mRNA Myogenin and pre-mRNA Myogenin-DRReRNA in primary myoblasts. (G) Representative images of smFISH in primary myoblasts using DRReRNA and Myogenin intronic probes. Colocalizated fluorescent spots are identified by yellow arrows. DRReRNA and pre-mRNA Myogenin non-colocalizated fluorescent spots are identified by white arrowheads.
Figure 4
Figure 4. DRReRNA Interacts with Components of the Cohesin Complex
(A) DRReRNA-interacting proteins identified by mass spectrometry. (B) Biotinylated sense (S) and antisense (AS) DRReRNAs were incubated with C2C12 MT nuclear extracts and RNA-protein complexes were immunoblotted with HNRNPA2B1, NIPBL, SMC3, or PDS5B antibodies. (C) C2C12 nuclear extracts were immunoprecipitated with either IgG or SMC3 antibody, the associated RNAs were reversed transcribed and amplified using specific primers for MyoD, DRReRNA, or Myogenin transcripts. Relative enrichment was measured by RT-qPCR. Data are presented as mean ± SD (n=3), (*) P < 0.05. (D) Input and immunoprecipitated SMC3 protein were documented by immunoblotting.
Figure 5
Figure 5. Depletion of DRReRNA-Interacting Proteins HNRNPA2B1 and SMC3
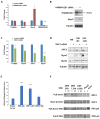
(A) Relative expression measured by RT-qPCR of DRReRNA, MyoD, Myogenin, and HNRNPA2B1 transcripts in C2C12 cells transfected with either control or HNRNPA2B1-siRNA. Data are presented as mean ± SD (n=3), (*) P < 0.05, (***) P < 0.005. (B) C2C12 cells were transfected with either control or HNRNPA2B1siRNA and cell extracts immunoblotted with HNRNPA2B1, Myogenin, or tubulin antibodies. (C) Relative expression measured by RT-qPCR of DRReRNA, MyoD, SMC3, and Myogenin transcripts from 48 hours differentiated C2C12 transfected with either control or SMC3siRNA. Data are presented as mean ± SD (n=3), (*) P < 0.05, (***) P < 0.005. (D) C2C12 cells were transfected with either control or SMC3siRNA and either collected as undifferentiated myoblasts (MB) or induced to differentiate for 4 hr or 24 hr (DM, differentiation medium). Cell extracts were immunoblotted with SMC3, Myogenin, MyoD, or tubulin antibodies. (E) C2C12 cells were transfected with empty vector, DRR 2kb, 1.2kb, or 0.5kb expression vectors (Mousavi et al., 2013) and Myogenin mRNA levels measured by RT-qPCR. Data are presented as mean ± SD (n=3), (***) P < 0.005. (F) Biotinylated sense (S) and antisense (AS) DRReRNA 2kb, 1.2kb or 0.5kb transcripts were incubated with C2C12 MT nuclear extracts and the eluted RNA-protein complexes were subjected to immunoblotting with SMC3 antibodies. Sense MyoD and actin transcripts were employed as control.
Figure 6
Figure 6. DRReRNA-Dependent Recruitment of SMC3 at the Myogenin Locus
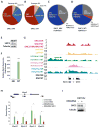
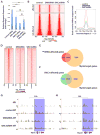
(A) Distribution of SMC3 ChIP-seq signals in C2C12 MB and (B) C2C12 MT. (C) Distribution of SMC3 at H3K4me1+, H3K4me1+/H3K27Ac+ or H3K4me1+/H3K27me3+ regions in C2C12 MB. (D) Distribution of SMC3 at H3K4me1+, H3K4me1+/H3K27Ac+ or H3K4me1+/H3K27me3+ regions in C2C12 MT. (E) Cell extracts derived from C2C12 MB and MT were immunoblotted with SMC3 and tubulin antibodies. (F) Relative levels of Myogenin transcripts in C2C12 MB and MT. Data are presented as mean ± SD (n=3), (***) P < 0.005. (G) SMC3 ChIP-seq profiles at the Myogenin locus in C2C12 MB, control C2C12 MT and DRReRNA siRNA-transfected C2C12 MT. PolII, H3K4me1, H3K4me1, H3K4me3, and H3K27ac tracks are from (Dell’Orso et al., 2016). (H) SMC3 ChIP-qPCR at Myogenin in C2C12 cells transfected after 8 hr of differentiation with either control or DRReRNAsiRNA and further differentiated to 72 hr. Data are presented as mean ± SD (n=3), (*) P < 0.05, (**) P < 0.01. (I) Extracts from control and DRReRNAsiRNA transfected C2C12 cells employed in (H) were subjected to immunoblotting with SMC3 or tubulin antibodies.
Figure 7
Figure 7. DRReRNA and Cohesin Regulate Chromatin Accessibility
(A) Relative expression of Myogenin transcripts measured by RT-qPCR in C2C12 cells transfected with control, DRReRNA, SMC3, or a combination of DRReRNA and SMC3 siRNAs and induced to differentiate for 16 hr. Data are presented as mean ± SD (n=5), (***) P < 0.005, NS, not significant. (B) Heatmaps representing ATAC-seq signal intensity for regions affected or not affected by DRReRNA (DRRsiRNA) or SMC3siRNA in C2C12 cells differentiated for 16 hr. (C) Averaged ATAC-seq signal densities for DRRsiRNA affected peaks in control, DRReRNA (DRRsiRNA), or SMC3siRNA-transfected C2C12 cells differentiated for 16 hr. Signals were centered at the ATAC-seq peaks summit. (D) Heatmaps representing ATAC-seq signal intensity for regions affected by DRReRNA (DRRsiRNA) or SMC3siRNA in C2C12 cells differentiated for 16 hr. (E) Venn diagrams illustrating overlap of Myogenin-occupied and DRReRNA-affected genes (P = 1.442E-27, against the average overlap of 1000 randomly sampled mm9 gene sets of the same sizes). (F) Venn diagrams illustrating overlap of Myogenin-occupied and SMC3-affected genes (P = 1.086E-27). (G) ATAC-seq tracks at the Myogenin locus in C2C12 myoblasts (MB), C2C12 cell transfected with control, DRReRNA (DRRsiRNA), or SMC3siRNA and differentiated for 16 hr (MT). (H) ATAC-seq tracks at the MyoD locus in C2C12 myoblasts (MB), C2C12 cell transfected with control, DRReRNA (DRRsiRNA), or SMC3siRNA and differentiated for 16hr (MT).

Comment in

Similar articles

Cited by

References

    1. Alvarez-Dominguez JR, Knoll M, Gromatzky AA, Lodish HF. The Super-Enhancer-Derived alncRNA-EC7/Bloodlinc Potentiates Red Blood Cell Development in trans. Cell reports. 2017;19:2503–2514. - PMC - PubMed
    1. Amano T, Sagai T, Tanabe H, Mizushina Y, Nakazawa H, Shiroishi T. Chromosomal dynamics at the Shh locus: limb bud-specific differential regulation of competence and active transcription. Developmental cell. 2009;16:47–57. - PubMed
    1. Asakura A, Lyons GE, Tapscott SJ. The regulation of MyoD gene expression: conserved elements mediate expression in embryonic axial muscle. Dev Biol. 1995;171:386–398. - PubMed
    1. Austenaa LM, Barozzi I, Simonatto M, Masella S, Della Chiara G, Ghisletti S, Curina A, de Wit E, Bouwman BA, de Pretis S, et al. Transcription of Mammalian cis-Regulatory Elements Is Restrained by Actively Enforced Early Termination. Molecular cell. 2015;60:460–474. - PubMed
    1. Banani SF, Lee HO, Hyman AA, Rosen MK. Biomolecular condensates: organizers of cellular biochemistry. Nat Rev Mol Cell Biol. 2017;18:285–298. - PMC - PubMed

Publication types

MeSH terms