

The Therapeutic Effects of Adipose-Derived Stem Cells and Recombinant Peptide Pieces on Mouse Model of DSS Colitis
- PMID: 29978718
- PMCID: PMC6168991
- DOI: 10.1177/0963689718782442
The Therapeutic Effects of Adipose-Derived Stem Cells and Recombinant Peptide Pieces on Mouse Model of DSS Colitis
Abstract
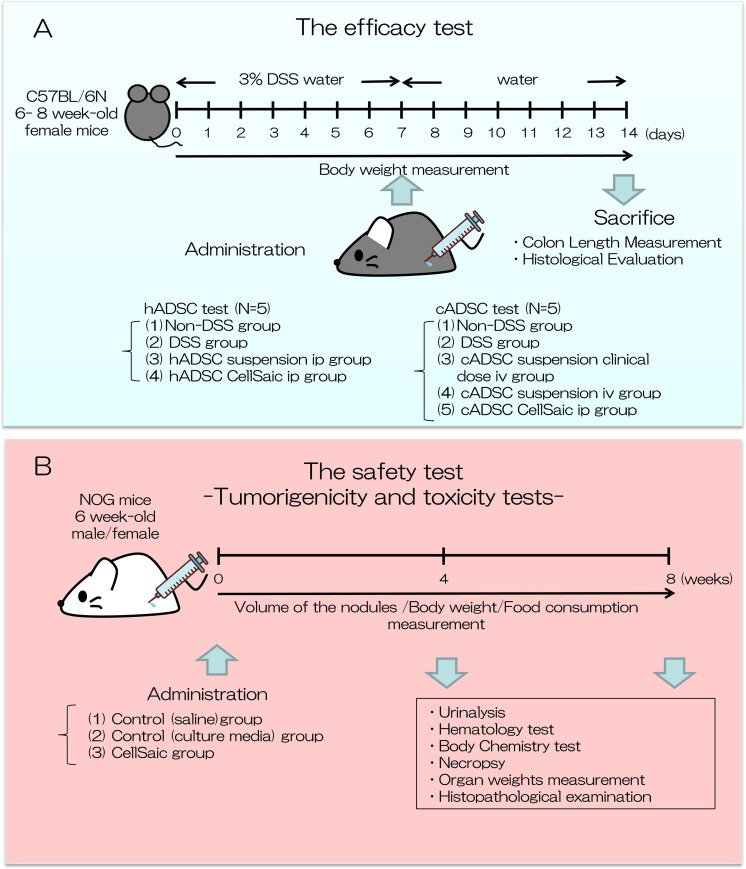
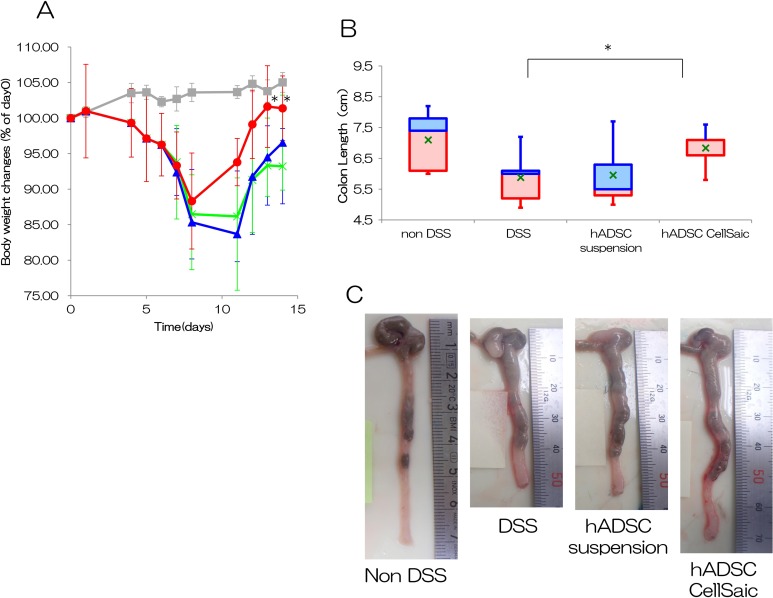
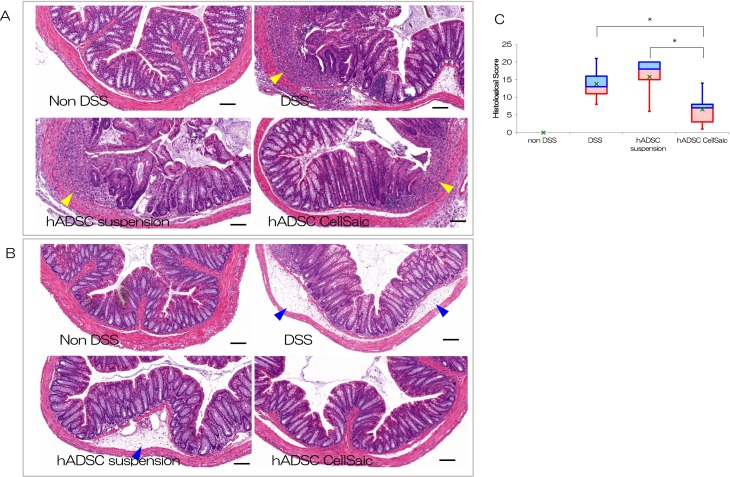
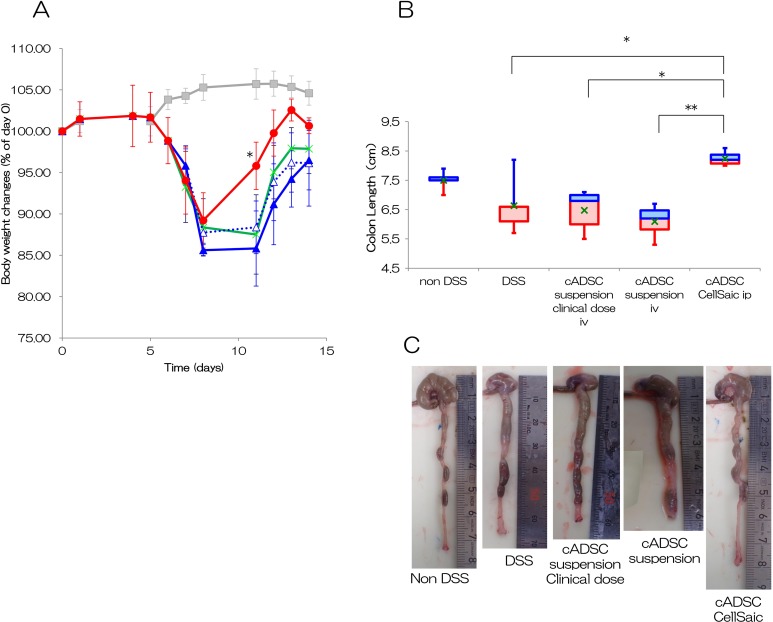
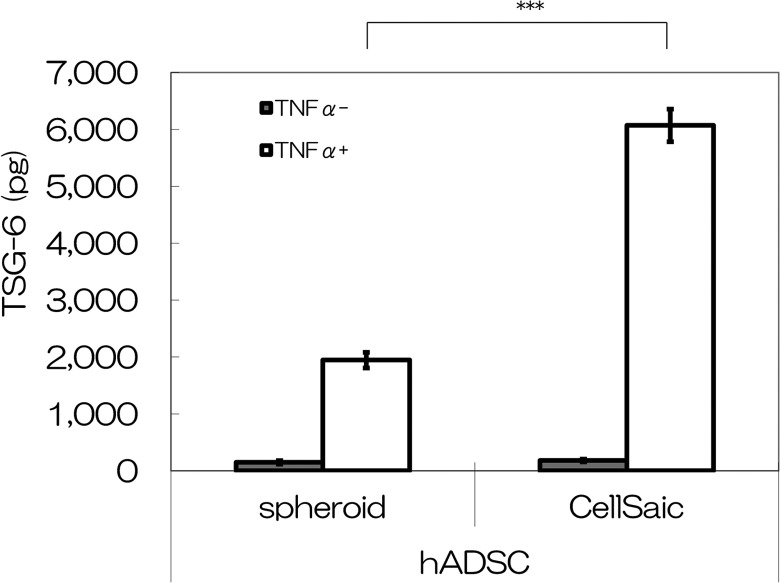
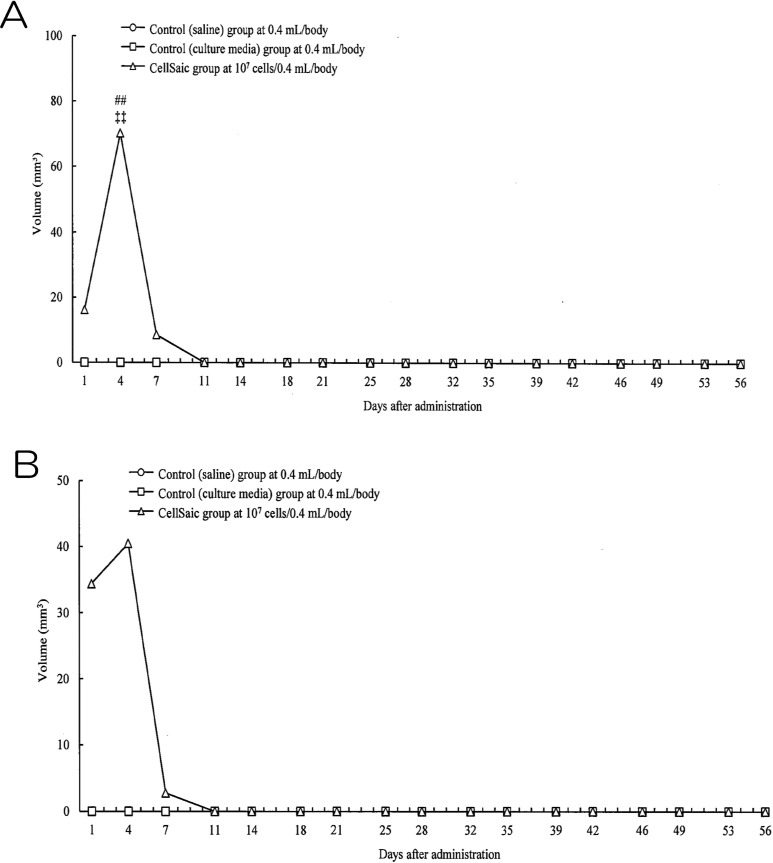
Cell therapies using adipose-derived stem cells (ADSCs) have been used to treat inflammatory bowel disease (IBD) in human and dog. We previously reported the CellSaic technique, which uses a recombinant scaffold to enhance the efficacy of cell therapy. To examine whether this technique can be applied to cell therapy for colitis, we evaluated the efficacy of CellSaic in colitis mouse models. Colitis mouse models were developed by administering dextran sulfate sodium (DSS) to C57BL/6 mice for 7 days. Then CellSaic comprising human/canine ADSCs (1.2 × 10⁶ cells) or human/canine ADSCs only (1.2 × 10⁶ cells) were administered to the mice. The body weights were measured, and the colon length measurements and histological evaluations were conducted at 7 days after administration. After in vitro culture of human ADSC (hADSC) CellSaic and hADSC spheroids in medium containing TNFα, the levels of the anti-inflammatory protein TSG-6 in each supernatant were measured. Furthermore, we conducted tumorigenicity and general toxicity tests of canine ADSC (cADSC) CellSaic in NOG mice for 8 weeks. In the colitis mouse models, the ADSC CellSaic group presented recovery of body weight and colon length compared with the ADSC-only group. Histological analysis showed that ADSC CellSaic decreased the number of inflammatory cells and repaired ulceration. In vitro, hADSC CellSaic secreted 3.1-fold more TSG-6 than the hADSCs. In addition, tumorigenicity and general toxicity of cADSC CellSaic were not observed. This study suggests that human and canine ADSC CellSaic has a therapeutic effect of colitis in human and dogs.
Keywords: adipose-derived stem cells; dextran sulfate sodium-induced colitis mouse; inflammatory bowel disease; veterinary therapy.
Conflict of interest statement
Figures
Similar articles
-
Combined treatment with Rg1 and adipose-derived stem cells alleviates DSS-induced colitis in a mouse model.Stem Cell Res Ther. 2022 Jun 21;13(1):272. doi: 10.1186/s13287-022-02940-x. Stem Cell Res Ther. 2022. PMID: 35729638 Free PMC article.
-
Early injection of human adipose tissue-derived mesenchymal stem cell after inflammation ameliorates dextran sulfate sodium-induced colitis in mice through the induction of M2 macrophages and regulatory T cells.Cell Tissue Res. 2019 May;376(2):257-271. doi: 10.1007/s00441-018-02981-w. Epub 2019 Jan 11. Cell Tissue Res. 2019. PMID: 30635774
-
New cell delivery system CellSaic with adipose-derived stromal cells promotes functional angiogenesis in critical limb ischemia model mice.J Artif Organs. 2021 Sep;24(3):343-350. doi: 10.1007/s10047-021-01254-8. Epub 2021 Mar 3. J Artif Organs. 2021. PMID: 33656644 Free PMC article.
-
CellSaic, A Cell Aggregate-Like Technology Using Recombinant Peptide Pieces for MSC Transplantation.Curr Stem Cell Res Ther. 2019;14(1):52-56. doi: 10.2174/1574888X13666180912125157. Curr Stem Cell Res Ther. 2019. PMID: 30207243 Free PMC article. Review.
-
ADSC-Based Cell Therapies for Musculoskeletal Disorders: A Review of Recent Clinical Trials.Int J Mol Sci. 2021 Sep 30;22(19):10586. doi: 10.3390/ijms221910586. Int J Mol Sci. 2021. PMID: 34638927 Free PMC article. Review.
Cited by
-
Factors Defining Human Adipose Stem/Stromal Cell Immunomodulation in Vitro.Stem Cell Rev Rep. 2024 Jan;20(1):175-205. doi: 10.1007/s12015-023-10654-7. Epub 2023 Nov 14. Stem Cell Rev Rep. 2024. PMID: 37962697 Free PMC article. Review.
-
Genetically Modified Cell Transplantation Through Macroencapsulated Spheroids with Scaffolds to Treat Fabry Disease.Cell Transplant. 2021 Jan-Dec;30:9636897211060269. doi: 10.1177/09636897211060269. Cell Transplant. 2021. PMID: 34931534 Free PMC article.
-
Evaluation of Osteogenic Potential for Rat Adipose-Derived Stem Cells under Xeno-Free Environment.Int J Mol Sci. 2023 Dec 15;24(24):17532. doi: 10.3390/ijms242417532. Int J Mol Sci. 2023. PMID: 38139360 Free PMC article.
-
Co-Microencapsulation of Islets and MSC CellSaics, Mosaic-Like Aggregates of MSCs and Recombinant Peptide Pieces, and Therapeutic Effects of Their Subcutaneous Transplantation on Diabetes.Biomedicines. 2020 Aug 31;8(9):318. doi: 10.3390/biomedicines8090318. Biomedicines. 2020. PMID: 32878198 Free PMC article.
-
A New Islet Transplantation Method Combining Mesenchymal Stem Cells with Recombinant Peptide Pieces, Microencapsulated Islets, and Mesh Bags.Biomedicines. 2020 Aug 21;8(9):299. doi: 10.3390/biomedicines8090299. Biomedicines. 2020. PMID: 32825661 Free PMC article.
References
-
- West F, Stice S. Progress toward generating informative porcine biomedical models using induced pluripotent stem cells. Ann N Y Acad Sci. 2011;1245:21–23. - PubMed
-
- One Health Initiative [Internet] 2012. [cited 2012 Dec 12] http://www.onehealthinitiative.com/ (accessed on July 7, 2018).
-
- Nobert KM. The regulation of veterinary regenerative medicine and the potential impact of such regulation on clinicians and firms commercializing these treatments. Vet Clin North Am Equine Pract. 2011;27(2):383–391. - PubMed
MeSH terms
Substances
LinkOut - more resources
Full Text Sources
Other Literature Sources
Miscellaneous
