

Association of Prenatal Exposure to Population-Wide Folic Acid Fortification With Altered Cerebral Cortex Maturation in Youths
- PMID: 29971329
- PMCID: PMC6142921
- DOI: 10.1001/jamapsychiatry.2018.1381
Association of Prenatal Exposure to Population-Wide Folic Acid Fortification With Altered Cerebral Cortex Maturation in Youths
Abstract
Importance: Presently, 81 countries mandate the fortification of grain products with folic acid to lessen the risk of neural tube defects in the developing fetus. Epidemiologic data on severe mental illness suggest potentially broader effects of prenatal folate exposure on postnatal brain development, but this link remains unsubstantiated by biological evidence.
Objective: To evaluate associations among fetal folic acid exposure, cortical maturation, and psychiatric risk in youths.
Design, setting, and participants: A retrospective, observational clinical cohort study was conducted at Massachusetts General Hospital (MGH) among 292 youths 8 to 18 years of age born between January 1993 and December 2001 (inclusive of folic acid fortification rollout ±3.5 years) with normative results of clinical magnetic resonance imaging, divided into 3 age-matched groups based on birthdate and related level of prenatal folic acid fortification exposure (none, partial, or full). Magnetic resonance imaging was performed between January 2005 and March 2015. Two independent, observational, community-based cohorts (Philadelphia Neurodevelopmental Cohort [PNC] and National Institutes of Health Magnetic Resonance Imaging Study of Normal Brain Development [NIH]) comprising 1078 youths 8 to 18 years of age born throughout (PNC, 1992-2003) or before (NIH, 1983-1995) the rollout of folic acid fortification were studied for replication, clinical extension, and specificity. Statistical analysis was conducted from 2015 to 2018.
Exposures: United States-mandated grain product fortification with folic acid, introduced in late 1996 and fully in effect by mid-1997.
Main outcomes and measures: Differences in cortical thickness among nonexposed, partially exposed, and fully exposed youths (MGH) and underlying associations between age and cortical thickness (all cohorts). Analysis of the PNC cohort also examined the association of age-cortical thickness slopes with the odds of psychotic symptoms.
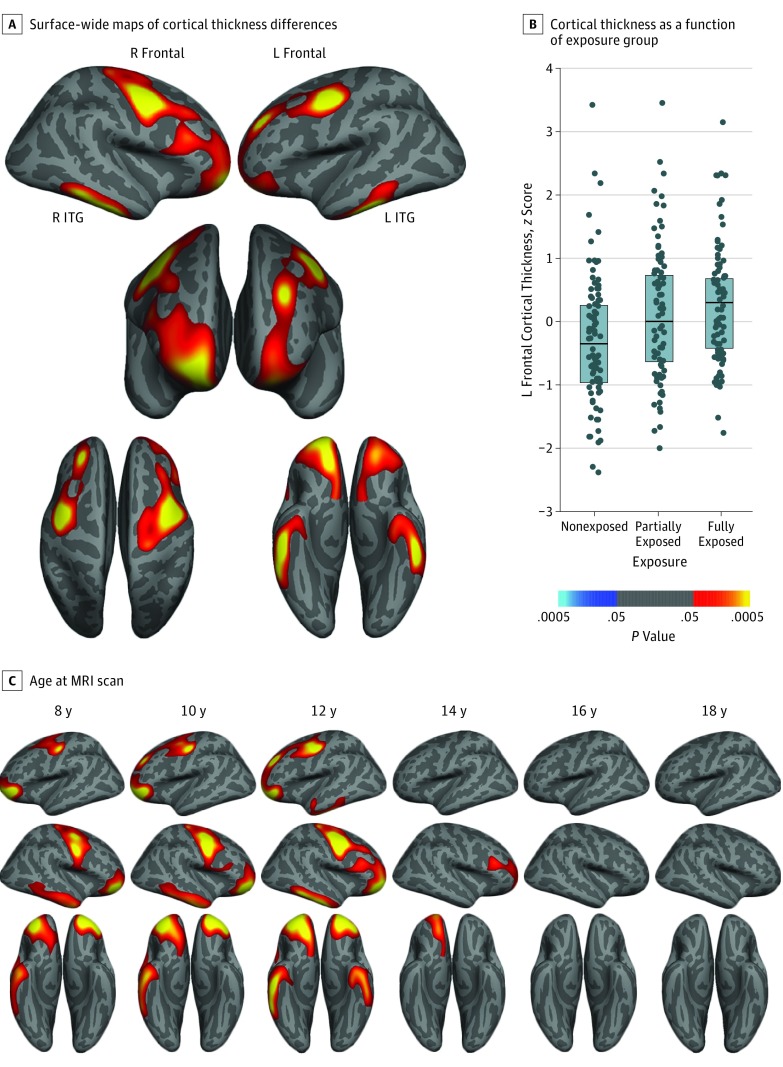
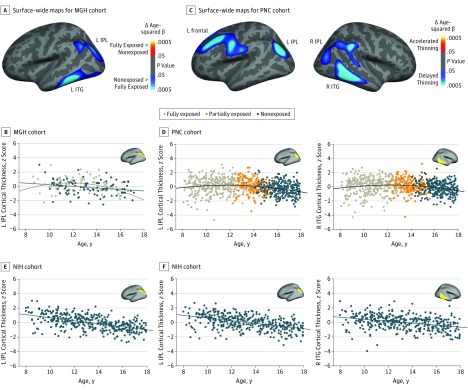
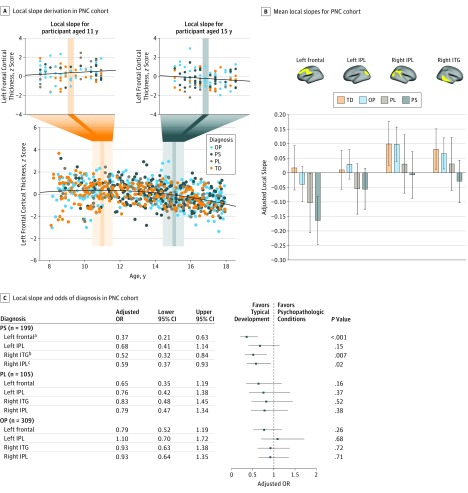
Results: The MGH cohort (139 girls and 153 boys; mean [SD] age, 13.3 [2.3] years) demonstrated exposure-associated cortical thickness increases in bilateral frontal and temporal regions (9.9% to 11.6%; corrected P < .001 to P = .03) and emergence of quadratic (delayed) age-associated thinning in temporal and parietal regions (β = -11.1 to -13.9; corrected P = .002). The contemporaneous PNC cohort (417 girls and 444 boys; mean [SD] age, 13.5 [2.7] years) also exhibited exposure-associated delays of cortical thinning (β = -1.59 to -1.73; corrected P < .001 to P = .02), located in similar regions and with similar durations of delay as in the MGH cohort. Flatter thinning profiles in frontal, temporal, and parietal regions were associated with lower odds of psychosis spectrum symptoms in the PNC cohort (odds ratio, 0.37-0.59; corrected P < .05). All identified regions displayed earlier thinning in the nonexposed NIH cohort (118 girls and 99 boys; mean [SD] age, 13.3 [2.6] years).
Conclusions and relevance: The results of this study suggest an association between gestational exposure to fortification of grain products with folic acid and altered cortical development and, in turn, with reduction in the risk of psychosis in youths.
Conflict of interest statement
Figures
Comment in
-
Investigating the Role of Micronutrients in Brain Development and Psychiatric Disorders via Magnetic Resonance Imaging.JAMA Psychiatry. 2018 Sep 1;75(9):880-882. doi: 10.1001/jamapsychiatry.2018.1255. JAMA Psychiatry. 2018. PMID: 29971319 No abstract available.
Similar articles
-
The effect of folate fortification of cereal-grain products on blood folate status, dietary folate intake, and dietary folate sources among adult non-supplement users in the United States.J Am Coll Nutr. 2005 Aug;24(4):266-74. doi: 10.1080/07315724.2005.10719474. J Am Coll Nutr. 2005. PMID: 16093404
-
Survival of infants with neural tube defects in the presence of folic acid fortification.Pediatrics. 2006 Mar;117(3):803-13. doi: 10.1542/peds.2005-1364. Pediatrics. 2006. PMID: 16510661
-
Folic acid: are current fortification levels adequate?Nutrition. 2001 Oct;17(10):868-72. doi: 10.1016/s0899-9007(01)00648-7. Nutrition. 2001. PMID: 11684394 Review.
-
Impact of folic acid fortification of the US food supply on the occurrence of neural tube defects.JAMA. 2001 Jun 20;285(23):2981-6. doi: 10.1001/jama.285.23.2981. JAMA. 2001. PMID: 11410096
-
Folic Acid Supplementation for the Prevention of Neural Tube Defects: An Updated Evidence Report and Systematic Review for the US Preventive Services Task Force.JAMA. 2017 Jan 10;317(2):190-203. doi: 10.1001/jama.2016.19193. JAMA. 2017. PMID: 28097361 Review.
Cited by
-
Lost in Translation: Challenges in the Diagnosis and Treatment of Early-Onset Schizophrenia.Cureus. 2023 May 25;15(5):e39488. doi: 10.7759/cureus.39488. eCollection 2023 May. Cureus. 2023. PMID: 37362509 Free PMC article. Review.
-
Prevention and early intervention in youth mental health: is it time for a multidisciplinary and trans-diagnostic model for care?Int J Ment Health Syst. 2020 Mar 24;14:23. doi: 10.1186/s13033-020-00356-9. eCollection 2020. Int J Ment Health Syst. 2020. PMID: 32226481 Free PMC article. Review.
-
Risk of Excess Maternal Folic Acid Supplementation in Offspring.Nutrients. 2024 Mar 6;16(5):755. doi: 10.3390/nu16050755. Nutrients. 2024. PMID: 38474883 Free PMC article. Review.
-
Acute high folic acid treatment in SH-SY5Y cells with and without MTHFR function leads to gene expression changes in epigenetic modifying enzymes, changes in epigenetic marks, and changes in dendritic spine densities.PLoS One. 2021 Jan 7;16(1):e0245005. doi: 10.1371/journal.pone.0245005. eCollection 2021. PLoS One. 2021. PMID: 33411826 Free PMC article.
-
Developmental Windows for Effects of Choline and Folate on Excitatory and Inhibitory Neurotransmission During Human Gestation.Dev Psychobiol. 2024 Feb;66(2):e22453. doi: 10.1002/dev.22453. Epub 2024 Jan 9. Dev Psychobiol. 2024. PMID: 38646069 Free PMC article.
References
-
- US Food and Drug Administration Food standards: amendment of standards of identity for enriched grain products to require addition of folic acid. Fed Regist 1996;61:8781-8797. https://www.federalregister.gov/documents/1996/03/05/96-5014/food-standa.... Published March 5, 1996. Accessed November 21, 2016.
-
- Czeizel AE. Folic acid in the prevention of neural tube defects. J Pediatr Gastroenterol Nutr. 1995;20(1):4-16. - PubMed
-
- Canfield MA, Collins JS, Botto LD, et al. ; National Birth Defects Prevention Network . Changes in the birth prevalence of selected birth defects after grain fortification with folic acid in the United States: findings from a multi-state population-based study. Birth Defects Res A Clin Mol Teratol. 2005;73(10):679-689. - PubMed
-
- Susser E, St Clair D. Prenatal famine and adult mental illness: interpreting concordant and discordant results from the Dutch and Chinese Famines. Soc Sci Med. 2013;97:325-330. - PubMed
Publication types
MeSH terms
Substances
Grants and funding
LinkOut - more resources
Full Text Sources
Other Literature Sources
Medical
