. 2018 Jul 3;19(7):1946.
doi: 10.3390/ijms19071946.

Red (635 nm), Near-Infrared (808 nm) and Violet-Blue (405 nm) Photobiomodulation Potentiality on Human Osteoblasts and Mesenchymal Stromal Cells: A Morphological and Molecular In Vitro Study

Affiliations

Red (635 nm), Near-Infrared (808 nm) and Violet-Blue (405 nm) Photobiomodulation Potentiality on Human Osteoblasts and Mesenchymal Stromal Cells: A Morphological and Molecular In Vitro Study

Alessia Tani et al. Int J Mol Sci. .

Abstract

Photobiomodulation (PBM) has been used for bone regenerative purposes in different fields of medicine and dentistry, but contradictory results demand a skeptical look for its potential benefits. This in vitro study compared PBM potentiality by red (635 ± 5 nm) or near-infrared (NIR, 808 ± 10 nm) diode lasers and violet-blue (405 ± 5 nm) light-emitting diode operating in a continuous wave with a 0.4 J/cm² energy density, on human osteoblast and mesenchymal stromal cell (hMSC) viability, proliferation, adhesion and osteogenic differentiation. PBM treatments did not alter viability (PI/Syto16 and MTS assays). Confocal immunofluorescence and RT-PCR analyses indicated that red PBM (i) on both cell types increased vinculin-rich clusters, osteogenic markers expression (Runx-2, alkaline phosphatase, osteopontin) and mineralized bone-like nodule structure deposition and (ii) on hMSCs induced stress fiber formation and upregulated the expression of proliferation marker Ki67. Interestingly, osteoblast responses to red light were mediated by Akt signaling activation, which seems to positively modulate reactive oxygen species levels. Violet-blue light-irradiated cells behaved essentially as untreated ones and NIR irradiated ones displayed modifications of cytoskeleton assembly, Runx-2 expression and mineralization pattern. Although within the limitations of an in vitro experimentation, this study may suggest PBM with 635 nm laser as potential effective option for promoting/improving bone regeneration.

Keywords: Akt signaling; Runx-2; bone regeneration; diode laser; light emitting diode (LED); low level laser therapy (LLLT); mesenchymal stromal cells; osteoblasts; ostepontin; photobiomodulation (PBM).


Conflict of interest statement

The authors declare no conflict of interest.

Figures

Figure 1
Figure 1
Effects of red (635 nm), NIR (808 nm) and violet-blue (405 nm) PBM on osteoblast and hMSC viability. Osteoblasts and hMSCs subjected or not (control) to PBM treatments with 635 nm, 808 nm or 405 nm as reported in Table 1, were cultured for 24 h in their specific PM and then assessed for cell viability. (A,C) PI/Syto16 test. Histograms show the morphometric analysis of percentage of Syto16 positive viable (A) osteoblasts and (C) hMSCs. (B,D) MTS assay. Absorbance (492 nm) of soluble formazan resulting from the reduction of tetrazolium by mitochondrial enzymes of viable (B) osteoblasts and (D) hMSCs, measured using a multi-well scanning spectrophotometer.
Figure 2
Figure 2
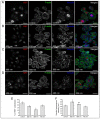
Effects of red (635 nm), NIR (808 nm) and violet-blue (405 nm) on osteoblast proliferation and cytoskeleton assembly. Osteoblasts subjected or not (control) to PBM with 635 nm, 808 nm or 405 nm as reported in Table 1, were cultured for 24 h in PM. (AD) Representative confocal fluorescence images of fixed cells in the indicated experimental conditions, immunostained with antibodies against the proliferation marker Ki67 (red) and against the focal adhesion protein vinculin (cyan) and stained with Alexa 488-conjugated phalloidin to reveal F-actin (green). Scale bar: 50 µm (E). Quantitative analysis of Ki67 positive osteoblast nuclei expressed as percentage of the total nuclei number. (F) Histogram showing the densitometric analysis of the intensity of vinculin fluorescence signal performed on digitized images. The data are representative of at least three independent experiments, performed in triplicate. The values are expressed as mean ± S.E.M. Significance of difference: * p < 0.05 vs. control, ° p < 0.05 vs. 635 nm.
Figure 3
Figure 3
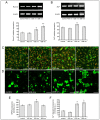
Effects of red (635 nm), NIR (808 nm) and violet-blue (405 nm) PBM on osteoblast differentiation. Osteoblasts subjected or not (control) to PBM treatments with 635 nm, 808 nm or 405 nm as reported in Table 1, were cultured for 7 and 18 days in osteogenic DM. (A,B) RT-PCR analysis of (A) Runx-2 and (B) ALP expression in the cells cultured for 7 days in DM in the indicated experimental conditions. Representative agarose gels are shown. The densitometric analyses of the bands normalized to β-actin are reported in the histograms. (C,D) Representative confocal fluorescence images of cells cultured in DM in the indicated experimental conditions. In (C) the cells were cultured for 7 days, fixed and immunostained with antibodies against osteopontin (OPN, green) and stained with PI (red) to reveal nuclei. In (D) the cells were cultured for 18 days, fixed and stained with the fluorescent Osteolmage™ staining reagent (green) binding the hydroxyapatite portion of the bone like nodule structures deposited by cells (Ca2+ deposits). Scale bar: 50 µm. (E,F) Histograms showing the densitometric analyses of the intensity of (E) OPN and (F) Ca2+ deposits fluorescence signals performed on digitized images. The data are representative of at least three independent experiments, performed in triplicate. The values are expressed as mean ± S.E.M. Significance of difference: * p < 0.05 vs. control, ° p < 0.05 vs. 635 nm.
Figure 4
Figure 4
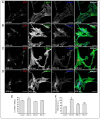
Effects of red (635 nm), NIR (808 nm) and violet-blue (405 nm) PBM on hMSC proliferation and cytoskeleton assembly. hMSCs subjected or not (control) to PBM treatments with 635 nm, 808 nm or 405 nm as reported in Table 1, were cultured for 24 h in PM. (AD) Representative confocal fluorescence images of fixed cells in the indicated experimental conditions, immunostained with antibodies against the proliferation marker Ki67 (red) and against the focal adhesion protein vinculin (cyan) and stained with Alexa 488-conjugated phalloidin to reveal F-actin (green). Scale bar: 50 µm. (E) Quantitative analysis of Ki67 positive hMSC nuclei expressed as percentage of the total nuclei number. (F) Histogram showing the densitometric analysis of the intensity of vinculin fluorescence signal performed on digitized images. The data are representative of at least three independent experiments, performed in triplicate. The values are expressed as mean ± S.E.M. Significance of difference: * p < 0.05 vs. control, ° p < 0.05 vs. 635 nm.
Figure 5
Figure 5
Effects of red, NIR and violet-blue on hMSC osteogenic differentiation. hMSCs subjected or not (control) to PBM treatments with 635 nm, 808 nm or 405 nm as reported in Table 1, were cultured for 7 and 18 days in osteogenic DM. (AC) RT-PCR analyses of Runx-2 and ALP expression in the cells cultured for 7 days in DM in the indicated experimental conditions. (A) Representative agarose gels are shown. (B,C) Histograms showing the densitometric analyses of the (B) Runx-2 and (C) ALP bands normalized to β-actin. (D) Representative confocal fluorescence images of cells cultured in DM in the indicated experimental conditions for 18 days, fixed and stained with the fluorescent Osteolmage™ staining reagent (green) binding the hydroxyapatite portion of the bone-like nodule structures deposited by cells (Ca2+ deposits). Scale bar: 50 µm. (E) Histogram showing the densitometric analysis of the intensity of Ca2+ deposits fluorescence signal performed on digitized images. The data are representative of at least three independent experiments, performed in triplicate. The values are expressed as mean ± S.E.M. Significance of difference: * p < 0.05 vs. control, ° p < 0.05 vs. 635 nm.
Figure 6
Figure 6
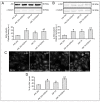
Effects of red PBM on osteoblast Akt expression and activation. Osteoblasts subjected or not to PBM with 635 nm as reported in Table 1, were cultured for 24 h in PM or for 7 days (d) in osteogenic DM. (A,B) Western blotting analyses of (A) Akt and (B) the activated phosphorylated form of Akt, p-Akt, expression. The densitometric analyses of the bands normalized to α-tubulin are reported in the histograms. (C) Representative confocal immunofluorescence images of fixed cells immunostained with antibodies against p-Akt. Scale bar: 50 µm. (D) Quantitative analysis of p-Akt positive osteoblast nuclei expressed as percentage of the total nuclei number. The data are representative of at least three independent experiments, performed in triplicate. The values are expressed as mean ± S.E.M. Significance of difference: * p < 0.05 vs. PM 24 h, ° p < 0.05 vs. DM 7 days.
Figure 7
Figure 7
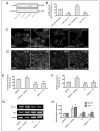
Assessment of Akt signaling involvement in osteoblast responses induced by red PBM. Osteoblasts subjected or not to PBM with 635 nm as reported in Table 1, were cultured for 24 h in PM or for 7 days (d) in osteogenic DM in the absence (DMSO) or presence of the Akt inhibitor, triciribine (2 µM, T2). (A) Western blotting analysis of p-Akt expression. (B) Histogram showing the densitometric analysis of the bands normalized to α-tubulin. (C,D) Representative confocal immunofluorescence images of cells cultured in the indicated experimental conditions. In (C) the cells were cultured in PM for 24 h, fixed immunostained with antibodies against vinculin; in (D) the cells were cultured in DM for 7 days, fixed and stained with antibodies against osteopontin OPN. Scale bar: 50 µm. (E,F) Histograms showing the densitometric analyses of the intensity of (E) vinculin and (F) OPN fluorescence signals performed on digitized images. (G) RT-PCR analyses of Runx-2 and ALP expression in the cells cultured for 7 days in DM in the indicated experimental conditions. Representative agarose gels are shown. (H) Histograms showing the densitometric analyses of Runx-2 and ALP bands normalized to β-actin. The data are representative of at least three independent experiments, performed in triplicate. The values are expressed as mean ± S.E.M. Significance of difference: in (B), * p < 0.05 vs. PM 24 h (DMSO), ° p < 0.05 vs. DM 7 days (DMSO); in (E,F,H), * p < 0.05 vs. DMSO, ° p < 0.05 vs. 635 nm + DMSO.
Figure 8
Figure 8
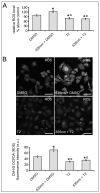
Effect of red PBM and Akt signaling inhibition on ROS production in osteoblasts. ROS generation was measured with CM-H2 DCFDA in osteoblasts cultured in the absence (DMSO) or presence of the Akt inhibitor triciribine (2 µM, T2) subjected or not to PBM with 635 nm as reported in Table 1, 1 h after light delivery. (A) Fluorometric ROS detection. (B) Representative confocal fluorescence images of intracellular ROS. Scale bar: 50 µm. The histogram shows the densitometric analyses of the intensity of CM-H2 DCFDA (ROS) green fluorescence signals performed on digitized images. The data are representative of at least three independent experiments, performed in triplicate. The values are expressed as mean ± S.E.M. Significance of difference: * p < 0.05 vs. DMSO, ° p < 0.05 vs. 635 nm + DMSO.

Similar articles

Cited by

References

    1. Heitz-Mayfield L.J. Peri-implant diseases: Diagnosis and risk indicators. J. Clin. Periodontol. 2008;35:292–304. doi: 10.1111/j.1600-051X.2008.01275.x. - DOI - PubMed
    1. Kaur G., Grover V., Bhaskar N., Kaur R.K., Jain A. Periodontal Infectogenomics. Inflamm. Regen. 2018;38:8. doi: 10.1186/s41232-018-0065-x. - DOI - PMC - PubMed
    1. Hadjidakis D.J., Androulakis I.I. Bone remodeling. Ann. N. Y. Acad. Sci. 2006;1092:385–396. doi: 10.1196/annals.1365.035. - DOI - PubMed
    1. Liu H., Li D., Zhang Y., Li M. Inflammation, mesenchymal stem cells and bone regeneration. Histochem. Cell Biol. 2018;149:393–404. doi: 10.1007/s00418-018-1643-3. - DOI - PubMed
    1. Knight M.N., Hankenson K.D. Mesenchymal Stem Cells in Bone Regeneration. Adv. Wound Care (New Rochelle) 2013;2:306–316. doi: 10.1089/wound.2012.0420. - DOI - PMC - PubMed

MeSH terms

LinkOut - more resources