. 2018 Jul;25(7):591-600.
doi: 10.1038/s41594-018-0083-z. Epub 2018 Jul 2.

Mechanism of 53BP1 activity regulation by RNA-binding TIRR and a designer protein

Affiliations

Mechanism of 53BP1 activity regulation by RNA-binding TIRR and a designer protein

Maria Victoria Botuyan et al. Nat Struct Mol Biol. 2018 Jul.

Abstract

Dynamic protein interaction networks such as DNA double-strand break (DSB) signaling are modulated by post-translational modifications. The DNA repair factor 53BP1 is a rare example of a protein whose post-translational modification-binding function can be switched on and off. 53BP1 is recruited to DSBs by recognizing histone lysine methylation within chromatin, an activity directly inhibited by the 53BP1-binding protein TIRR. X-ray crystal structures of TIRR and a designer protein bound to 53BP1 now reveal a unique regulatory mechanism in which an intricate binding area centered on an essential TIRR arginine residue blocks the methylated-chromatin-binding surface of 53BP1. A 53BP1 separation-of-function mutation that abolishes TIRR-mediated regulation in cells renders 53BP1 hyperactive in response to DSBs, highlighting the key inhibitory function of TIRR. This 53BP1 inhibition is relieved by TIRR-interacting RNA molecules, providing proof-of-principle of RNA-triggered 53BP1 recruitment to DSBs.


Conflict of interest statement

Competing interests

The authors declare no competing interests.

Figures

Figure 1
Figure 1. TIRR blocks 53BP1 binding to NCP-ubme by masking the histone-binding surface of 53BP1
a, GST pull-down assays of NCP-ubme by GST-53BP1(Tudor-UDR) in the absence and presence of TIRR. GST and GST-53BP1 T1609E/S1618E (TS/EE) mutant, were used as negative controls. IB, immunoblot. H2AK15ub-H2B represents fused histones H2B and H2A ubiquitylated at H2A Lys15. b, Surface and cartoon representation of a TIRR dimer interacting with two 53BP1-Tudor molecules. The model was generated by symmetry from the X-ray structure of TIRR–53BP1. c, Sedimentation-velocity AUC analysis of 53BP1 (residues 1204–1603) at 10 μM without and with addition of 0.1% sodium dodecyl sulfate (SDS). d, Cartoon and stick representation of the TIRR–53BP1 binding interface highlighting the binding loop in TIRR (black dashed circle). 53BP1 residues for which there is a major change in conformation compared to the H4K20me2–53BP1 structure (panel e) are marked with a red star. e, Cartoon and stick representation of the H4K20me2–53BP1 binding interface highlighting the aromatic binding cage in 53BP1 (black dashed circle). f, Overlay of selected 53BP1 side chains in the H4K20me2–53BP1 (gray) and TIRR–53BP1 (yellow) structures highlighting the conformational changes in 53BP1. The side chains of TIRR Arg107 and H4 dimethylated Lys20 are also shown.
Figure 2
Figure 2. TIRR and 53BP1 anchor sites at the TIRR–53BP1 interface
a, Cartoon and stick representation of the TIRR–53BP1 interface centered on TIRR Arg107 in the binding loop. b, Cartoon and stick representation of the TIRR–53BP1 interface centered on TIRR Lys10. c–e, Highlights of the intermolecular interactions of TIRR Arg107, Pro105 and Lys10 with 53BP1. In e, the H4K20me2 binding cage of 53BP1 is shown for comparison.
Figure 3
Figure 3. Structure-based mutations in TIRR and 53BP1 affect complex formation and regulation of 53BP1 DSB recruitment
a, Amino acid sequence alignment of TIRR 53BP1-binding loop (red) with the corresponding region of NUDT16. The red stars indicate 53BP1-binding TIRR residues. b. Top: Co-purification of E. coli-produced TIRR–53BP1 complexes prepared with indicated 53BP1 mutations. 53BP1 was His6-tagged and TIRR untagged. Middle: Co-purification of E. coli-produced TIRR–53BP1 complexes prepared with indicated TIRR mutations. 53BP1 was His6-tagged and TIRR untagged. Bottom: U2OS cells stably expressing Flag- and HA-tagged (FH) wild type TIRR, indicated TIRR mutants and NUDT16, were lysed and analyzed by immunoprecipitation and immunoblotting using Flag and 53BP1 antibodies. c. Quantification of 53BP1 IRIF 90 min after 1 Gy irradiation of RPE1 cells transiently transfected with empty vector, wild type TIRR and indicated TIRR mutants (error bars represent mean ± s.d., n = 2 independent transfections. Representative images are shown. Scale bar = 10 μm. NS (not significant) indicates a P value > 0.05 as determined by 2-tailed Mann-Whitney test.
Figure 4
Figure 4. A separation-of-function 53BP1 mutation leads to a “hyperactive” form of 53BP1
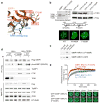
a, Cartoon and stick representation of the TIRR–53BP1 interface centered on 53BP1 Phe1553. Residues mutated in panel b are highlighted with red rectangles. b, Top: Co-purification of E. coli-produced TIRR–53BP1 complexes with wild type (WT) and F1553R 53BP1 mutant. Flag immunoprecipitation using RPE1 cells expressing 53BP1 FFR (WT and mutants). Schematic shows the location of the mutations. Bottom: IRIF of 53BP1 (WT and mutants) were visualized 1 h after irradiation at 5 Gy. Scale bar = 10 μm. c, Immunoblot of WT and mutant 53BP1 in nuclear proteins salt-extracted from HeLa cells. d, Immunoblot of FH-tagged 53BP1 (Flag-53BP1) partner proteins pulled-down from indicated cells. HeLa cells deprived of endogenous TIRR (HeLa TIRRΔ) were stably transduced with FH-53BP1, and in parallel, for the control, HeLa cells were stably transduced with FH-53BP1 and the F1553R 53BP1 mutant. FH-53BP1 partners were purified from total nuclear extracts (nuclear soluble and chromatin extracts) 90 min after a 10 Gy irradiation and analyzed by immunoblotting with indicated antibodies. The star marks a non-specific band. 53BP1 phosphorylated on serine resiudes 25 and 29 is labeled phos53BP1(S25/29). e, Top: FRAP assays of cells expressing GFP-tagged 53BP1-BRCTΔ and 53BP1-BRCTΔ F1553R mutant. Relative fluorescence recovery curves were plotted using the mean of five regions of interest, each in a different nucleus from five different cells derived from three different experiments. (Error bars = s.d.). Bottom: Representative images of the recovery kinetics of GFP-53BP1-BRCTΔ cells. Shown are images before bleaching, immediately after the photobleach event, and later in the time course. The photobleached regions are indicated by white dashed circles.
Figure 5
Figure 5. Assessing the ‘hyperactivity’ of 53BP1 F1553R mutant in multiple contexts
a, Immunoblot analysis of selected 53BP1−/− MEF clones transduced with empty vector (EV), 53BP1-BRCTΔ (WT) or 53BP1-BRCTΔ F1553R. b, Survival assay of siRNA-transfected 53BP1−/− MEFs reconstituted with wild type 53BP1-BRCTΔ and treated with olaparib (mean ± s.d., n = 2 independent experiments.) c, Survival assay of BRCA1 siRNA-transfected 53BP1−/− MEFs reconstituted with the indicated constructs and treated with olaparib (mean ± s.d., n = 2 independent experiments.) The heat map represents the statistical analysis (n = 2 independent experiments, 2-tailed Mann-Whitney test) of the survival of indicated cells with respect to cells expressing 53BP1-BRCTΔ (WT). d, Immunoblot analysis of selected 53BP1-null RPE1 clones transduced with empty vector (EV), 53BP1 (WT) or 53BP1 F1553R. e, Quantification of the number of RAD51 foci in 53BP1- and 53BP1 F1553R-transduced RPE1 cells 6 h after a 2 Gy irradiation (mean ± s.d., n = 2 independent experiments). f, Kinetics of γH2AX foci formation in indicated MEF cell lines after a 2 Gy irradiation (mean ± s.d., n = 2 independent experiments). g, Quantification of chromosome fusions harboring or not a telomeric signal after TRF2ΔBΔM expression in the indicated RPE1-derived clones. n = 10 metaphases scored per clone over two experiments. NS, not significant. Long and short arrows in representative pictures indicate fusions with or without telomeric signal, respectively. Scale bar = 15 μm. h, Class switch recombination (CSR) in stimulated B cells harvested from 53BP1−/− mice and infected with GST- (control) or indicated 53BP1 mutant-expressing retrovirus. Data indicate IgG1-positive events represented as a percentage of IgG1-positive cells in infected B cells (eGFP reporter-positive). n = 2 independent experiments, each performed with 2 mice, error bars represent mean ± s.d. The CSR experiments were done in the context of 53BP1-BRCTΔ.
Figure 6
Figure 6. An engineered RNA- and nucleotide-processing enzyme, NUDT16TI, binds tightly to 53BP1
a, X-ray structure of NUDT16TI–53BP1 complex. b, Sedimentation-velocity AUC analysis of NUDT16TI (Top), and 53BP1 (residues 1204–1603), free and bound to NUDT16TI (Bottom). All proteins were at a concentration of 5 μM. c, ITC of the interactions of NUDT16 and NUTD16TI, wild type and mutants, with 53BP1-Tudor. Corresponding amino acids in TIRR are indicated in blue. The parameter n is the stoichiometry of binding. Kds are reported with s.d. determined by nonlinear least-squares analysis.
Figure 7
Figure 7. Nucleotides and RNA molecules dissociate the NUDT16TI–53BP1 and TIRR–53BP1 complexes
a, Left: Surface representation of NUDT16TI in the NUDT16TI–53BP1 structure. Two bound IMP molecules are positioned based on the X-ray structure of NUDT16–IMP. The side chain of 53BP1 Glu1551 pointing toward IMP is shown in stick representation. Right: ITC of the interaction of NUDT16 and NUTD16TI with IMP, and with 53BP1 in the presence of IMP. The parameter n is the stoichiometry of binding. Kds are reported with s.d. determined by nonlinear least-squares analysis. b, X-ray structure of TIRR–53BP1 highlighting the electrostatic potential surface of TIRR, from −5 kT/e (red) to 5 kT/e (blue). c, X-ray structure of TIRR–53BP1 highlighting the RNA-binding region in TIRR (yellow) identified by protein-RNA photocrosslinking and quantitative mass spectrometry. d, Displacement of TIRR from 53BP1 by RNA molecules. Recombinant Flag-tagged 53BP1 (residues 1220–1631) bound to Anti-Flag agarose beads was first incubated with recombinant TIRR and, after washing the beads, with 200 ng (lanes 3 and 5) or 1 μg (lanes 4 and 6) of nuclear RNAs purified from non-treated (lanes 3 and 4) or 5 Gy-irradiated HeLa cells (lanes 5 and 6). Lane 2 is a control incubation with no RNA. Each incubation mixture had a final volume of 200 μL.

Similar articles

Cited by

References

    1. Botuyan MV, et al. Structural basis for the methylation state-specific recognition of histone H4-K20 by 53BP1 and Crb2 in DNA repair. Cell. 2006;127:1361–1373. - PMC - PubMed
    1. Fradet-Turcotte A, et al. 53BP1 is a reader of the DNA-damage-induced H2A Lys 15 ubiquitin mark. Nature. 2013;499:50–54. - PMC - PubMed
    1. Wilson MD, et al. The structural basis of modified nucleosome recognition by 53BP1. Nature. 2016;536:100–103. - PubMed
    1. Mattiroli F, et al. RNF168 ubiquitinates K13-15 on H2A/H2AX to drive DNA damage signaling. Cell. 2012;150:1182–1195. - PubMed
    1. Gatti M, et al. A novel ubiquitin mark at the N-terminal tail of histone H2As targeted by RNF168 ubiquitin ligase. Cell Cycle. 2012;11:2538–2544. - PMC - PubMed

Publication types

MeSH terms