

The plateau of human mortality: Demography of longevity pioneers
- PMID: 29954979
- PMCID: PMC6457902
- DOI: 10.1126/science.aat3119
The plateau of human mortality: Demography of longevity pioneers
Abstract
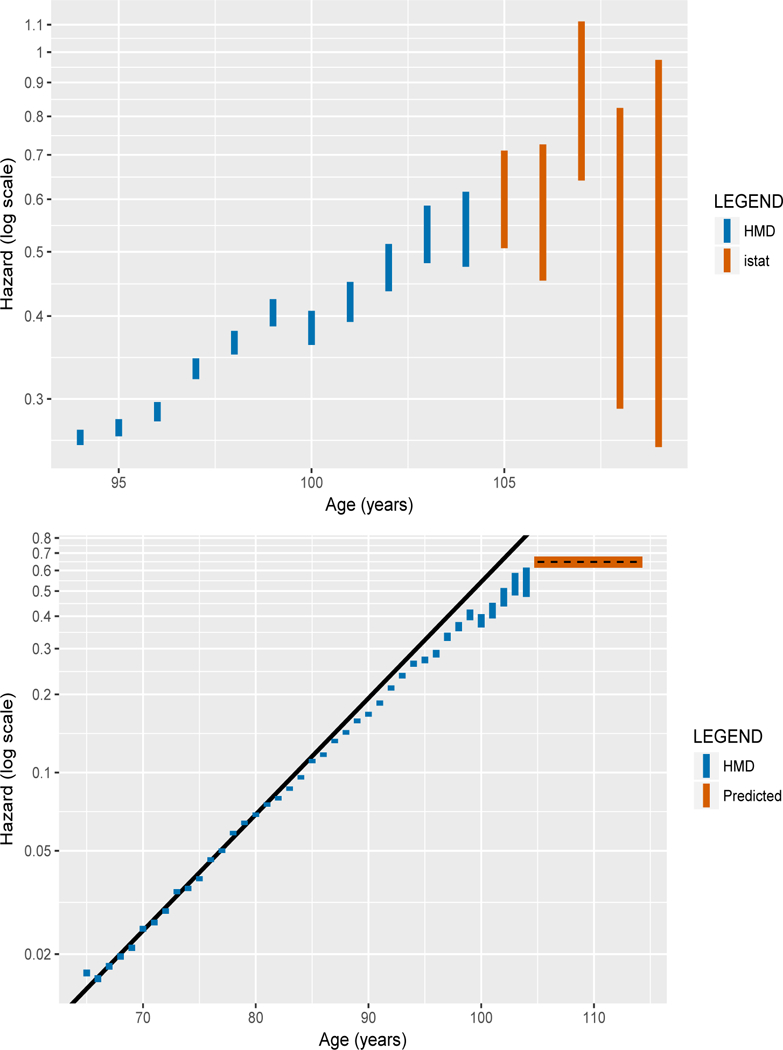
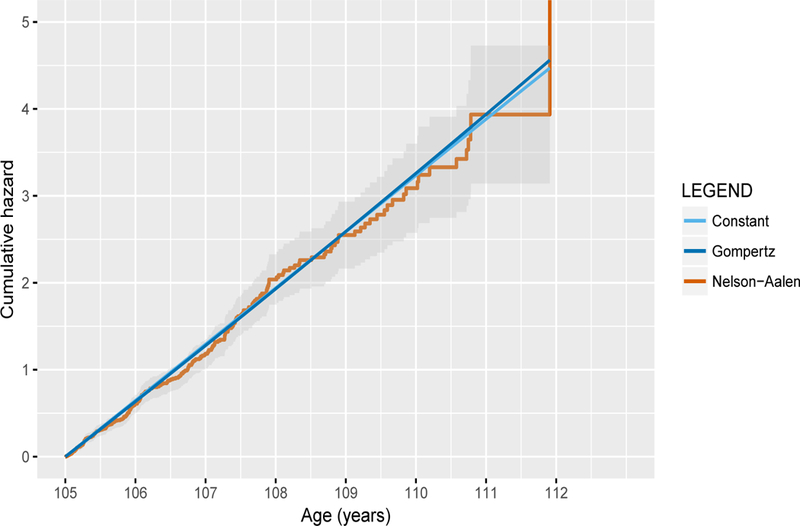
Theories about biological limits to life span and evolutionary shaping of human longevity depend on facts about mortality at extreme ages, but these facts have remained a matter of debate. Do hazard curves typically level out into high plateaus eventually, as seen in other species, or do exponential increases persist? In this study, we estimated hazard rates from data on all inhabitants of Italy aged 105 and older between 2009 and 2015 (born 1896-1910), a total of 3836 documented cases. We observed level hazard curves, which were essentially constant beyond age 105. Our estimates are free from artifacts of aggregation that limited earlier studies and provide the best evidence to date for the existence of extreme-age mortality plateaus in humans.
Copyright © 2018 The Authors, some rights reserved; exclusive licensee American Association for the Advancement of Science. No claim to original U.S. Government Works.
Figures
Comment in
-
There's no limit to longevity, says study that revives human lifespan debate.Nature. 2018 Jul;559(7712):14-15. doi: 10.1038/d41586-018-05582-3. Nature. 2018. PMID: 29968831 No abstract available.
-
Comment on "The plateau of human mortality: Demography of longevity pioneers".Science. 2018 Sep 28;361(6409):eaav1200. doi: 10.1126/science.aav1200. Science. 2018. PMID: 30262471
-
Plane inclinations: A critique of hypothesis and model choice in Barbi et al.PLoS Biol. 2018 Dec 20;16(12):e3000048. doi: 10.1371/journal.pbio.3000048. eCollection 2018 Dec. PLoS Biol. 2018. PMID: 30571678 Free PMC article.
-
Hypothetical errors and plateaus: A response to Newman.PLoS Biol. 2018 Dec 20;16(12):e3000076. doi: 10.1371/journal.pbio.3000076. eCollection 2018 Dec. PLoS Biol. 2018. PMID: 30571682 Free PMC article.
Similar articles
-
Errors as a primary cause of late-life mortality deceleration and plateaus.PLoS Biol. 2018 Dec 20;16(12):e2006776. doi: 10.1371/journal.pbio.2006776. eCollection 2018 Dec. PLoS Biol. 2018. PMID: 30571676 Free PMC article.
-
New Developments in the Biodemography of Aging and Longevity.Gerontology. 2015;61(4):364-71. doi: 10.1159/000369011. Epub 2014 Dec 20. Gerontology. 2015. PMID: 25531147 Free PMC article.
-
Late-life mortality is underestimated because of data errors.PLoS Biol. 2019 Feb 7;17(2):e3000148. doi: 10.1371/journal.pbio.3000148. eCollection 2019 Feb. PLoS Biol. 2019. PMID: 30730879 Free PMC article.
-
How frailty models can be used for evaluating longevity limits: taking advantage of an interdisciplinary approach.Demography. 1997 Feb;34(1):31-48. Demography. 1997. PMID: 9074830 Review.
-
New Trend in Old-Age Mortality: Gompertzialization of Mortality Trajectory.Gerontology. 2019;65(5):451-457. doi: 10.1159/000500141. Epub 2019 May 20. Gerontology. 2019. PMID: 31295741 Free PMC article. Review.
Cited by
-
N-terminal pro B-type natriuretic peptide (NT-proBNP): a possible surrogate of biological age in the elderly people.Geroscience. 2021 Apr;43(2):845-857. doi: 10.1007/s11357-020-00249-2. Epub 2020 Aug 11. Geroscience. 2021. PMID: 32780292 Free PMC article.
-
What Is an Aging-Related Disease? An Epidemiological Perspective.J Gerontol A Biol Sci Med Sci. 2022 Nov 21;77(11):2168-2174. doi: 10.1093/gerona/glac039. J Gerontol A Biol Sci Med Sci. 2022. PMID: 35167685 Free PMC article.
-
How Important Are Genes to Achieve Longevity?Int J Mol Sci. 2022 May 18;23(10):5635. doi: 10.3390/ijms23105635. Int J Mol Sci. 2022. PMID: 35628444 Free PMC article. Review.
-
Calibrating Gompertz in reverse: What is your longevity-risk-adjusted global age?Insur Math Econ. 2020 May;92:147-161. doi: 10.1016/j.insmatheco.2020.03.009. Epub 2020 Apr 11. Insur Math Econ. 2020. PMID: 32834258 Free PMC article.
-
Age-related accumulation of toxic metals in the human locus ceruleus.PLoS One. 2018 Sep 19;13(9):e0203627. doi: 10.1371/journal.pone.0203627. eCollection 2018. PLoS One. 2018. PMID: 30231068 Free PMC article.
References
-
- Horiuchi S, Coale AJ, Age patterns of mortality for older women: an analysis using the age-specific rate of mortality change with age. Math. Pop. Studies 2, 245–267 (1990). - PubMed
-
- Kannisto V, Development of oldest-old mortality, 1950 – 1990: evidence from 28 developed countries. (Odense: University Press, 1994).
-
- Horiuchi S, Wilmoth JR, Deceleration in the age pattern of mortality at older ages. Demography 35, 391–412 (1998). - PubMed
-
- Thatcher AR, Kannisto V, Vaupel JW, The force of mortality at ages 80 to 120. (Odense: University Press, 1998).
Publication types
MeSH terms
Grants and funding
LinkOut - more resources
Full Text Sources
Other Literature Sources
