. 2018;14(8):1335-1346.
doi: 10.1080/15548627.2018.1474994. Epub 2018 Jul 28.

Peritumoral monocytes induce cancer cell autophagy to facilitate the progression of human hepatocellular carcinoma

Affiliations

Peritumoral monocytes induce cancer cell autophagy to facilitate the progression of human hepatocellular carcinoma

Dong-Ping Chen et al. Autophagy. 2018.

Abstract

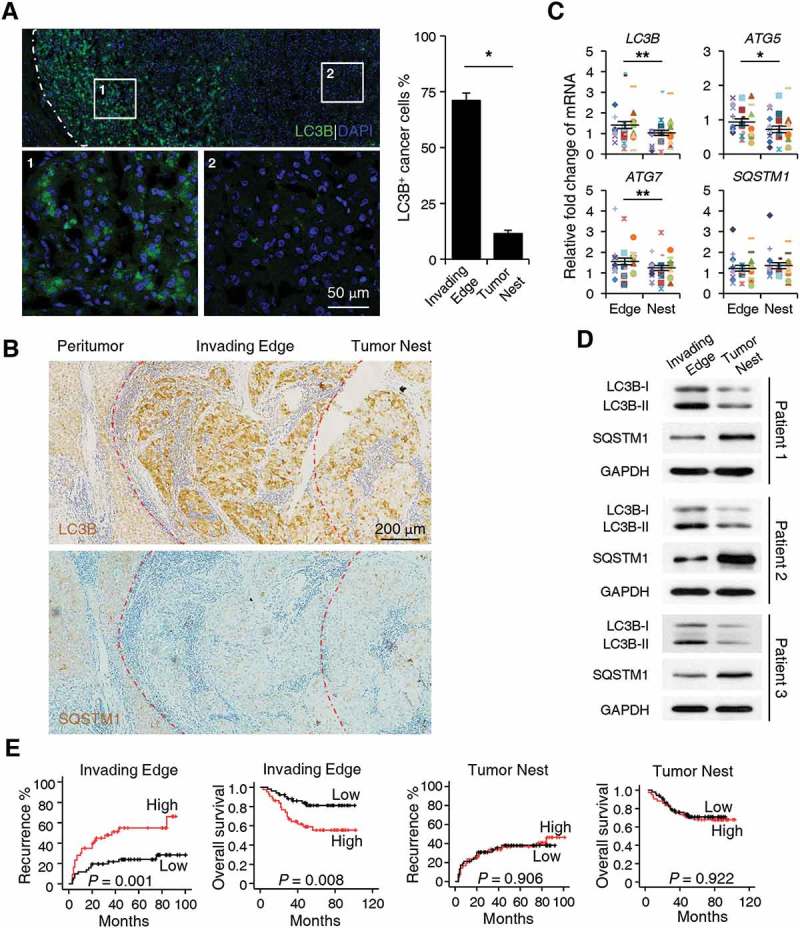
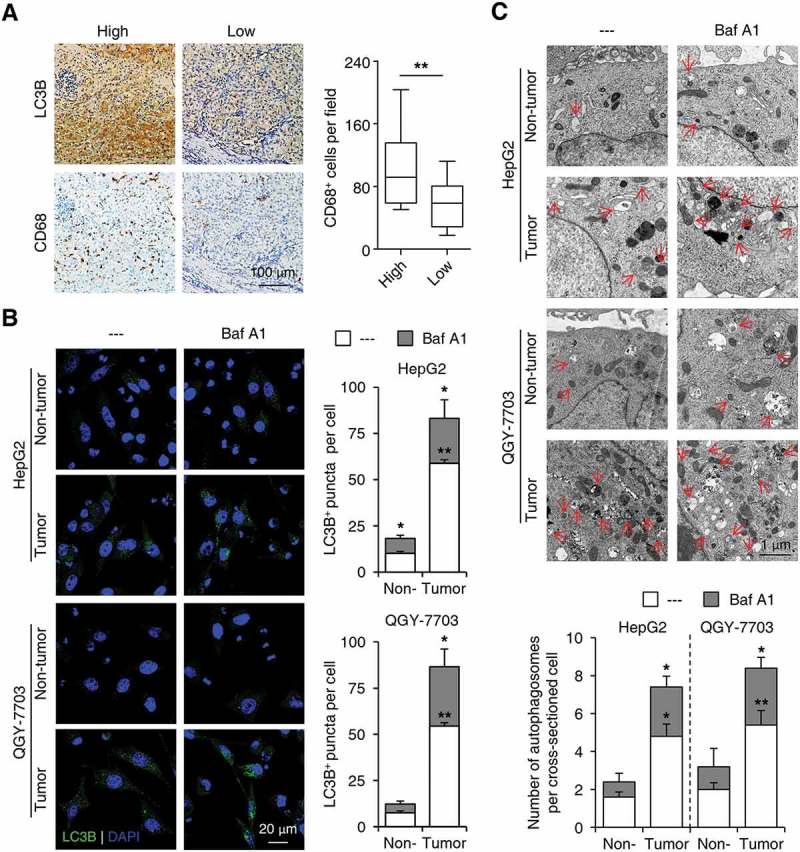
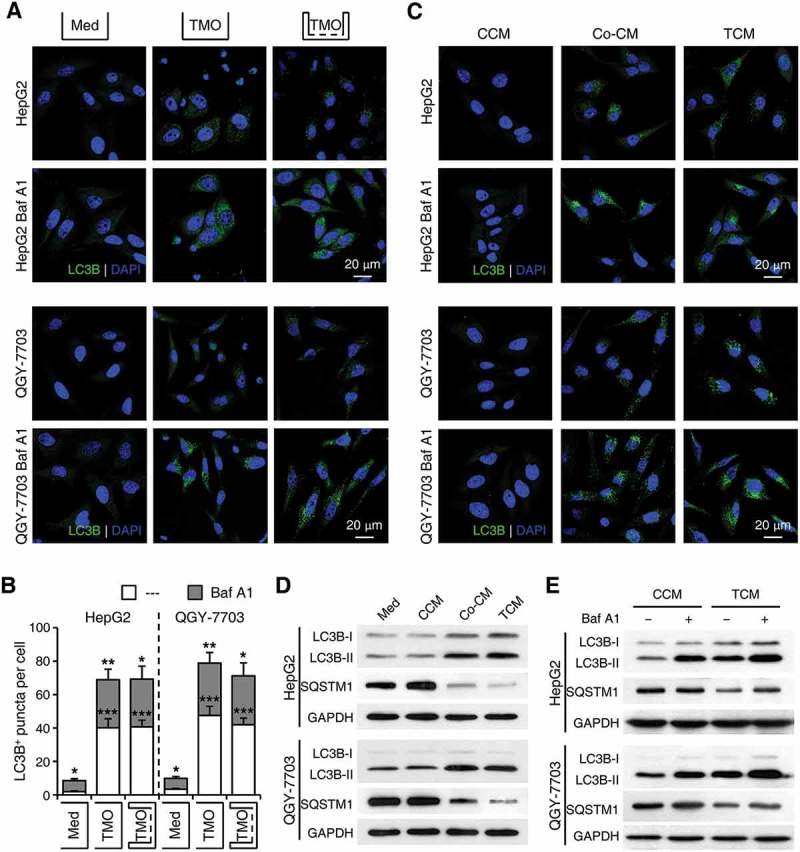
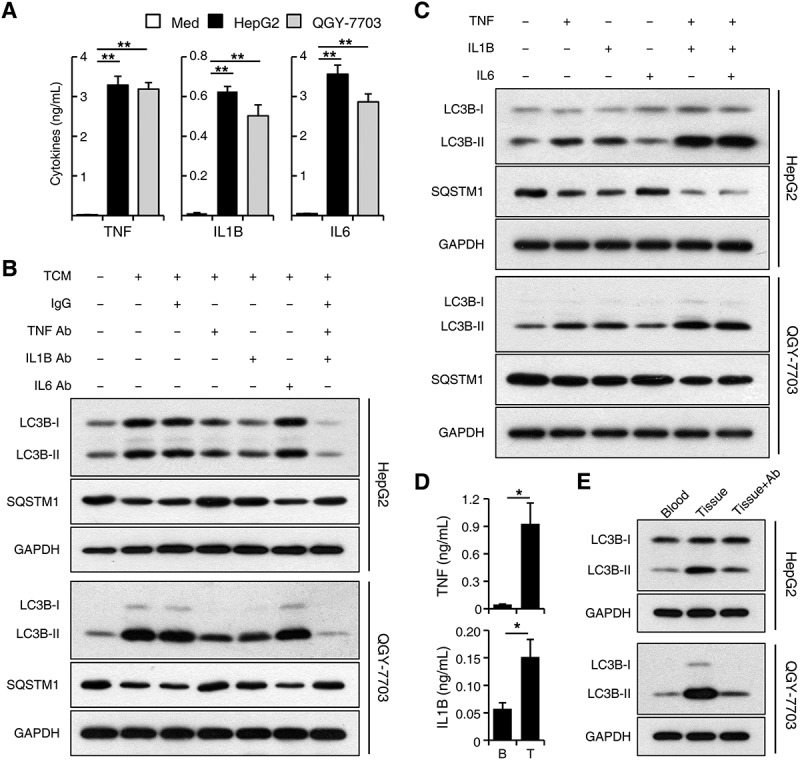
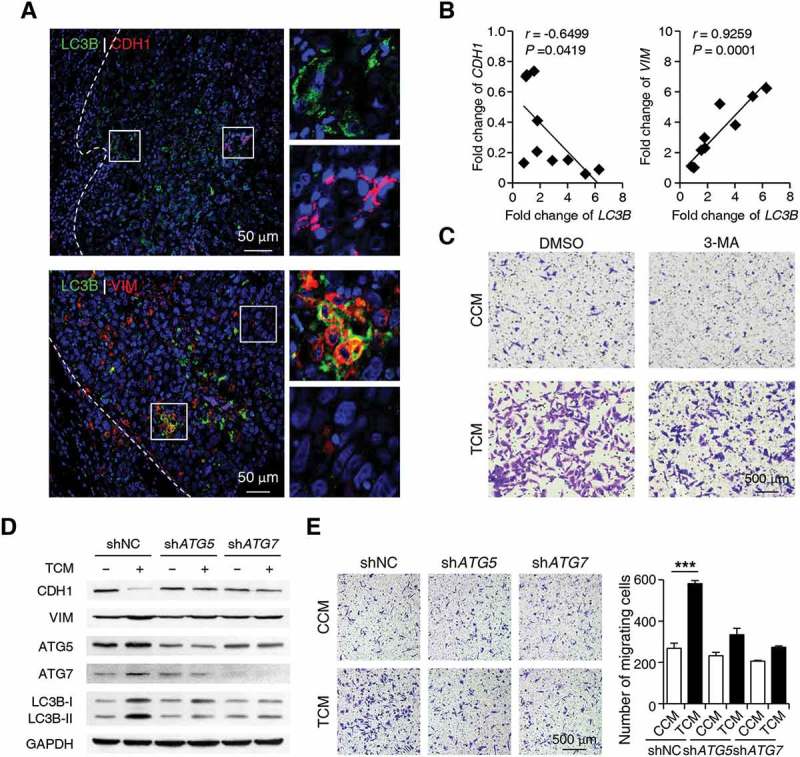
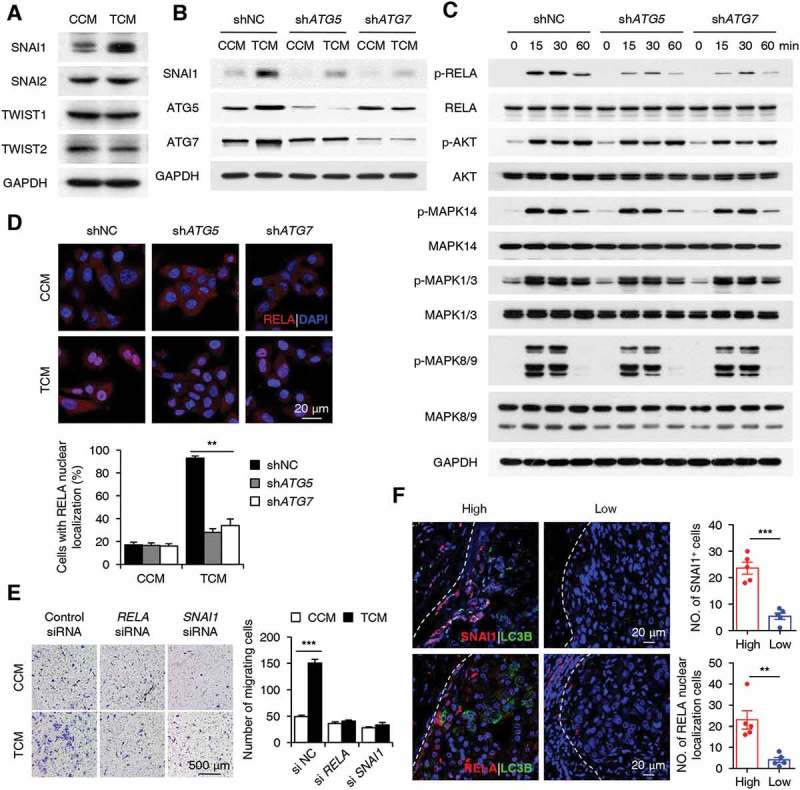
Macroautophagy/autophagy is an important catabolic process mediating cellular homeostasis and plays critical roles in cancer development. Whereas autophagy has been widely studied in various pathological models, little is known about the distribution, clinical significance and regulatory mechanism of this process in human hepatocellular carcinoma (HCC). In the present study, we found that tumor tissues exhibited significantly increased levels of autophagy compared with non-tumor tissues, and cancer cells with higher levels of autophagy were predominantly enriched in the invading edge regions of human HCC. Increased MAP1LC3B/LC3B expression in the invading edge regions was significantly correlated with a higher density of closely located monocytes, and TNF and IL1B derived from tumor-activated monocytes synergistically induced cancer cell autophagy in the invading edge regions of HCC. Monocyte-elicited autophagy induced the epithelial-mesenchymal transition (EMT) of cancer cells and promoted tumor metastasis by activating the NFKB-SNAI1 signaling pathway. Moreover, the increase of LC3B+ cancer cells in the invading edge areas was associated with high mortality and reduced survival of patients with HCC. These findings indicated that cancer cell autophagy is regulated by a collaborative interaction between tumor and immune cell components in distinct HCC microenvironments, thus allowing the inflammatory monocytes to be rerouted in a tumor-promoting direction.

Keywords: Autophagosome; epithelial-mesenchymal transition; invading edge; nuclear factor kappa-light-chain-enhancer of activated B cells (NFKB); tumor microenvironment.


Figures

Figure 1.
Figure 1.
Upregulated autophagy in cancer cells in the invading edge area facilitates the disease progression of human HCC. (a-b) Sections of paraffin-embedded hepatoma samples were stained with anti-human LC3B Ab or anti-human SQSTM1 Ab. The distribution of LC3B+ or SQSTM1+ cells in the peritumor, invading edge, and tumor nest regions of human HCC was determined by confocal microscopy (a) or IHC (b). The micrographs at higher magnification in A show the stained peritumor (1) and tumor nest (2). The proportion of LC3B+ cancer cells was also included in A (n = 5). (c) The mRNA levels of LC3B, SQSTM1, ATG5, and ATG7 from different areas of fresh human HCC tissues were analyzed by Q-PCR (n = 30). (d) The protein levels of LC3B and SQSTM1 from different areas of fresh human HCC tissues were analyzed by western blotting (n = 3). (e) Cumulative overall survival (OS) and recurrence (TR) curves of patients. Patients were divided into 2 groups according to median value of LC3B+ cell density in the invading edge or tumor nest regions (n = 95). Cumulative OS and TR were calculated using the Kaplan–Meier method and analyzed by the log-rank test. Red lines, high density; black lines, low density. The results shown in C are plotted against the mean value of LC3B expression in non-tumor regions of HCC and expressed as the means ± SEM. * < 0.05, *** < 0.001.
Figure 2.
Figure 2.
Peritumoral monocytes elicit the upregulation of autophagy in invading-edge-infiltrating cancer cells. (a) Sections of paraffin-embedded hepatoma samples were stained with the anti-CD68 or anti-LC3B Abs. Correlations between the densities of CD68+ and LC3B+ cells in the invading edge regions of HCC tissues were analyzed (n = 30). (b-c) CD14+ cells were purified from peripheral blood (non-tumor) or HCC tumor tissues and then incubated with established HepG2 or QGY-7703 hepatoma cells for 20 h, with or without a following treatment of Baf A1 (5 nM). The number of LC3B+ puncta in hepatoma cells was determined by immunofluorescence (b, n = 5), and autophagosomes in hepatoma cells were analyzed by transmission electron microscopy (c, n = 5). One out of 5 representative micrographs is shown in C, and the arrows indicate autophagosomes. The results shown in A-C are expressed as the means ± SEM. * < 0.05, ** < 0.01.
Figure 3.
Figure 3.
Soluble factors derived from tumor-activated monocytes mediate the induction of cancer cell autophagy. Monocytes were purified from the blood of healthy donors. (a-b) Monocytes were pre-treated with HepG2 or QGY-7703 TSN for 2 h, washed, and then incubated for 20 h with HepG2 or QGY-7703 cells, respectively, in the presence or absence of Baf A1 (5 nM), and with or without physical separation of the monocytes and cancer cells. Numbers of LC3B+ puncta in hepatoma cells were determined by immunofluorescence; n = 7 and * for the Med group stands for significant difference in LC3+ puncta number between the BafA1-treated and untreated hepatoma cells. (c-e) HepG2 or QGY-7703 cells were left untreated (Med) or treated with supernatants from control monocytes (CCM), supernatants from the co-culture of monocytes and hepatoma cells (Co-CM), or supernatants from monocytes pre-treated with TSN (TCM), with or without a following treatment of Baf A1. The levels of LC3B and SQSTM1 in HepG2 or QGY-7703 cells after 20 h of incubation were determined by immunofluorescence (c) and western blotting (d, e). One out of 5 representative graphs is shown in C, D and E. The results shown in B are expressed as the means ± SEM. * < 0.05, ** < 0.01, *** < 0.001.
Figure 4.
Figure 4.
TNF and IL1B derived from tumor-activated monocytes synergistically induce cancer cell autophagy. (a-c) Monocytes were purified from the blood of healthy donors. (a) Monocytes were left untreated or treated with TSN for 20 h. The production of different cytokines was determined by ELISA; n = 10. (b) HepG2 or QGY-7703 cells were left untreated or treated with TCM with a control IgG1 (40 μg/mL), a TNF blocking mAb (10 μg/mL), an IL6 blocking mAb (40 μg/mL), or an IL1B blocking mAb (10 μg/mL) for 20 h. The levels of LC3B and SQSTM1 expression in hepatoma cells were determined by western blotting. (c) HepG2 or QGY-7703 cells were left untreated or treated with TNF (20 ng/mL), IL1B (10 ng/mL), or IL6 (20 ng/mL) for 20 h. The levels of LC3B and SQSTM1 expression in hepatoma cells were determined by western blotting. (d) CD14+ cells were isolated from patient blood and paired HCC tumor tissues. The production of TNF and IL1B in these cells was determined by ELISA; n = 5. (e) HepG2 or QGY-7703 cells were cultured with CD14+ cells isolated from patient blood or paired HCC tumor tissues for 20 h in the presence or absence of TNF and IL1B blocking mAbs. The levels of LC3 expression in hepatoma cells were determined by western blotting. One out of 5 representative graphs is shown in B, C, and E. The results shown in A and D are expressed as the means ± SEM. * < 0.05, ** < 0.01.
Figure 5.
Figure 5.
Autophagy increases EMT of cancer cells at the invading edge of human HCC. (a) Sections of paraffin-embedded hepatoma samples were double-stained with anti-human LC3B (green) and anti-human CDH1 (red) Abs or anti-human LC3B (green) and anti-human VIM (red) Abs. The expression levels of CDH1 and VIM in LC3B+ cancer cells were determined by confocal microscopy. The enlarged micrographs show the stained invading edge or tumor nest regions. Blue, DAPI; n = 5. (b) The mRNA levels of LC3B, CDH1 and VIM from the invading edge region of HCC tissues were determined by Q-PCR (n = 10). (c) HepG2 cells were pre-treated with DMSO or 3-MA (5 mM) before being exposed to CCM or TCM for 20 h. The migration of HepG2 cells was analyzed; n = 5. (d-e) HepG2 cells were transfected with shNC, shATG5, or shATG7 lentiviral vectors and then treated with CCM or TCM for 20 h. The levels of ATG5, ATG7, LC3B, CDH1 and VIM expression in HepG2 cells were determined by western blotting (d). The migration of HepG2 cells was evaluated in E (n = 6). One out of 6 representative graphs is shown in C, D, and E. The results shown in E are expressed as the means ± SEM.*** < 0.001.
Figure 6.
Figure 6.
The NFKB-SNAI1 pathway mediates the autophagy-enhanced migration of cancer cells. (a) HepG2 cells were stimulated with CCM or TCM for 20 h. The expression levels of SNAI1, SNAI2, TWIST1, and TWIST2 were measured by western blotting. (b-d) HepG2 cells were transfected with shNC, shATG5, or shATG7 lentiviral vectors and then treated with CCM or TCM for 20 h (b), 30 min (d), or other time intervals (c). The levels of SNAI1, ATG5, ATG7, p-RELA, RELA, p-AKT, AKT, p-MAPK14, MAPK14, p-MAPK1/3, MAPK1/3, p-MAPK8/9, and MAPK8/9 were determined by western blotting (b and c). Translocation of the RELA protein was analyzed by confocal microscopy (n = 5) (d). (e) HepG2 cells were transfected with control, si-RELA, or si-SNAI1 RNAs before being exposed to CCM or TCM for 20 h, and then their migration abilities were analyzed (n = 6). (f) Sections of hepatoma samples were double stained with anti-human LC3B (green) and anti-human SNAI1 (red) Abs or anti-human LC3B (green) and anti-human RELA (red) Abs. The levels of SNAI1 and nuclear-located RELA expression at the invading edge of human HCCs with high or low LC3B expression were determined by confocal microscopy. Blue, DAPI; n = 5. One out of 5 representative graphs is shown in A-F. The results shown in D, E and F are expressed as the means ± SEM. ** < 0.01, *** < 0.001.

Similar articles

Cited by

References

    1. Perera RM, Stoykova S, Nicolay BN, et al. Transcriptional control of autophagy-lysosome function drives pancreatic cancer metabolism. Nature. 2015. August 20;524(7565):361–365. PubMed PMID: 26168401; PubMed Central PMCID: PMC5086585. - PMC - PubMed
    1. Zhong Z, Sanchez-Lopez E, Karin M.. Autophagy, inflammation, and immunity: a troika governing cancer and its treatment. Cell. 2016. July 14;166(2):288–298. PubMed PMID: 27419869; PubMed Central PMCID: PMC4947210. - PMC - PubMed
    1. Jiang X, Overholtzer M, Thompson CB. Autophagy in cellular metabolism and cancer. J Clin Invest. 2015. January;125(1):47–54. PubMed PMID: 25654550; PubMed Central PMCID: PMC4382242. - PMC - PubMed
    1. Strohecker AM, White E. Targeting mitochondrial metabolism by inhibiting autophagy in BRAF-driven cancers. Cancer Discov. 2014. July;4(7):766–772. PubMed PMID: 24860158; PubMed Central PMCID: PMC4090279. - PMC - PubMed
    1. Klionsky DJ, Abdelmohsen K, Abe A, et al. Guidelines for the use and interpretation of assays for monitoring autophagy (3rd edition). Autophagy. 2016;12(1):1–222. PubMed PMID: 26799652; PubMed Central PMCID: PMC4835977. - PMC - PubMed

Publication types

MeSH terms

Grants and funding

This work was supported by project grants from the National Key R&D Program of China (2017YFA0505803, 2018ZX10302205), the National Natural Science Foundation of China (81472644, 81773054, 81730044, and 91442205), the Pearl River Nova Program of Guangzhou (201506010040) and the Fundamental Research Funds for the Central Universities (171gjc32).