. 2018 Jul;19(7):766-775.
doi: 10.1038/s41590-018-0137-8. Epub 2018 Jun 20.

The E3 ligases Itch and WWP2 cooperate to limit TH2 differentiation by enhancing signaling through the TCR

Affiliations

The E3 ligases Itch and WWP2 cooperate to limit TH2 differentiation by enhancing signaling through the TCR

Daisuke Aki et al. Nat Immunol. 2018 Jul.

Abstract

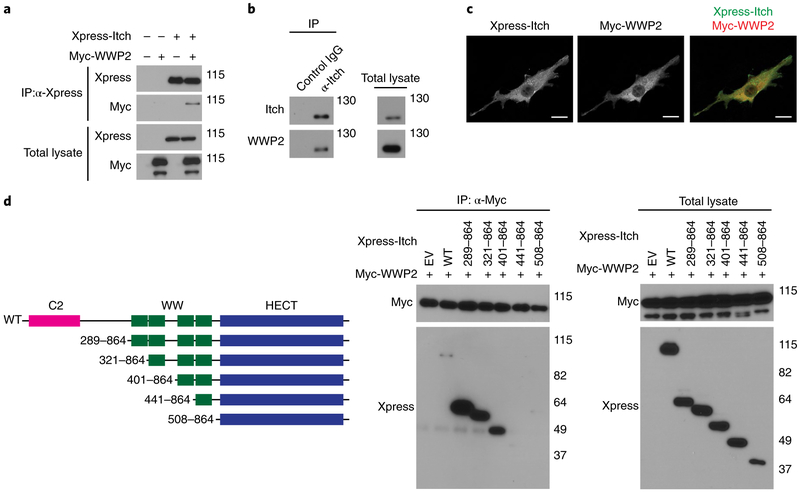
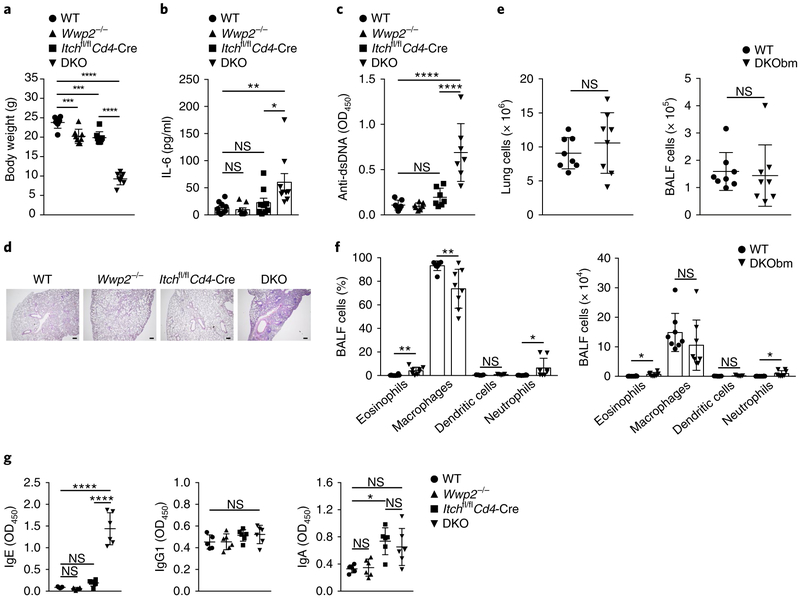
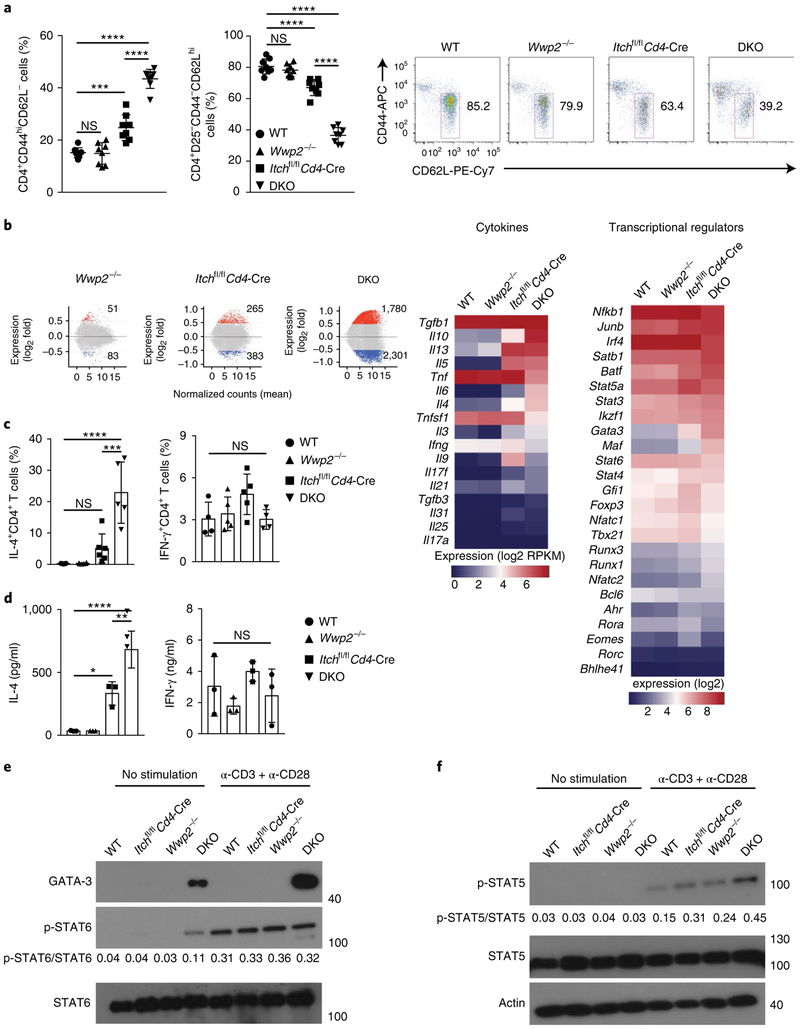
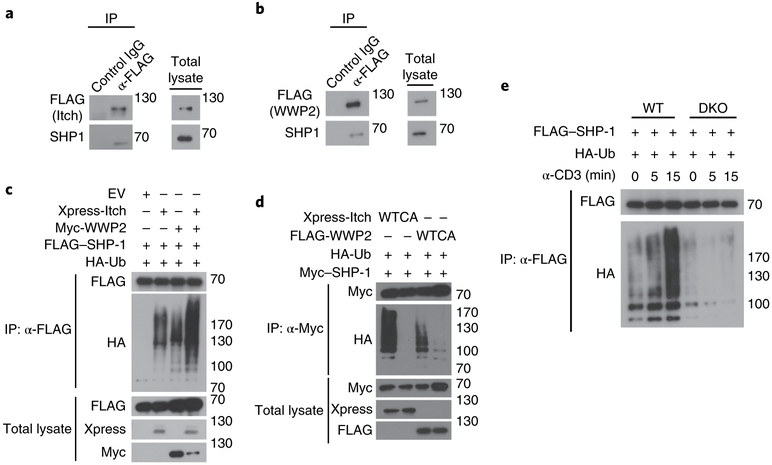
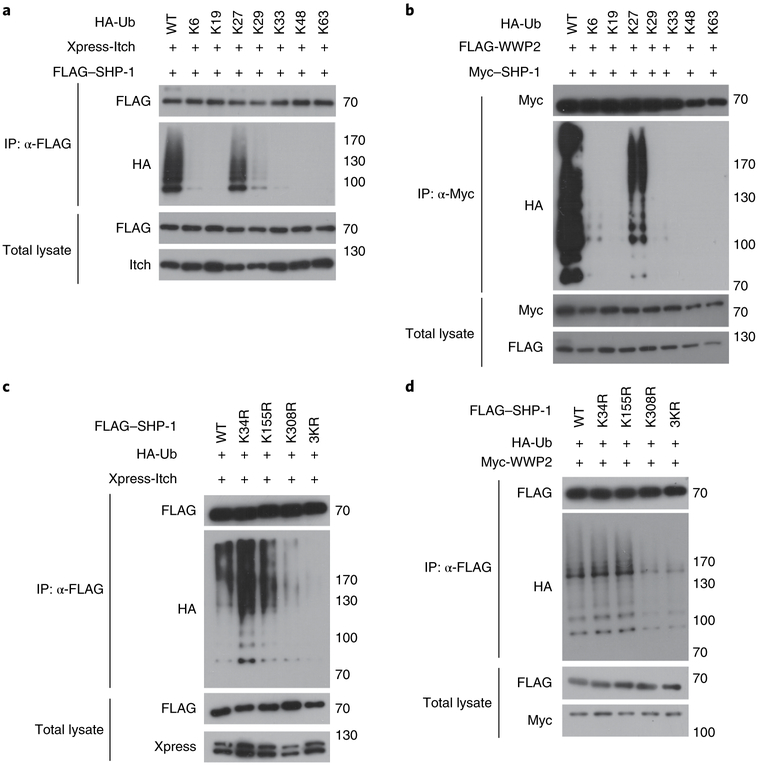
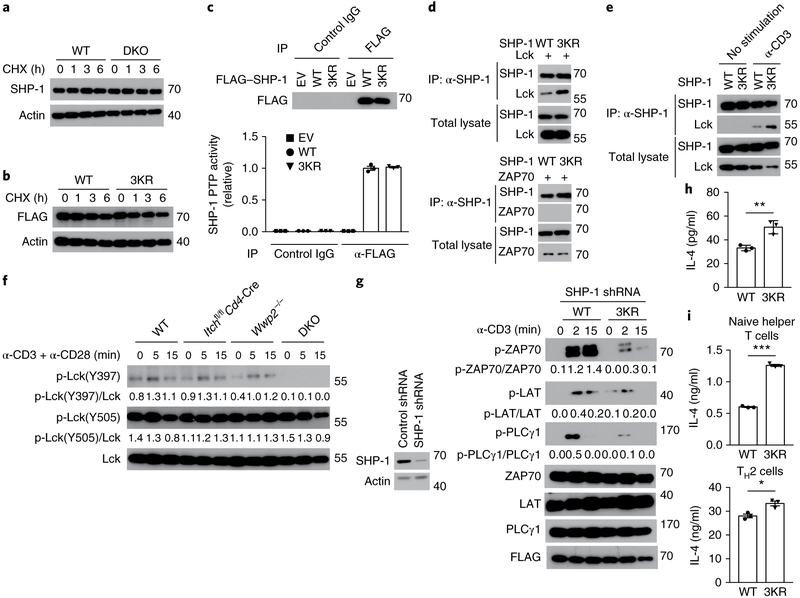
The mechanisms by which the sensitivity of naive CD4+ T cells to stimulation by the cognate antigen via the T cell antigen receptor (TCR) determines their differentiation into distinct helper T cell subsets remain elusive. Here we demonstrate functional collaboration of the ubiquitin E3 ligases Itch and WWP2 in regulating the strength of the TCR signal. Mice lacking both Itch and WWP2 in T cells showed spontaneous autoimmunity and lung inflammation. CD4+ T cells deficient in Itch and WWP2 exhibited hypo-responsiveness to TCR stimulation and a bias toward differentiation into the TH2 subset of helper T cells. Itch and WWP2 formed a complex and cooperated to enhance TCR-proximal signaling by catalyzing the conjugation of atypical ubiquitin chains to the phosphatase SHP-1 and reducing the association of SHP-1 with the tyrosine kinase Lck. These findings indicate that targeted ubiquitination regulates the strength of the TCR signal and differentiation toward the TH2 lineage.


Figures

Fig. 1 ∣
Fig. 1 ∣. Itch interacts with WWP2 through its third WW domain.
a, Immunoblot analysis of HEK293T cells transfected with expression vectors for Xpress-tagged Itch and/or Myc-tagged WWP2 or not (above lanes), assessed after immunoprecipitation (IP) with anti-Xpress (α-Xpress) or no immunoprecipitation (Total lysate) (left margin); right margin, molecular size in kilodaltons (throughout). b, Immunoblot analysis of the interaction of endogenous Itch with WWP2 in Jurkat T cells, assessed after immunoprecipitation with anti-Itch or the control antibody IgG (above lanes; left) or no immunoprecipitation (right). c, Confocal microscopy of the intracellular localization of Xpress-tagged Itch and Myc-tagged WWP2 in NIH3T3 cells transfected to express those molecules. Scale bars, 20 μm. d, Full-length (WT) Itch and its deletion mutants lacking functional domains (left; ranges (left margin) indicate amino acids present in construct), and immunoblot analysis of the interaction of Itch and WWP2 in HEK293T cells co-transfected (above lanes) to express Myc-tagged WWP2 plus empty vector (EV) or Xpress-tagged full-length Itch or various deletion mutants (middle and right), assessed after immunoprecipitation with anti-Myc (middle) or no immunoprecipitation (right). Data are representative of two to four independent experiments.
Fig. 2 ∣
Fig. 2 ∣. Accelerated autoimmunity and inflammation in DKO mice.
a, Body weight of 6-week-old male wild-type (WT) mice, Wwp2−/−, Itchf/fCd4-Cre and Itchf/fCd4-Cre Wwp2−/− (DKO) mice (key; n = 8 per group). b, ELISA of IL-6 in the serum of 6- to 8-week-old mice as in a (key; n = 9 per group). c, ELISA of antibodies to double-stranded DNA (Anti-dsDNA) in the serum of 6-week-old mice as in a (key; n = 7 per group), presented as optical density at 450 nm (OD450). d, Lung sections from 6-week-old mice as in a (above images), stained with hematoxylin and eosin. Scale bars, 100 μm. e, Absolute number of cells in the lungs (left) or bronchoalveolar lavage fluid (BALF) (right) of wild-type or DKObm mice (key; n = 8 per group) at 6-8 weeks after cell transplantation. f, Frequency (left) and number (right) of eosinophils, macrophages, dendritic cells and neutrophils (horizontal axis) in the bronchoalveolar lavage fluid of mice as in e (key; n = 8 per group (eosinophils, macrophages and neutrophils) or n = 5 per group (dendritic cells)). g, ELISA of the immunoglobulin subclasses IgE, IgG1 and IgA in serum from 6-week-old wild-type mice (n = 5), Wwp2−/− mice (n = 6), Itchf/fCd4-Cre mice (n = 6) or DKO mice (n = 6) as in a (key). Each symbol (a-c,e-g) represents an individual mouse; small horizontal lines (c,e,g) indicate the mean (±s.d.). NS, not significant (P > 0.05); *P < 0.05, **P < 0.01, *** P < 0.001 and ****p < 0.0001 (one-way analysis of variance (ANOVA) with Bonferroni’s multiple-comparisons test (a-c,g) or unpaired two-tailed Student’s t-test (e,f)). Data are pooled from or representative of two to four independent experiments (mean±s.d. in a,f; mean±s.e.m. in b).
Fig. 3 ∣
Fig. 3 ∣. Itch and WWP2 collaboratively regulate TH2 differentiation.
a, Frequency of splenic memory-like (CD44hiCD62L) CD4+ T cells (left) and naive (CD25CD44CD62Lhi) CD4+ T cells (middle) from 6- to 7-week-old wild-type, Wwp2−/−, Itchf/fCd4-Cre and DKO mice (key; n = 8 per group), and flow cytometry of splenic naive CD4+ T cells from such mice, showing gating used (right). Numbers adjacent to outlined areas (right) indicate percent CD4+CD25 CD44CD62Lhi cells. b, Gene-expression profiles (left) of splenic CD4+ T cells stimulated for 4h with PMA and ionomycin, showing genes expressed differentially (mean of normalized counts) in Wwp2−/−, Itchf/fCd4-Cre or DKO cells (above plots) relative to their expression in wild-type cells, and expression of genes encoding selected cytokines (middle) or transcriptional regulators (right) in cells as at left (above plots), presented as log2 reads per kilobase of exon per million mapped reads (RPKM) values. c, Frequency of CD4+ T cells with intracellular staining of IL-4 (left) or IFN-γ (right) among splenocytes obtained from mice as in a (key; n = 5–6 per group (IL-4) or n = 4–5 per group (IFN-γ)) and stimulated for 5h in vitro with PMA and ionomycin in the presence of the protein-transport inhibitor GolgiStop. d, ELISA of IL-4 (left) or IFN-γ (right) in supernatants of CD4+ T cells sorted from mice as in a (key; n = 3 per group) and stimulated for 48h in vitro with anti-CD3 plus anti-CD28. e,f, Immunoblot analysis of GATA-3 (e) and phosphorylated (p-) and total STAT6 (e) or STAT5 (f), as well as actin (loading control) (left margin), in lysates of CD4+ T cells sorted from mice as in a (above lanes) and left unstimulated (left) or stimulated for 16h with anti-CD3 plus anti-CD28 (right; α-CD3 + α-CD28); numbers below lanes indicate the ratio of phosphorylated protein to total protein. Each symbol (a,c,d) represents an individual mouse; small horizontal lines (a) indicate the mean (±s.d.). *P < 0.05, **P < 0.01, *** P < 0.001 and ****P < 0.0001 (one-way ANOVA with Bonferroni’s multiple-comparisons test). Data are pooled from or representative two to six independent experiments (mean±s.d. in c,d).
Fig. 4 ∣
Fig. 4 ∣. Itch and WWP2 cooperate to promote proximal TCR signaling.
a, ELISA of IL-2 in supernatants of naive CD4+ T cells sorted from wild-type, Wwp2−/−, Itchf/fCd4-Cre or DKO mice (key; n = 3 per group) and stimulated for 48h in vitro with anti-CD3 plus anti-CD28. b, Immunoblot analysis of phosphorylated and total ZAP70, LAT and PLCγ1, and total Itch and WWP2 (left margin), in lysates of CD4+ T cells sorted from mice as in a (above blots) and stimulated for 0, 5 or 15 min (above lanes) with anti-CD3 plus anti-CD28; numbers below lanes indicate the ratio of phosphorylated protein to total protein (left margin). c, Immunoblot analysis of phosphorylated and total CD3ζ, LAT and PLCγ1 (left margin) in lysates of wild-type and DKO Jurkat T cells (above blots) stimulated for 0, 5 or 15 min (above lanes) with anti-CD3; numbers below lanes, as in b. d, Immunoblot analysis of lysates of wild-type and DKO Jurkat T cells (above lanes) transfected to express FLAG-tagged CD3ζ and left unstimulated or stimulated for 5 min with anti-CD3 (above blots), assessed after immunoprecipitation with anti-FLAG or no immunoprecipitation (far left margin). e, Immunoblot analysis of phosphorylated and total proteins (left margin) in lysates of Jurkat T cells transfected with various combinations (above lanes) of expression vectors for FLAG-tagged WWP2 and Xpress-tagged Itch and stimulated for 0, 2 or 15 min (above lanes) with anti-CD3; numbers below lanes, as in b. f, Frequency of CD4+CD45.2+ T cells with downmodulation of TCRβ among such cells sorted from wild-type or DKObm mice (key; n = 3 per group) and stimulated for 0-8h (horizontal axis) in vitro with anti-CD3 plus anti-CD28, followed by analysis of cell-surface TCRβ expression. Each symbol (a) represents an individual mouse. **P < 0.01 and ***P < 0.001 (one-way ANOVA with Bonferroni’s multiple-comparisons test (a) or unpaired two-tailed Student’s t-test (f)). Data are pooled from or representative of two to three independent experiments (mean ± s.d. in a,f).
Fig. 5 ∣
Fig. 5 ∣. Itch and WWP2 promote the polyubiquitination of SHP-1.
a,b, Immunoblot analysis of lysates of Jurkat T cells transfected to express FLAG-tagged Itch (a) or WWP2 (b), assessed after immunoprecipitation with anti-FLAG or the control antibody IgG (above lanes, left) or without immunoprecipitation (right). c,d, Immunoblot analysis of an in vivo ubiquitination assay of SHP-1 in HEK293T cells transfected with various combinations (above lanes) of empty vector and expression vectors for Xpress-tagged Itch, Myc-tagged WWP2, FLAG-tagged SHP-1 and hemagglutinin-tagged ubiquitin (HA-Ub) (c) or with expression vectors for Xpress-tagged Itch or FLAG-tagged WWP2 (each wild-type (WT) or catalytically inactive (with the active-site cysteine replaced with alanine (CA)), and hemagglutinin-tagged ubiquitin and Myc-tagged SHP-1 (d), then lysed under denaturing conditions and immunoprecipitated with anti-FLAG (c) or anti-Myc (d) or assessed without immunoprecipitation (left margin). e, Immunoblot analysis of the ubiquitination of SHP-1 in lysates of wild-type and DKO Jurkat T cells (above blots) transfected to express FLAG-tagged SHP-1 together with HA-tagged ubiquitin, stimulated for 0, 5 or 15 min (above lanes) with anti-CD3, assessed after immunoprecipitation with anti-FLAG (left margin). Data are representative of three to four independent experiments.
Fig. 6 ∣
Fig. 6 ∣. Characterization of the ubiquitination of SHP-1 by Itch and WWP2.
a,b, Immunoblot analysis of ubiquitin-chain formation on SHP-1 in lysates of HEK293T cells transfected with expression vectors for HA-tagged wild-type ubiquitin (WT) or mutant ubiquitin (with retention of one lysine residue in each; above lanes), plus either Xpress-tagged Itch and FLAG-tagged SHP-1 (a) or FLAG-tagged WWP2 and Myc-tagged SHP-1 (b), assessed after immunoprecipitation with anti-FLAG (a) or anti-Myc (b) or without immunoprecipitation (left margin). c,d, Immunoblot analysis of an in vivo assay of the ubiquitination of SHP-1 in HEK293T cells transfected with expression vectors for FLAG-tagged wild-type SHP-1 (WT) or mutant SHP-1 with replacement of various lysine residues with arginine (above lanes), plus HA-tagged ubiquitin and either Xpress-tagged Itch (c) or Myc-tagged WWP2 (d), assessed after immunoprecipitation with anti-FLAG or without immunoprecipitation (left margin). Data are representative of three independent experiments.
Fig. 7 ∣
Fig. 7 ∣. SHP-1 ubiquitination regulates the function of Lck.
a, Immunoblot analysis of SHP-1 and actin (loading control) in lysates of wild-type and DKO Jurkat T cells (above blots) treated for 0, 1, 3 or 6 h (above lanes) with 50 μg/ml of cycloheximide (CHX). b, Immunoblot analysis of lysates of Jurkat T cells expressing wild-type SHP-1 or 3KR–SHP-1 (above blots) and treated with cycloheximide as in a. c, Protein tyrosine-phosphatase (PTP) activity of 3KR–SHP-1 among proteins immunoprecipitated, with the control antibody IgG or anti-Flag (below plot), from lysates of Jurkat T cells transfected with empty vector or expression vector for FLAG-tagged wild-type SHP-1 or 3KR–SHP-1 (key), presented relative to the activity of wild-type-SHP-1 (bottom), and immunoblot analysis of such immunoprecipitates (above lanes) (top). d, Immunoblot analysis of the interaction of SHP-1 and Lck in lysates of HEK293T cells transfected with expression vectors for wild-type SHP-1 or 3KR–SHP-1 plus either Lck (top group) or ZAP70 (bottom group) (above lanes), assessed after immunoprecipitation with anti-SHP-1 or without immunoprecipitation (left margin). e, Immunoblot analysis of the interaction of SHP-1 and Lck in Jurkat T cells transfected with expression vectors for wild-type SHP-1 or 3KR–SHP-1 (above lanes) and left unstimulated or stimulated for 5 min with anti-CD3 (above blots), assessed after immunoprecipitation with anti-SHP-1 or without immunoprecipitation (left margin). f, Immunoblot analysis of Lck phosphorylated at Tyr397 (p-Lck(Y397)) or Tyr505 (p-Lck(Y505)) and total Lck in CD4+ T cells sorted from wild-type, Wwp2−/−, Itchf/fCd4-Cre or DKO mice (above blots) and stimulated for 0, 5 or 15 min (above lanes) with anti-CD3 plus anti-CD28; numbers below lanes indicate the ratio of phosphorylated protein to total protein. g, Immunoblot analysis of phosphorylated and total signaling molecules (left margin), and FLAG (loading control), in lysates of Jurkat T cells expressing short hairpin RNA targeting SHP-1 (SHP-1 shRNA) together with FLAG-tagged wild-type SHP-1 or 3KR–SHP-1 (above blots) and stimulated for 0, 2 or 15 min (above lanes) with anti-CD3 (numbers below lanes, as in f) (right blots), and immunoblot analysis of SHP-1 in Jurkat T cells expressing control (non-targeting) or SHP-1-targeting short hairpin RNA (above lanes) (left). h, ELISA of IL-4 in supernatants of GFP+ (transduced) CD4+ T cells sorted from bone marrow chimeras reconstituted with bone marrow cells transduced with retroviral vector encoding green fluorescent protein (GFP) and either wild-type SHP-1 or 3KR–SHP-1 (horizontal access), then stimulated for 48 h with anti-CD3 plus anti-CD28. i, ELISA of IL-4 in supernatants of naive CD4+ T cells transduced to express wild-type SHP-1 or 3KR–SHP-1 (horizontal axis) under neutral conditions (top) or TH2 conditions (bottom) and then allowed to ‘rest’ for 3 d, followed by sorting of GFP+ (transduced) cells and re-stimulation for 24 h with anti-CD3 plus anti-CD28. Each symbol (c,h,i) represents an individual technical replicate (c,i) or mouse (h). *P < 0.05, **P < 0.01 and *** P < 0.001 (unpaired two-tailed Student’s t-test). Data are pooled from or representative of two to three independent experiments (mean ± s.e.m. (c,i) or mean ± s.d. (h) of n = 3 technical replicates).

Similar articles

Cited by

References

    1. Zhu J & Paul WE Peripheral CD4+ T-cell differentiation regulated by networks of cytokines and transcription factors. Immunol. Rev. 238, 247–262 (2010). - PMC - PubMed
    1. Ho IC, Tai TS & Pai SY GATA3 and the T-cell lineage: essential functions before and after T-helper-2-cell differentiation. Nat. Rev. Immunol. 9, 125–135 (2009). - PMC - PubMed
    1. Constant S, Pfeiffer C, Woodard A, Pasqualini T & Bottomly K Extent of T cell receptor ligation can determine the functional differentiation of naive CD4+ T cells. J. Exp. Med. 182, 1591–1596 (1995). - PMC - PubMed
    1. Yamane H & Paul WE Early signaling events that underlie fate decisions of naive CD4+ T cells toward distinct T-helper cell subsets. Immunol. Rev. 252, 12–23 (2013). - PMC - PubMed
    1. Yamane H, Zhu J & Paul WE Independent roles for IL-2 and GATA-3 in stimulating naive CD4+ T cells to generate a Th2-inducing cytokine environment. J. Exp. Med. 202, 793–804 (2005). - PMC - PubMed

Publication types

MeSH terms

Substances