. 2018 Jul;28(7):983-997.
doi: 10.1101/gr.233874.117. Epub 2018 Jun 18.

Epigenetic maintenance of topological domains in the highly rearranged gibbon genome

Affiliations

Epigenetic maintenance of topological domains in the highly rearranged gibbon genome

Nathan H Lazar et al. Genome Res. 2018 Jul.

Abstract

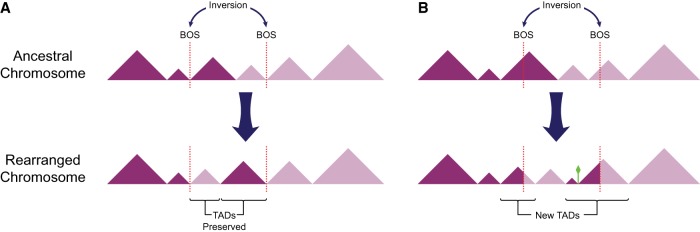
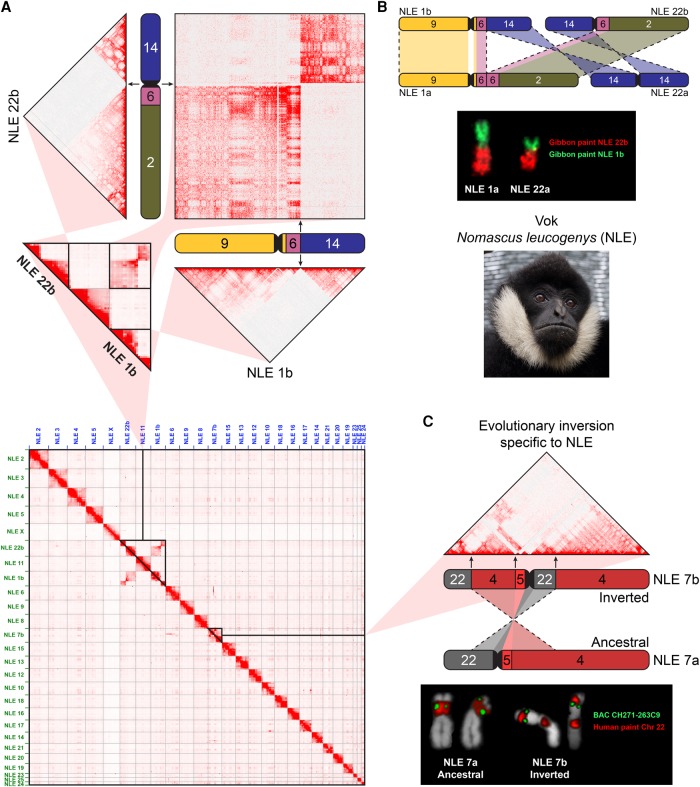
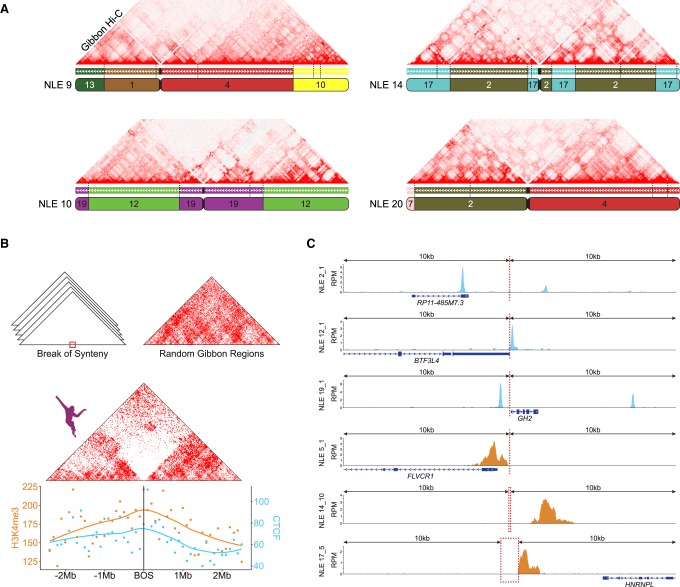
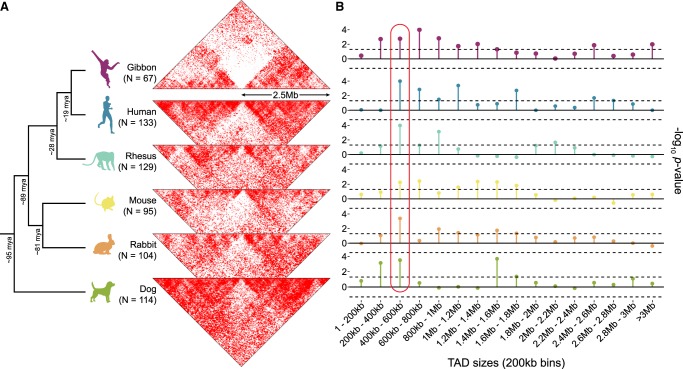
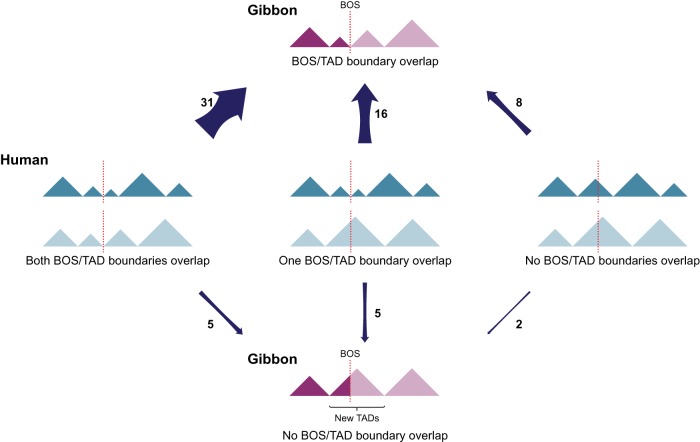
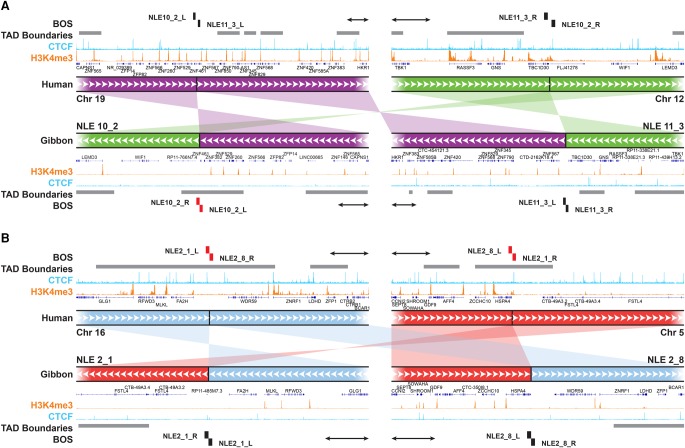
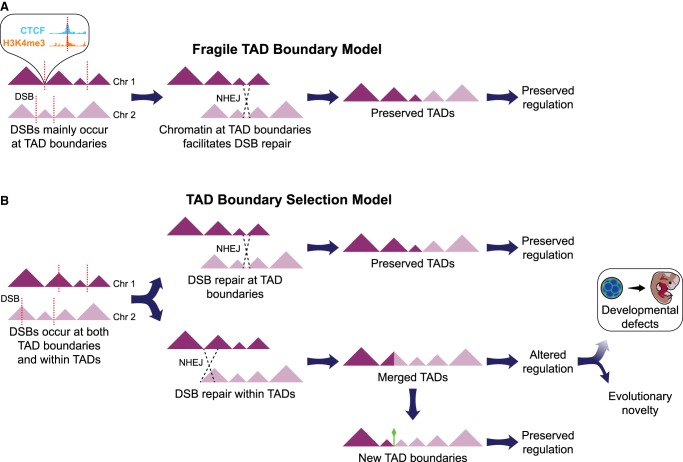
The relationship between evolutionary genome remodeling and the three-dimensional structure of the genome remain largely unexplored. Here, we use the heavily rearranged gibbon genome to examine how evolutionary chromosomal rearrangements impact genome-wide chromatin interactions, topologically associating domains (TADs), and their epigenetic landscape. We use high-resolution maps of gibbon-human breaks of synteny (BOS), apply Hi-C in gibbon, measure an array of epigenetic features, and perform cross-species comparisons. We find that gibbon rearrangements occur at TAD boundaries, independent of the parameters used to identify TADs. This overlap is supported by a remarkable genetic and epigenetic similarity between BOS and TAD boundaries, namely presence of CpG islands and SINE elements, and enrichment in CTCF and H3K4me3 binding. Cross-species comparisons reveal that regions orthologous to BOS also correspond with boundaries of large (400-600 kb) TADs in human and other mammalian species. The colocalization of rearrangement breakpoints and TAD boundaries may be due to higher chromatin fragility at these locations and/or increased selective pressure against rearrangements that disrupt TAD integrity. We also examine the small portion of BOS that did not overlap with TAD boundaries and gave rise to novel TADs in the gibbon genome. We postulate that these new TADs generally lack deleterious consequences. Last, we show that limited epigenetic homogenization occurs across breakpoints, irrespective of their time of occurrence in the gibbon lineage. Overall, our findings demonstrate remarkable conservation of chromatin interactions and epigenetic landscape in gibbons, in spite of extensive genomic shuffling.


Figures

Figure 1.
Figure 1.
Relative position of breaks of synteny differentially affects TAD integrity. Alternative consequences of hypothetical ancestral inversions (top) are demonstrated. TADs are represented with triangles and positions of breaks of synteny (BOS) are depicted with dotted lines. (A) BOS occurring at TAD boundaries in the ancestral genome, rearrange TADs as intact modules. (B) BOS within TAD bodies disrupt ancestral TADs and may give rise to new TADs in the gibbon genome. Moreover, a new TAD boundary (green diamond) can emerge within an ancestral TAD.
Figure 2.
Figure 2.
Gibbon Hi-C map highlights nonreference chromosomal rearrangements. (A, bottom) Whole-genome Hi-C interaction matrix is shown for the gibbon named Vok (photo shown on the right) aligned to the reference gibbon genome (Nleu3.0). (Top) A close-up view of the Hi-C data corresponding to the reciprocal translocation between gibbon Chromosomes 1 and 22 shows a lack of intra-chromosomal interactions in the regions mobilized by the rearrangement, and stronger-than-expected inter-chromosomal interactions. (B, top) A scheme demonstrates the reciprocal translocation that formed NLE1a/22a (present in Vok) from the ancestral NLE 1b/22b (present in reference). (Bottom) FISH validation of the rearrangement on Vok chromosomes with chromosome paints for NLE 1b (green) and NLE 22b (red). (C, top) Hi-C matrix for NLE 7b displays an example of “ghost interactions” between regions corresponding to human Chromosome 22 separated by a pericentromeric inversion of the ancestral NLE 7a. (Bottom) FISH with the chromosome paint for human Chr 22 (red) shows a split signal indicative of the inversion in Vok, but not the sister taxa Nomascus gabriellae. (Gibbon chromosomes are labeled outside of chromosome ideograms, and corresponding human chromosomes are color coded and indicated within ideograms.)
Figure 3.
Figure 3.
Gibbon–human breaks of synteny display epigenetic signatures of TAD boundaries. (A) As examples, Hi-C matrix for four representative gibbon chromosomes (NLE 9, 10, 14, and 20) are shown along with their corresponding gibbon–human chain from the UCSC Genome Browser. Corresponding human chromosomes are color coded and labeled within each gibbon chromosome ideogram. Positions of all gibbon–human BOS sites are marked on the chain track with vertical dashed lines and demonstrate that chromosomal interactions are often reduced across BOS. (B, center) Averaged interaction maps show juxtaposition of the gibbon Hi-C signal from regions flanking all gibbon–human BOS (±2.5 Mb) and flanking random genomic regions (top right corner). Overall, chromatin contacts are highly depleted across BOS, but not random regions. (Bottom) CTCF and H3K4me3 ChIP-seq peak counts with smoothed Loess curves in 100-kb bins across the BOS (±2.5 Mb) show enrichment of these epigenetic marks at BOS. (C) Examples CTCF (blue) and H3K4me3 peaks (orange) in a 20-kb window around BOS: (RPM) reads per million mapped reads.
Figure 4.
Figure 4.
Evolutionary context of the overlap between TAD boundaries and BOS. (A) The two-dimensional gibbon Hi-C histogram (Fig. 3B) is compared with Hi-C histograms for five other mammalian species at loci orthologous to the gibbon BOS (±2.5 Mbp). Decreased contact density across these loci in non-gibbon species suggests that breakpoint regions in gibbon are more likely to be TAD boundaries in other species. (N) Number of breakpoints that successfully lifted over from the gibbon genome to each species. (B) Lollipop plots show −log10 P-values from permutation analyses testing the overlap between gibbon BOS and TADs binned by size. This cross-species comparison points to consistently significant overlap of BOS with boundaries of 400–600 kb TADs (circled in red). Dotted lines mark P = 0.05 significance threshold (no multiple-test correction).
Figure 5.
Figure 5.
Alternative evolutionary relationship between BOS and TADs. Schematics show all possible scenarios between BOS (dotted lines) and TADs (triangles) in the gibbon (purple) and human (ancestral, blue) genomes. Arrow width reflects prevalence of the scenario in the gibbon genome, and the number beside the arrow represents the number of occurrences of each scenario.
Figure 6.
Figure 6.
New TADs and TAD boundaries can emerge from genomic rearrangements. (A) An example of a reciprocal translocation and inversion whose breakpoints (NLE 10_2 and NLE 11_3) do not overlap with TAD boundaries (gray horizontal bars) in human (top tracks). Within the gibbon genome (bottom tracks), breakpoint NLE 11_3 (right) maps within a TAD body, nearby an ancestral boundary, and NLE 10_2 breakpoint (left) corresponds to a new gibbon-specific boundary on NLE 10. ChIP-seq pileups for H3K4me3 (orange) and CTCF (light blue) are shown for human and gibbon. (B) Example of reciprocal translocations in which breakpoints (NLE 2_1 and NLE 2_8) are both within TAD boundaries in human (top tracks) and but not in gibbon (bottom tracks). A new TAD was created by the rearrangement involving NLE 2_1. Gray horizontal bars represent TAD boundaries of every computationally predicted TAD falling into the 500 kb–1 Mb size range. BOS overlapping with boundaries are marked in red. All scale bars represent 100 kb.
Figure 7.
Figure 7.
Gibbon BOS maintain their ancestral epigenetic identity and resemble nonsyntenic regions. (A) Examples of BOS showing a noticeable difference in CpG density (green track) and methylation (black track) between the two sides of the rearrangement with the switch occurring at the BOS (black blocks). Homology with the human chromosomes is shown below each BOS. Gibbon-specific repeats within the breakpoint explain the gap with the human alignment. (NLE) Nomascus leucogenys; (Meth) methylation. (B) Ranked barbell plots show the difference in residual methylation and CpG density between the two sides of each of the gibbon BOS. Each point represents a BOS side, and a line segment joins the two sides from the same BOS. BOS are ordered vertically by magnitude of the difference between sides. Black lines on the left show the rank associated with percentiles of distal permutation regions, whereas blue lines on the right show ranks for percentiles for adjacent permutation regions. Color-coding by age of the rearrangement highlights that old BOS (5–18 mya) are as likely as young ones (<5 mya) to show a large difference between the two sides. (C) Scatterplots of Δ residual methylation (left) and Δ CpG density (right) between gibbon and human BOS regions; each point represents one BOS. The line shows a least-squared linear regression, and the points are color-coded as in B.
Figure 8.
Figure 8.
Two models to explain colocalization of BOS and TAD boundaries in genome evolution. (A) Based on the “fragile TAD boundary” model, TAD boundaries carry epigenetic marks associated with DNA double-strand break (DSB, red dotted lines) and repair. DSBs will therefore occur more frequently at TAD boundaries than at other genomic regions and have a higher chance to be repaired and evolutionarily fixed. (B) The “TAD boundary selection” model assumes that DSBs occur equally at TAD boundaries and within TADs. However, rearrangements altering TAD structure by misplacing or deleting TAD boundaries are lost through purifying selection, whereas those maintaining TADs intact are more likely to become evolutionarily fixed. In a small portion of the cases, new TAD boundaries might emerge (green diamond) and survive in the population.

Similar articles

Cited by

References

    1. Berthelot C, Muffato M, Abecassis J, Roest Crollius H. 2015. The 3D organization of chromatin explains evolutionary fragile genomic regions. Cell Rep 10: 1913–1924. - PubMed
    1. Bolger AM, Lohse M, Usadel B. 2014. Trimmomatic: a flexible trimmer for Illumina sequence data. Bioinformatics 30: 2114–2120. - PMC - PubMed
    1. Canela A, Maman Y, Jung S, Wong N, Callen E, Day A, Kieffer-Kwon KR, Pekowska A, Zhang H, Rao SSP, et al. 2017. Genome organization drives chromosome fragility. Cell 170: 507–521.e18. - PMC - PubMed
    1. Capozzi O, Carbone L, Stanyon RR, Marra A, Yang F, Whelan CW, de Jong PJ, Rocchi M, Archidiacono N. 2012. A comprehensive molecular cytogenetic analysis of chromosome rearrangements in gibbons. Genome Res 22: 2520–2528. - PMC - PubMed
    1. Carbone L, Vessere GM, ten Hallers BF, Zhu B, Osoegawa K, Mootnick A, Kofler A, Wienberg J, Rogers J, Humphray S, et al. 2006. A high-resolution map of synteny disruptions in gibbon and human genomes. PLoS Genet 2: e223. - PMC - PubMed

Publication types