Oncolytic Reovirus and Immune Checkpoint Inhibition as a Novel Immunotherapeutic Strategy for Breast Cancer
- PMID: 29914097
- PMCID: PMC6025420
- DOI: 10.3390/cancers10060205
Oncolytic Reovirus and Immune Checkpoint Inhibition as a Novel Immunotherapeutic Strategy for Breast Cancer
Abstract
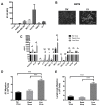
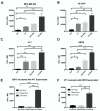
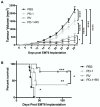
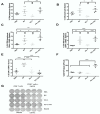
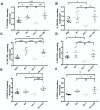
As the current efficacy of oncolytic viruses (OVs) as monotherapy is limited, exploration of OVs as part of a broader immunotherapeutic treatment strategy for cancer is necessary. Here, we investigated the ability for immune checkpoint blockade to enhance the efficacy of oncolytic reovirus (RV) for the treatment of breast cancer (BrCa). In vitro, oncolysis and cytokine production were assessed in human and murine BrCa cell lines following RV exposure. Furthermore, RV-induced upregulation of tumor cell PD-L1 was evaluated. In vivo, the immunocompetent, syngeneic EMT6 murine model of BrCa was employed to determine therapeutic and tumor-specific immune responses following treatment with RV, anti-PD-1 antibodies or in combination. RV-mediated oncolysis and cytokine production were observed following BrCa cell infection and RV upregulated tumor cell expression of PD-L1. In vivo, RV monotherapy significantly reduced disease burden and enhanced survival in treated mice, and was further enhanced by PD-1 blockade. RV therapy increased the number of intratumoral regulatory T cells, which was reversed by the addition of PD-1 blockade. Finally, dual treatment led to the generation of a systemic adaptive anti-tumor immune response evidenced by an increase in tumor-specific IFN-γ producing CD8⁺ T cells, and immunity from tumor re-challenge. The combination of PD-1 blockade and RV appears to be an efficacious immunotherapeutic strategy for the treatment of BrCa, and warrants further investigation in early-phase clinical trials.
Keywords: PD-1; breast cancer; immune checkpoint inhibition; immunotherapy; oncolytic viruses; reovirus.
Conflict of interest statement
The authors declare no conflict of interest. The funding sponsors had no role in the design of the study; in the collection, analyses, or interpretation of data; in the writing of the manuscript, and in the decision to publish the results.
Figures

Similar articles
-
Repurposing Sunitinib with Oncolytic Reovirus as a Novel Immunotherapeutic Strategy for Renal Cell Carcinoma.Clin Cancer Res. 2016 Dec 1;22(23):5839-5850. doi: 10.1158/1078-0432.CCR-16-0143. Epub 2016 May 24. Clin Cancer Res. 2016. PMID: 27220962
-
Combination Therapy With Reovirus and Anti-PD-1 Blockade Controls Tumor Growth Through Innate and Adaptive Immune Responses.Mol Ther. 2016 Feb;24(1):166-74. doi: 10.1038/mt.2015.156. Epub 2015 Aug 27. Mol Ther. 2016. PMID: 26310630 Free PMC article.
-
Oncolytic vaccines increase the response to PD-L1 blockade in immunogenic and poorly immunogenic tumors.Oncoimmunology. 2018 May 7;7(8):e1457596. doi: 10.1080/2162402X.2018.1457596. eCollection 2018. Oncoimmunology. 2018. PMID: 30221051 Free PMC article.
-
Overcoming Barriers in Oncolytic Virotherapy with HDAC Inhibitors and Immune Checkpoint Blockade.Viruses. 2016 Jan 6;8(1):9. doi: 10.3390/v8010009. Viruses. 2016. PMID: 26751469 Free PMC article. Review.
-
Oncolytic virus and PD-1/PD-L1 blockade combination therapy.Oncolytic Virother. 2018 Jul 31;7:65-77. doi: 10.2147/OV.S145532. eCollection 2018. Oncolytic Virother. 2018. PMID: 30105219 Free PMC article. Review.
Cited by
-
Current perspectives on Vaxinia virus: an immuno-oncolytic vector in cancer therapy.Med Oncol. 2023 Jun 15;40(7):205. doi: 10.1007/s12032-023-02068-9. Med Oncol. 2023. PMID: 37318642 Review.
-
The oncolytic efficacy and safety of avian reovirus and its dynamic distribution in infected mice.Exp Biol Med (Maywood). 2019 Sep;244(12):983-991. doi: 10.1177/1535370219861928. Epub 2019 Jul 12. Exp Biol Med (Maywood). 2019. PMID: 31299861 Free PMC article.
-
Determinants of combination GM-CSF immunotherapy and oncolytic virotherapy success identified through in silico treatment personalization.PLoS Comput Biol. 2019 Nov 27;15(11):e1007495. doi: 10.1371/journal.pcbi.1007495. eCollection 2019 Nov. PLoS Comput Biol. 2019. PMID: 31774808 Free PMC article.
-
Oncolytic Virotherapy Treatment of Breast Cancer: Barriers and Recent Advances.Viruses. 2021 Jun 11;13(6):1128. doi: 10.3390/v13061128. Viruses. 2021. PMID: 34208264 Free PMC article. Review.
-
Viral Vectors in Gene Therapy: Where Do We Stand in 2023?Viruses. 2023 Mar 7;15(3):698. doi: 10.3390/v15030698. Viruses. 2023. PMID: 36992407 Free PMC article. Review.
References
-
- Dieci M.V., Criscitiello C., Goubar A., Viale G., Conte P., Guarneri V., Ficarra G., Mathieu M.C., Delaloge S., Curigliano G., et al. Prognostic value of tumor-infiltrating lymphocytes on residual disease after primary chemotherapy for triple-negative breast cancer: A retrospective multicenter study. Ann. Oncol. 2014;25:611–618. doi: 10.1093/annonc/mdt556. - DOI - PMC - PubMed
-
- Loi S., Michiels S., Salgado R., Sirtaine N., Jose V., Fumagalli D., Kellokumpu-Lehtinen P.-L., Bono P., Kataja V., Desmedt C., et al. Tumor infiltrating lymphocytes are prognostic in triple negative breast cancer and predictive for trastuzumab benefit in early breast cancer: Results from the FinHER trial. Ann. Oncol. 2014;25:1544–1550. doi: 10.1093/annonc/mdu112. - DOI - PubMed
LinkOut - more resources
Full Text Sources
Other Literature Sources
Research Materials

