

Reverse Transcription Polymerase Chain Reaction in Giant Unilamellar Vesicles
- PMID: 29907779
- PMCID: PMC6003926
- DOI: 10.1038/s41598-018-27547-2
Reverse Transcription Polymerase Chain Reaction in Giant Unilamellar Vesicles
Abstract
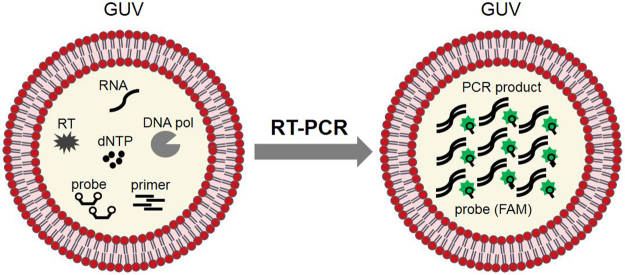
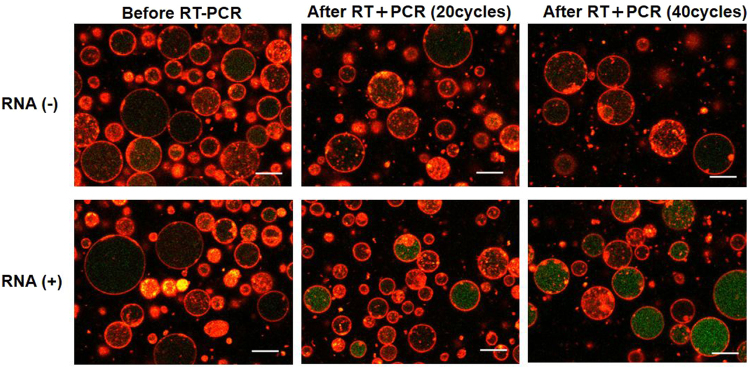
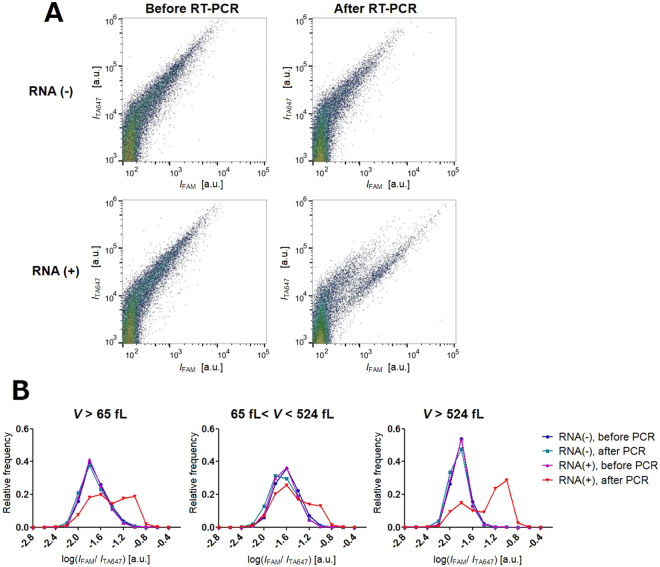
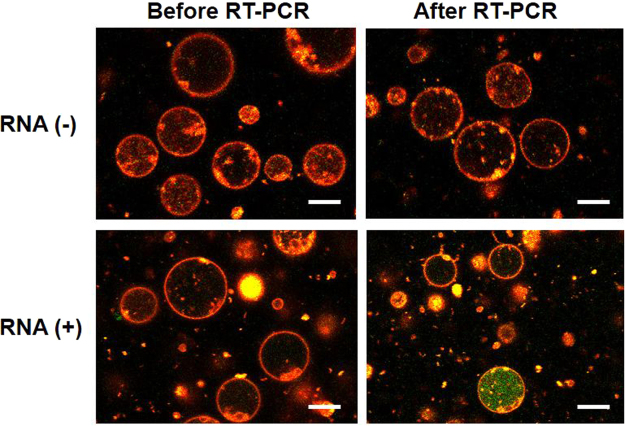
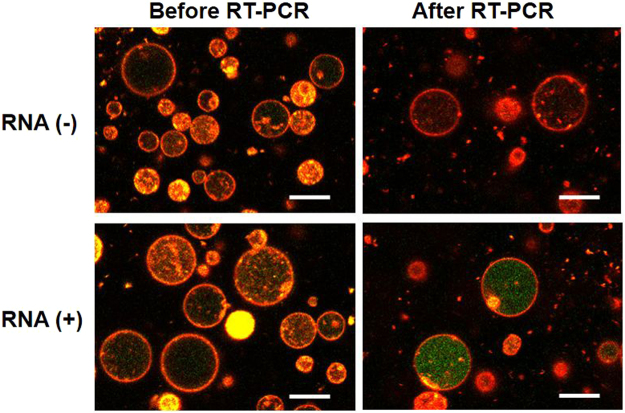
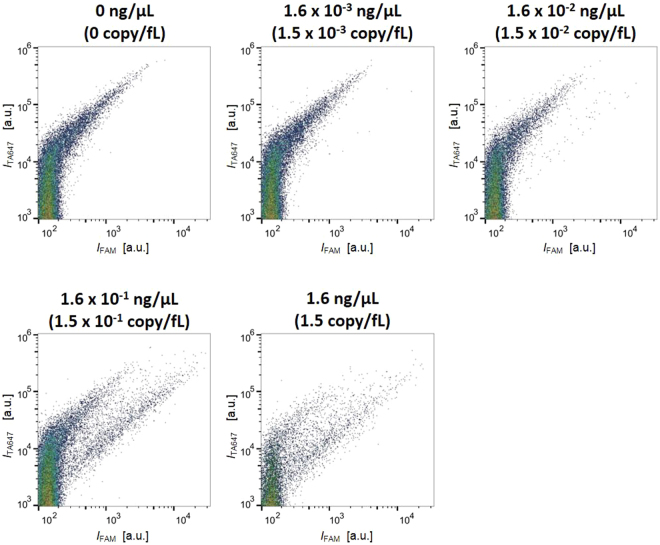
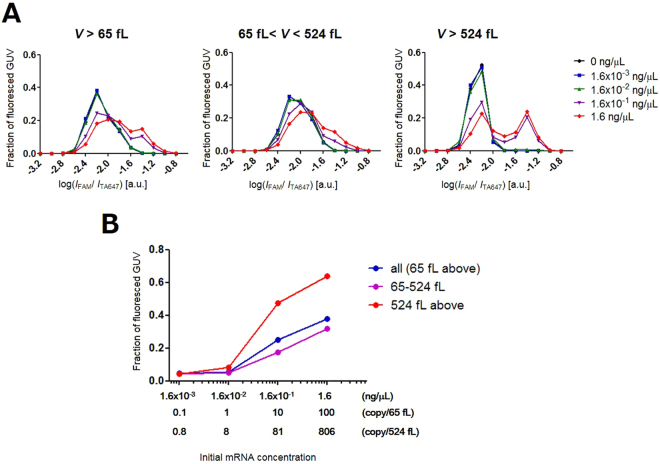
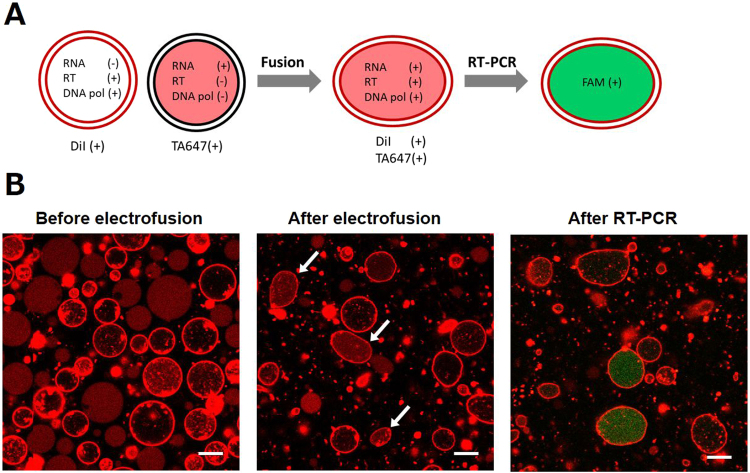
We assessed the applicability of giant unilamellar vesicles (GUVs) for RNA detection using in vesicle reverse transcription polymerase chain reaction (RT-PCR). We prepared GUVs that encapsulated one-pot RT-PCR reaction mixture including template RNA, primers, and Taqman probe, using water-in-oil emulsion transfer method. After thermal cycling, we analysed the GUVs that exhibited intense fluorescence signals, which represented the cDNA amplification. The detailed analysis of flow cytometry data demonstrated that rRNA and mRNA in the total RNA can be amplified from 10-100 copies in the GUVs with 5-10 μm diameter, although the fraction of reactable GUV was approximately 60% at most. Moreover, we report that the target RNA, which was directly transferred into the GUV reactors via membrane fusion, can be amplified and detected using in vesicle RT-PCR. These results suggest that the GUVs can be used as biomimetic reactors capable of performing PCR and RT-PCR, which are important in analytical and diagnostic applications with additional functions.
Conflict of interest statement
The authors declare no competing interests.
Figures
Similar articles
-
Production of giant unilamellar vesicles by the water-in-oil emulsion-transfer method without high internal concentrations of sugars.J Biosci Bioeng. 2018 Oct;126(4):540-545. doi: 10.1016/j.jbiosc.2018.04.019. Epub 2018 May 21. J Biosci Bioeng. 2018. PMID: 29793863
-
A membrane filtering method for the purification of giant unilamellar vesicles.Chem Phys Lipids. 2011 Jul;164(5):351-8. doi: 10.1016/j.chemphyslip.2011.04.003. Epub 2011 Apr 15. Chem Phys Lipids. 2011. PMID: 21524642
-
Effects of Sugars on Giant Unilamellar Vesicle Preparation, Fusion, PCR in Liposomes, and Pore Formation.Langmuir. 2022 Jul 26;38(29):8871-8880. doi: 10.1021/acs.langmuir.2c00989. Epub 2022 Jul 14. Langmuir. 2022. PMID: 35836326
-
Advances in giant unilamellar vesicle preparation techniques and applications.Adv Colloid Interface Sci. 2023 Aug;318:102935. doi: 10.1016/j.cis.2023.102935. Epub 2023 Jun 7. Adv Colloid Interface Sci. 2023. PMID: 37320960 Review.
-
Real-time reverse transcription polymerase chain reaction to measure mRNA: use, limitations, and presentation of results.Anat Rec (Hoboken). 2012 Jan;295(1):1-3. doi: 10.1002/ar.21487. Epub 2011 Nov 18. Anat Rec (Hoboken). 2012. PMID: 22095866 Review. No abstract available.
Cited by
-
Microfluidics for Artificial Life: Techniques for Bottom-Up Synthetic Biology.Micromachines (Basel). 2019 Apr 30;10(5):299. doi: 10.3390/mi10050299. Micromachines (Basel). 2019. PMID: 31052344 Free PMC article. Review.
-
Is Research on "Synthetic Cells" Moving to the Next Level?Life (Basel). 2018 Dec 26;9(1):3. doi: 10.3390/life9010003. Life (Basel). 2018. PMID: 30587790 Free PMC article.
-
Gene-Expressing Liposomes as Synthetic Cells for Molecular Communication Studies.Front Bioeng Biotechnol. 2019 Jan 17;7:1. doi: 10.3389/fbioe.2019.00001. eCollection 2019. Front Bioeng Biotechnol. 2019. PMID: 30705882 Free PMC article. Review.
-
Colony-like Protocell Superstructures.ACS Nano. 2023 Feb 28;17(4):3368-3382. doi: 10.1021/acsnano.2c08093. Epub 2023 Feb 16. ACS Nano. 2023. PMID: 36795609 Free PMC article.
-
Preparation and biomedical applications of artificial cells.Mater Today Bio. 2023 Nov 24;23:100877. doi: 10.1016/j.mtbio.2023.100877. eCollection 2023 Dec. Mater Today Bio. 2023. PMID: 38075249 Free PMC article. Review.
References
Publication types
MeSH terms
Substances
LinkOut - more resources
Full Text Sources
Other Literature Sources
