. 2018 Jun 15;19(1):463.
doi: 10.1186/s12864-018-4835-2.

Development and application of an integrated allele-specific pipeline for methylomic and epigenomic analysis (MEA)

Affiliations

Development and application of an integrated allele-specific pipeline for methylomic and epigenomic analysis (MEA)

Julien Richard Albert et al. BMC Genomics. .

Abstract

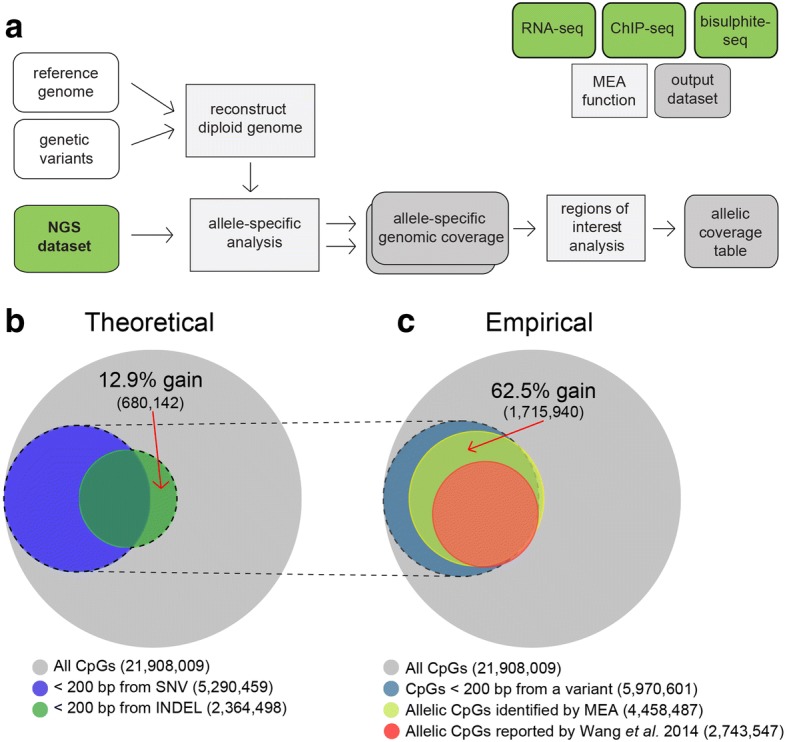
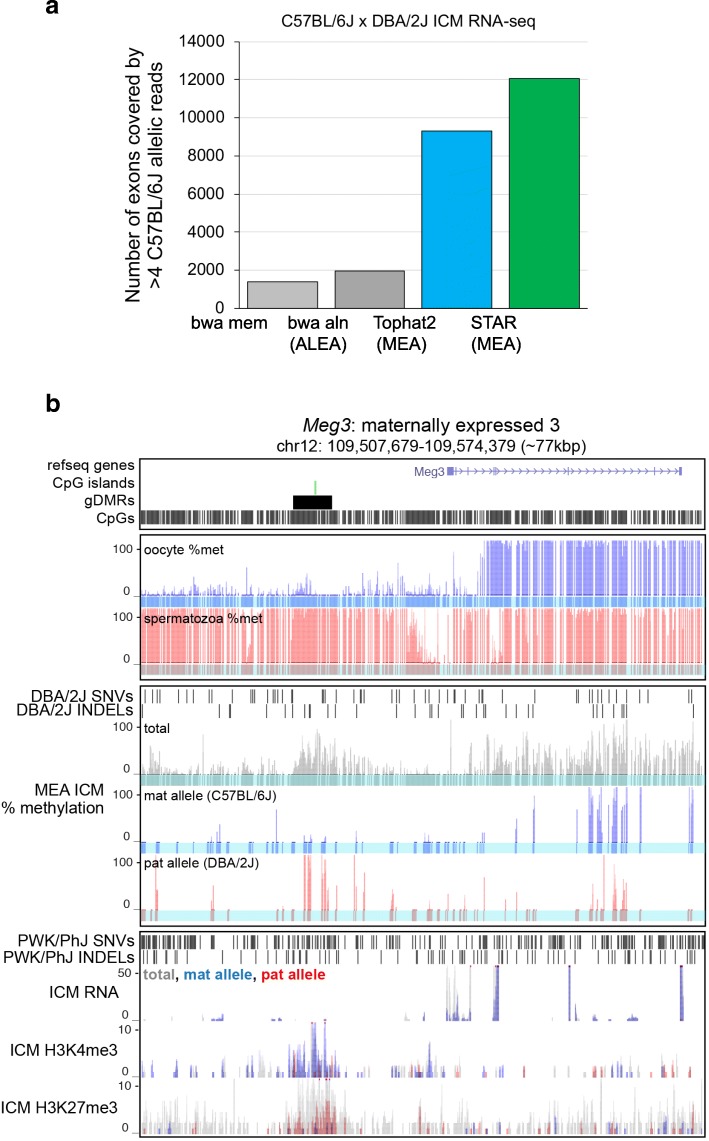
Background: Allele-specific transcriptional regulation, including of imprinted genes, is essential for normal mammalian development. While the regulatory regions controlling imprinted genes are associated with DNA methylation (DNAme) and specific histone modifications, the interplay between transcription and these epigenetic marks at allelic resolution is typically not investigated genome-wide due to a lack of bioinformatic packages that can process and integrate multiple epigenomic datasets with allelic resolution. In addition, existing ad-hoc software only consider SNVs for allele-specific read discovery. This limitation omits potentially informative INDELs, which constitute about one fifth of the number of SNVs in mice, and introduces a systematic reference bias in allele-specific analyses.

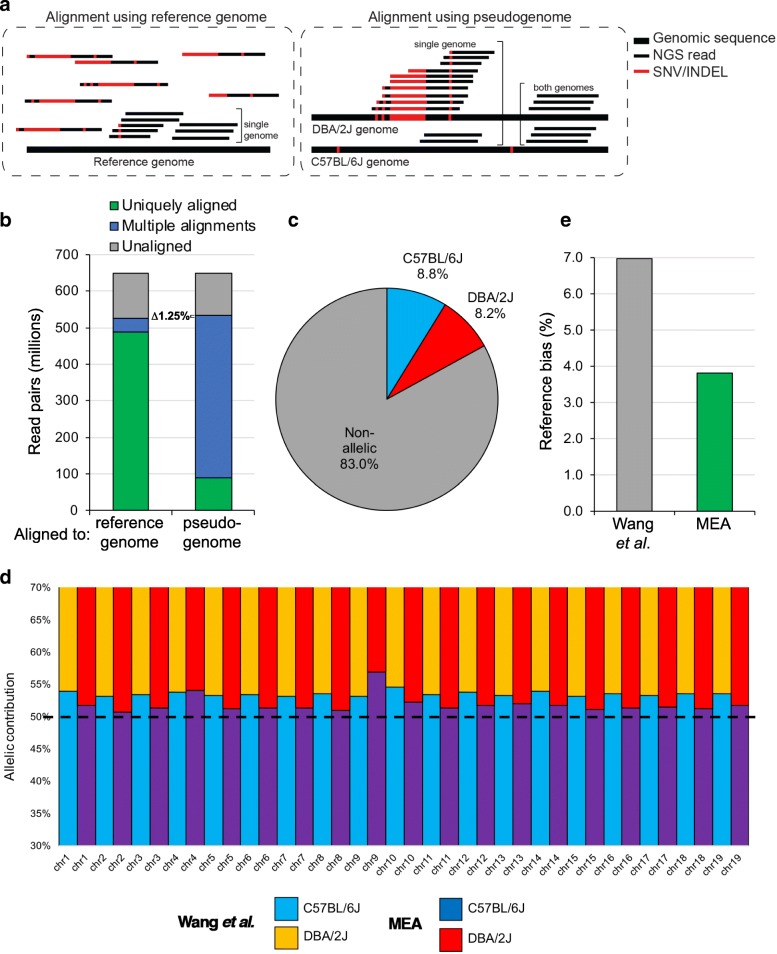
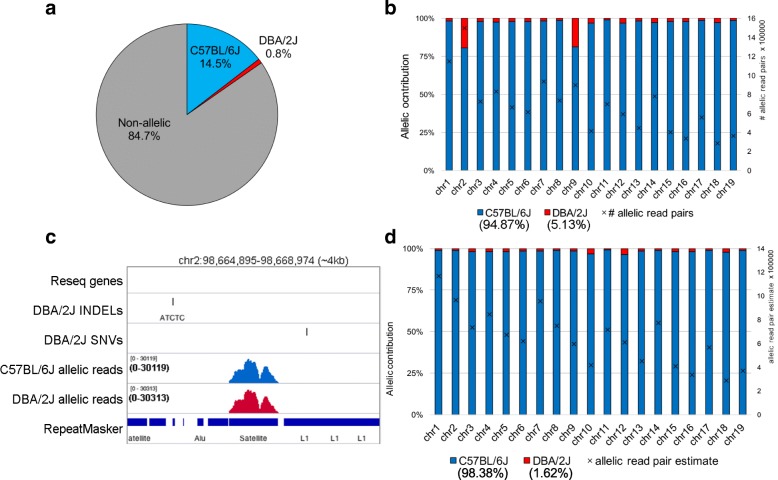
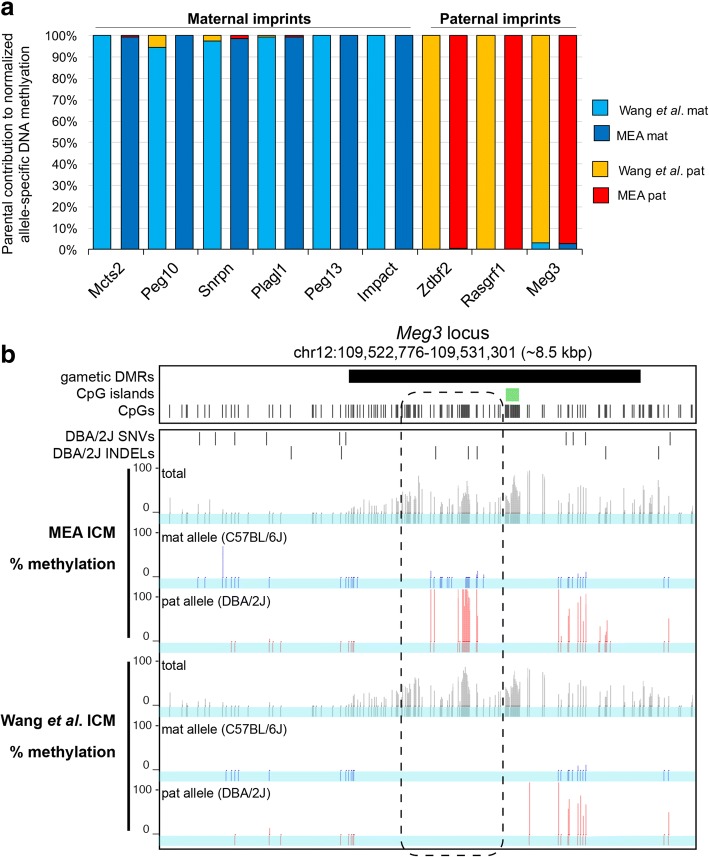
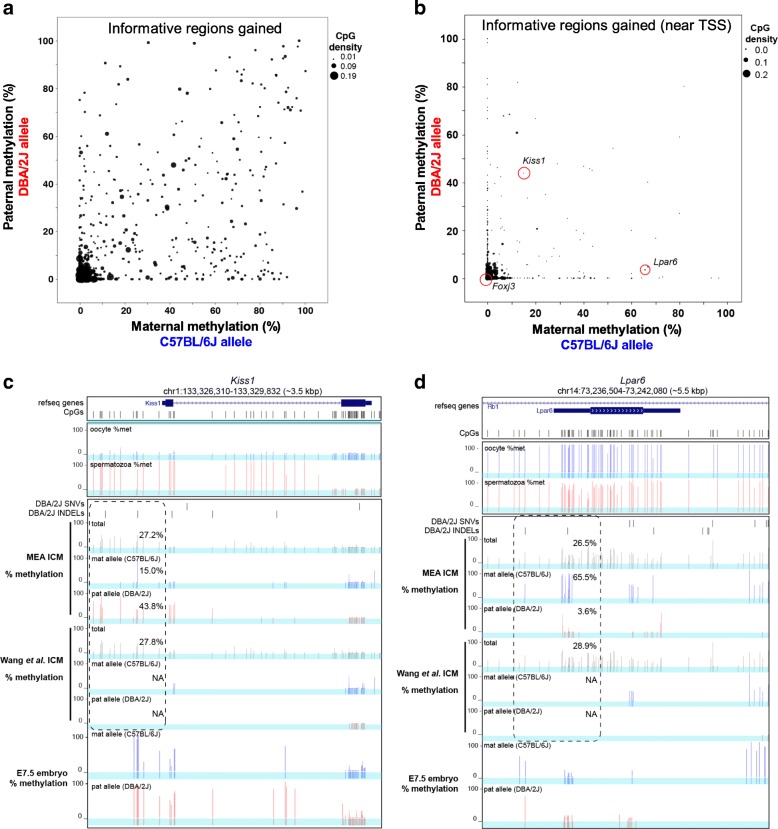
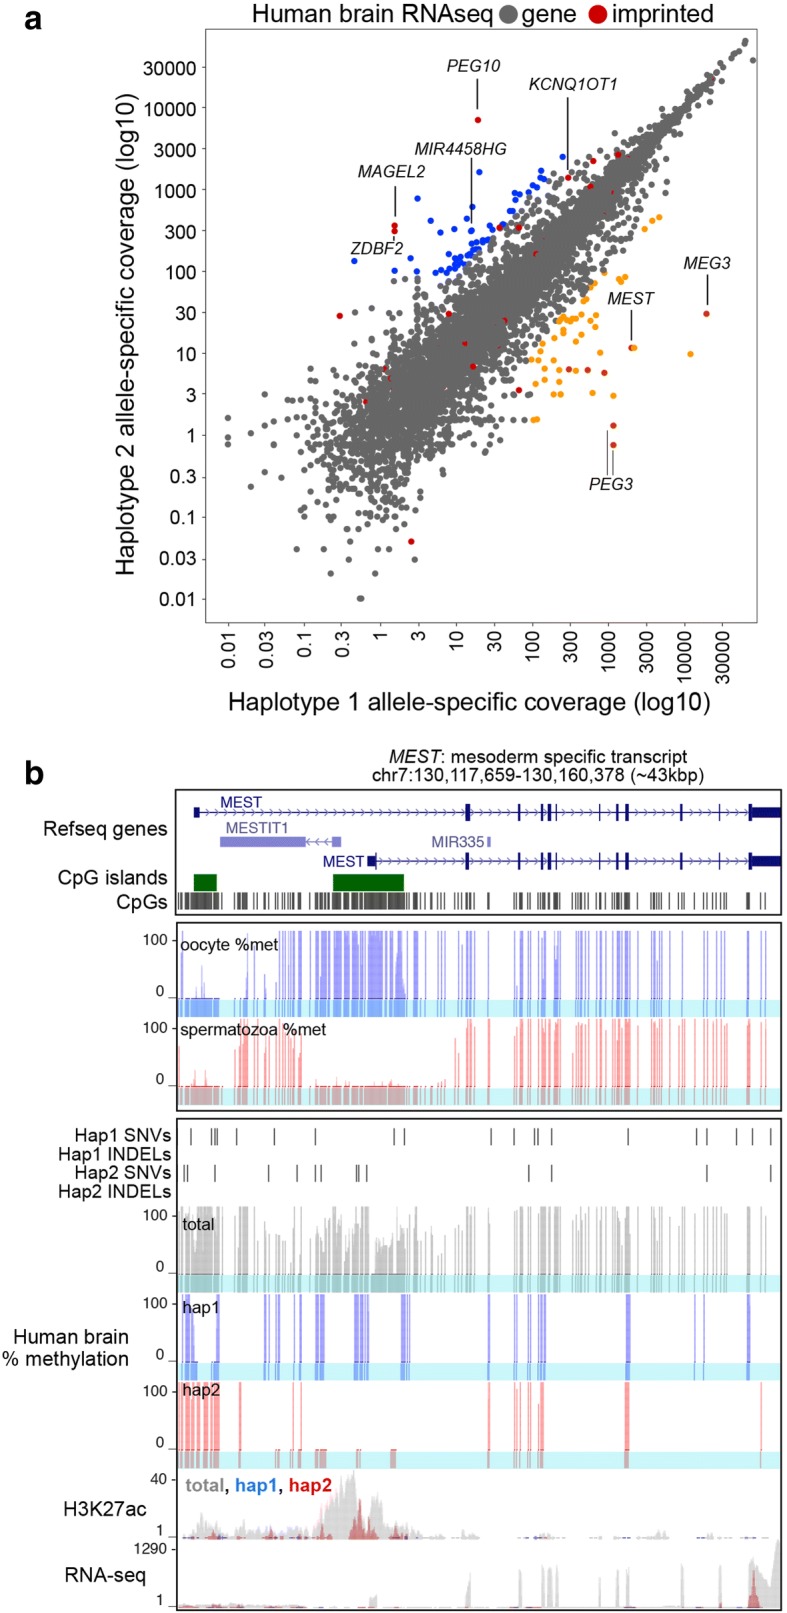
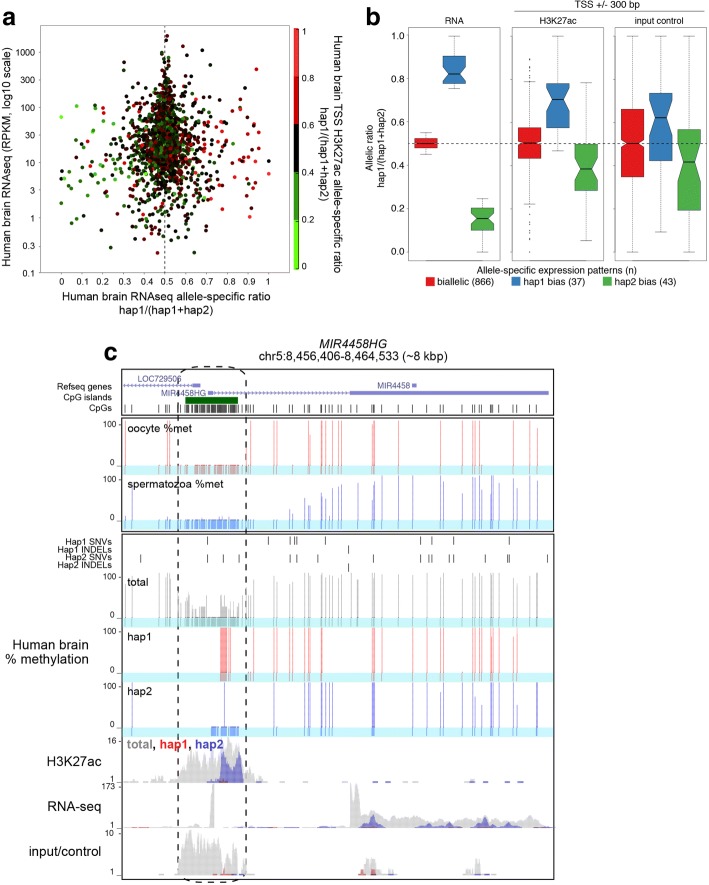
Results: Here, we describe MEA, an INDEL-aware Methylomic and Epigenomic Allele-specific analysis pipeline which enables user-friendly data exploration, visualization and interpretation of allelic imbalance. Applying MEA to mouse embryonic datasets yields robust allele-specific DNAme maps and low reference bias. We validate allele-specific DNAme at known differentially methylated regions and show that automated integration of such methylation data with RNA- and ChIP-seq datasets yields an intuitive, multidimensional view of allelic gene regulation. MEA uncovers numerous novel dynamically methylated loci, highlighting the sensitivity of our pipeline. Furthermore, processing and visualization of epigenomic datasets from human brain reveals the expected allele-specific enrichment of H3K27ac and DNAme at imprinted as well as novel monoallelically expressed genes, highlighting MEA's utility for integrating human datasets of distinct provenance for genome-wide analysis of allelic phenomena.

Conclusions: Our novel pipeline for standardized allele-specific processing and visualization of disparate epigenomic and methylomic datasets enables rapid analysis and navigation with allelic resolution. MEA is freely available as a Docker container at https://github.com/julienrichardalbert/MEA .

Keywords: Allele-specific; Allelic; ChIP; ChIP-seq; Chromatin immunoprecipitation; Epigenomics; Imprinting; MEA; RNA-seq; WGBS; Whole genome bisulphite-sequencing.


Conflict of interest statement

Ethics approval and consent to participate

Not applicable.

Competing interests

The authors declare that they have no competing interests.

Publisher’s Note

Springer Nature remains neutral with regard to jurisdictional claims in published maps and institutional affiliations.

Figures

Fig. 1
Fig. 1
A bioinformatics toolkit for allele-specific epigenomic analysis. a MEA pipeline flow chart. Supplied with a reference genome assembly and relevant genetic variants, MEA first reconstructs a diploid pseudogenome. Subsequently, allele-specific analysis is performed on the input gene expression (RNA-seq), histone PTM (ChIP-seq) or DNAme (WGBS) data in FASTQ format. MEA calculates allelic imbalance values using the resulting allele-specific genomic coverage files and generates a tab-delimited table for the user-defined regions of interest. Mouse and human exon, gene body and transcription start site coordinates are provided to facilitate analyses of such regions. b Venn diagram showing the theoretical number of CpG dinucleotides for which allele-specific DNAme levels can be calculated using C57BL/6 J and DBA/2 J SNVs (blue) or INDELs (green) alone. CpGs for which allelic information can theoretically be extracted are defined as those that fall within 200 bp (an insert size typical of WGBS libraries) of a genetic variant. c Venn diagram showing the observed number of C57BL/6 J-specific CpG dinucleotides for which allele-specific DNAme levels were calculated using MEA (yellow) versus an INDEL-agnostic contemporary allele-specific DNAme script [11] using the same dataset (red)
Fig. 2
Fig. 2
Empirical benchmarking of allele-specific read alignment reveals reduced reference bias. a Graphical representation of MEA’s unified strategy for detecting allele-specific reads from RNA-, ChIP-seq and WGBS datasets. Aligning F1 hybrid reads to a pseudogenome enables alignment to their cognate genome even when originating from highly variable loci. b Paired-end WGBS reads (101 bp) from a previously published dataset of C57BL/6 J x DBA/2 J ICM cells [11] were aligned using the Bismark aligner to the (haploid) reference genome (mm10 build) and a MEA-constructed diploid pseudogenome. When using MEA, multiple (2 or more) alignments reflect non-allelic reads, while uniquely aligned reads are allele-specific. Reads aligning uniquely to the pseudogenome were extracted and retroactively assigned to their parental haplotype. c The percentages of allele-specific reads called for each parental haplotype and the number of aligned reads that did not overlap with a genetic variant (non-allelic) is shown. d Allelic contribution of read alignments to each parental haplotype (C57BL/6 J or DBA/2 J) on each autosome. Relative to the script employed by Wang et al. [11], MEA displays about half the reference bias on the majority of autosomes. e Global reference bias for each pipeline is shown
Fig. 3
Fig. 3
Quantifying allele-specific alignment error rates. To estimate the rate of false-positive errors for allelic analysis of DNAme data, WGBS reads generated from C57BL/6 J mice [11] were aligned to the MEA-generated C57BL/6 J x DBA/2 J pseudogenome, and the percentage of DBA/2 J-specific read alignments was scored. The expected allelic contribution from C57BL/6 J is 100%, as these cells are of C57BL/6 J origin. a The percentages of reads aligning uniquely to the C57BL/6 J and DBA/2 J (false-positive) pseudogenomes, as well as the number of aligned reads that did not overlap with a genetic variant (non-allelic) is shown. b The false-positive alignment rate for each autosome, along with the total number of aligned allelic read pairs, is shown. c Genome browser screenshot of a locus that displays a high rate of false-positive allele-specific alignment to a repeat annotated as Satellite DNA by RepeatMasker and devoid of genetic variants. d To assess the false-positive rate exclusive of repetitive Satellite DNA, allele-specific read alignments over these Repbase annotated repetitive sequences, as recognized by RepeatMasker, were culled and the rate of false-positive allele-specific alignments recalculated over each autosome as in (b)
Fig. 4
Fig. 4
Validation of allele-specific DNA methylation level calculations over known gDMRs. C57BL/6 J x DBA/2 J ICM WGBS reads were processed in parallel with MEA and a published pipeline [11] using identical parameters. a Allelic methylation levels over 9 known gDMRs are shown for both pipelines. b UCSC genome browser screenshot of the Meg3 gDMR including the allele-agnostic percentage of DNAme calculated using each pipeline (total) as well as allelic calls for each informative CpG. The location of each informative CpG for each pipeline (blue tracks) is also included. Only MEA detects allele-specific reads in a region within the gDMR that lacks SNVs but contains several INDELs (dashed box). A summary of the total number of allelic CpG counts and DNAme levels over this locus is included in Table 1
Fig. 5
Fig. 5
Identification of novel DMRs using the MEA pipeline. Allele-specific DNAme levels were calculated over 133,065 regions containing INDELs but lacking SNVs (representing novel informative regions gained employing MEA) using C57BL/6 J x DBA/2 J ICM WGBS data [11]. a Maternal versus paternal DNAme levels and CpG density (data point size) are plotted for informative regions overlapping with at least 10 CpGs from which allele-specific DNAme levels can be ascertained (746 data points). b CpG density (data point size) and allele-specific DNAme levels are shown, as in (a) over the subset of novel informative regions +/− 200 bp from annotated TSSs (with at least five informative CpGs on both alleles). Representative novel informative regions for which screenshots are provided are circled in red. c-d UCSC genome browser screenshots of differentially methylated regions (dashed boxes) near the promoters of the Kiss1 and Lpar6 genes. Tracks from Wang et al. [11] are included to illustrate differences in pipeline sensitivity. DNAme tracks of male and female germ cells [25, 26] as well as E7.5 embryos [11] are also shown, along with the location of informative CpGs (highlighted in blue)
Fig. 6
Fig. 6
Validation of allele-specific transcription level calculations and integration with ChIP-seq and WGBS datasets at allelic resolution. MEA was extended to accommodate contemporary RNA-seq aligners and to automatically organize allelic and total genomic tracks into UCSC Track Hubs to aid data visualization and interpretation. a The number of annotated genic exons covered by allelic reads using BWA, Tophat2 and STAR aligners is shown for an RNA-seq dataset generated from C57BL/6 J x DBA/2 J ICM cells [48]. b UCSC genome browser screenshot of the Meg3 gDMR and downstream gene using the default MEA output for visualization of allelic (WGBS, RNA- and ChIP-seq) data. MEA automatically generates composite tracks containing total (allele-agnostic, grey), reference (blue) and non-reference (red) genomic tracks for visualization of allelic RNA- and ChIP-seq datasets. Bottom three tracks show MEA output from previously published C57BL/6 J x PWK/PhJ F1 ICM ChIP-seq data [13, 47]
Fig. 7
Fig. 7
Allelic integration of RNA-, ChIP-seq and WGBS datasets from human brain. a Analysis of allele-specific gene expression using RNA-seq data from adult human brain. Imprinted genes are highlighted in red and monoallelically expressed genes (defined by total expression (RPKM > 1), allele-specific coverage (mapped reads > 100) and expression bias (> 90% of transcript levels from one allele)) are highlighted in blue and orange. MEST, an imprinted gene, is highly expressed in brain and shows the expected allelic bias. b UCSC genome browser screenshot of the MEST locus showing allele-agnostic (total) and allele-specific (blue and red) DNAme levels in adult brain. DNAme levels in gametes (oocyte & spermatozoa) are also shown [49]. RNA-seq and H3K27ac ChIP-seq data from human brain were integrated using MEA and allele-agnostic (total) as well as allele-specific coverage is shown for each. Note that only the expressed allele, haplotype 2 (hap2) is unmethylated and enriched for H3K27ac. Also see Additional file 2: Table S2
Fig. 8
Fig. 8
Allele-specific transcription, H3K27ac and DNA methylation at the MIR4458HG locus. a Integration of allele-specific gene expression and promoter H3K27ac enrichment using human brain RNA-seq and matched ChIP-seq datasets. Only transcripts with informative allele-specific RNA-seq coverage over exons and ChIP-seq coverage over TSSs (+/− 300 bp) are shown (n = 1759). b Distribution of H3K27ac and input/control allelic ratios at TSSs of transcripts expressed from one or both alleles. Note the allelic ratio bias even in the input control. c UCSC genome browser screenshot of the MIR4458HG locus. Only the expressed allele (hap2) is enriched for H3K27ac and hypomethylated at the CpG island promoter

Similar articles

Cited by

References

    1. Holliday R. Genomic imprinting and allelic exclusion. Development. 1990;108(Supplement):125–129. - PubMed
    1. Pinheiro I, Heard E. X chromosome inactivation: new players in the initiation of gene silencing. F1000Research. 2017;6:344. doi: 10.12688/f1000research.10707.1. - DOI - PMC - PubMed
    1. Goncalves A, Leigh-Brown S, Thybert D, Stefflova K, Turro E, Flicek P, et al. Extensive compensatory cis-trans regulation in the evolution of mouse gene expression. Genome research. Cold Spring Harbor Lab. 2012;22(12):2376–2384. - PMC - PubMed
    1. Turro E, Su S-Y, Goncalves A, Coin LJM, Richardson S, Lewin A. Haplotype and isoform specific expression estimation using multi-mapping RNA-seq reads. Genome Biology BioMed Central Ltd. 2011;12(2):R13. doi: 10.1186/gb-2011-12-2-r13. - DOI - PMC - PubMed
    1. Harvey CT, Moyerbrailean GA, Davis GO, Wen X, Luca F, Pique-Regi R. QuASAR: quantitative allele-specific analysis of reads. Bioinformatics Oxford University Press. 2014;31(8):btu802–bt1242. - PMC - PubMed

Publication types