

Laquinimod protects the optic nerve and retina in an experimental autoimmune encephalomyelitis model
- PMID: 29903027
- PMCID: PMC6002998
- DOI: 10.1186/s12974-018-1208-3
Laquinimod protects the optic nerve and retina in an experimental autoimmune encephalomyelitis model
Abstract
Background: The oral immunomodulatory agent laquinimod is currently evaluated for multiple sclerosis (MS) treatment. Phase II and III studies demonstrated a reduction of degenerative processes. In addition to anti-inflammatory effects, laquinimod might have neuroprotective properties, but its impact on the visual system, which is often affected by MS, is unknown. The aim of our study was to investigate potential protective effects of laquinimod on the optic nerve and retina in an experimental autoimmune encephalomyelitis (EAE) model.
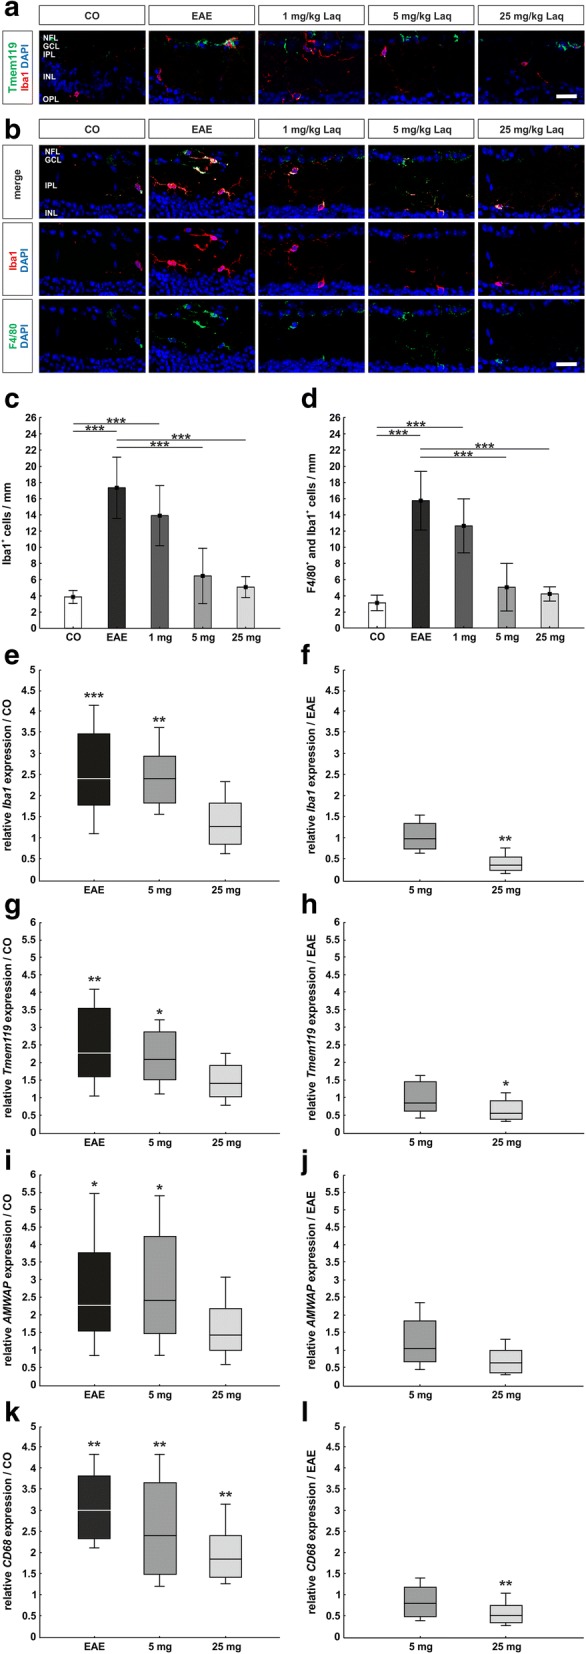
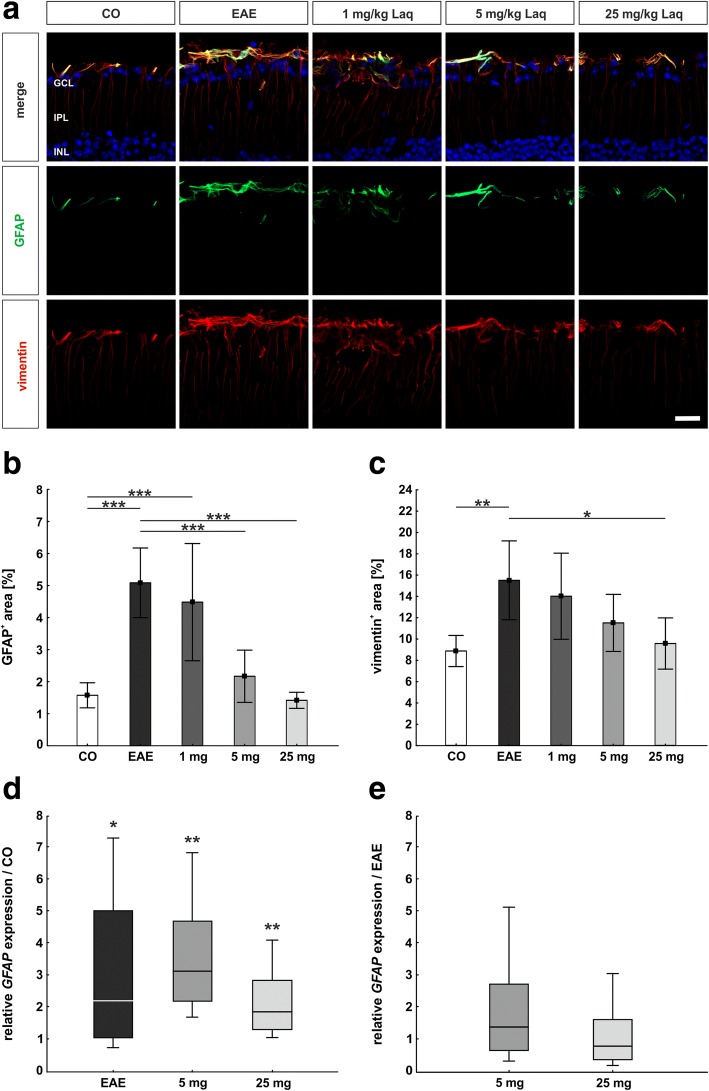
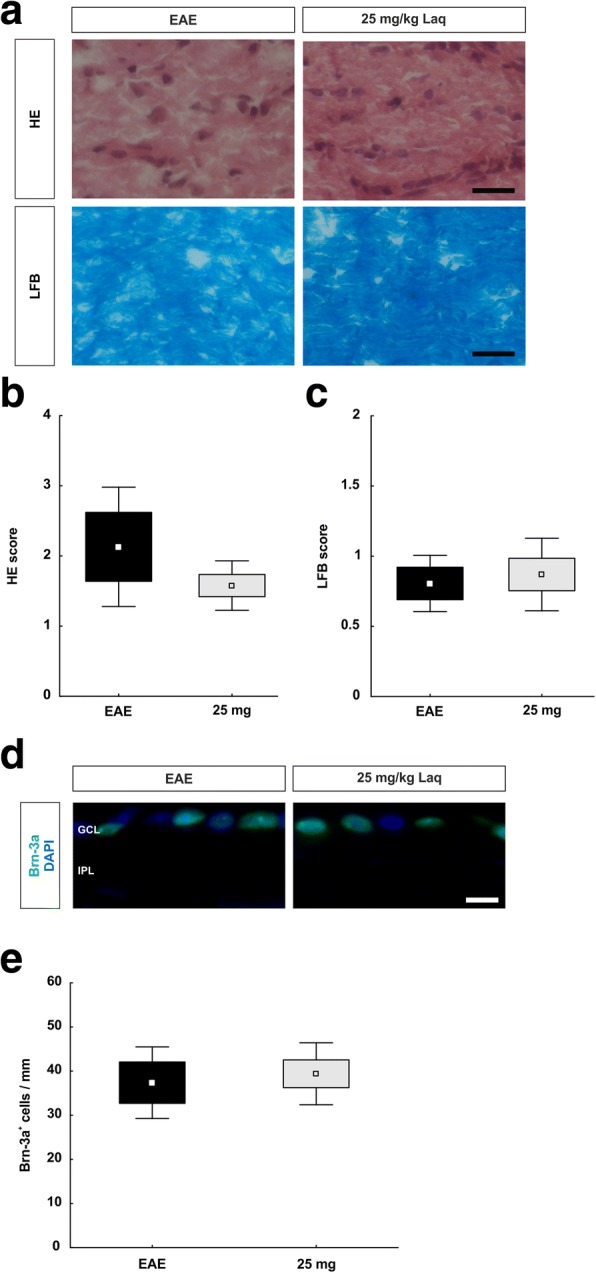
Methods: We induced EAE in C57/BL6 mice via MOG35-55 immunization. Animals were divided into an untreated EAE group, three EAE groups receiving laquinimod (1, 5, or 25 mg/kg daily), starting the day post-immunization, and a non-immunized control group. Thirty days post-immunization, scotopic electroretinograms were carried out, and mice were sacrificed for histopathology (HE, LFB), immunohistochemistry (MBP, Iba1, Tmem119, F4/80, GFAP, vimentin, Brn-3a, cleaved caspase 3) of the optic nerve and retina, and retinal qRT-PCR analyses (Brn-3a, Iba1, Tmem119, AMWAP, CD68, GFAP). To evaluate the effect of a therapeutic approach, EAE animals were treated with 25 mg/kg laquinimod from day 16 when 60% of the animals had developed clinical signs of EAE.
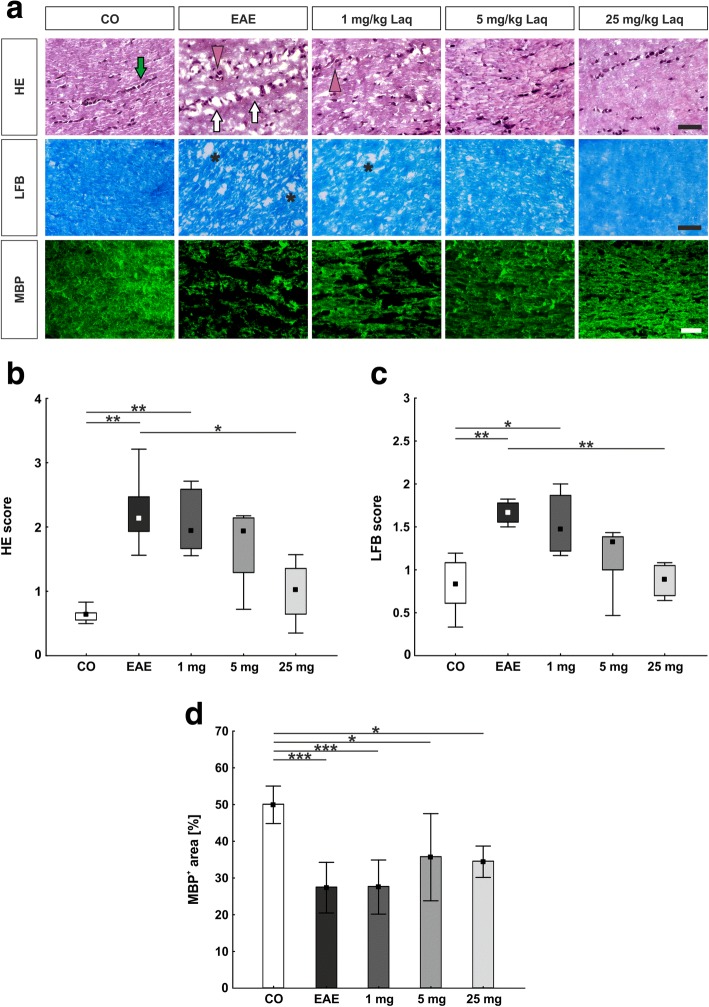
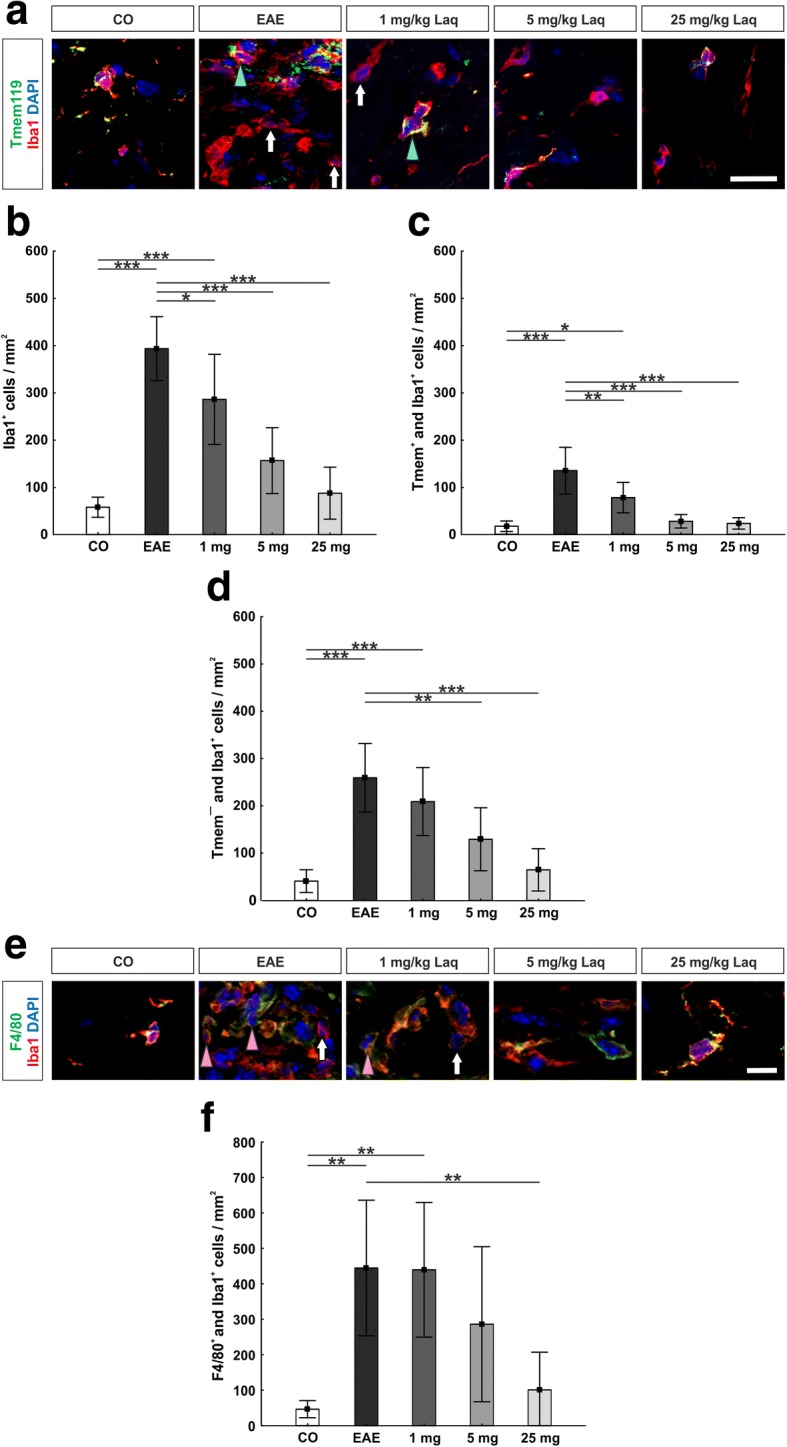
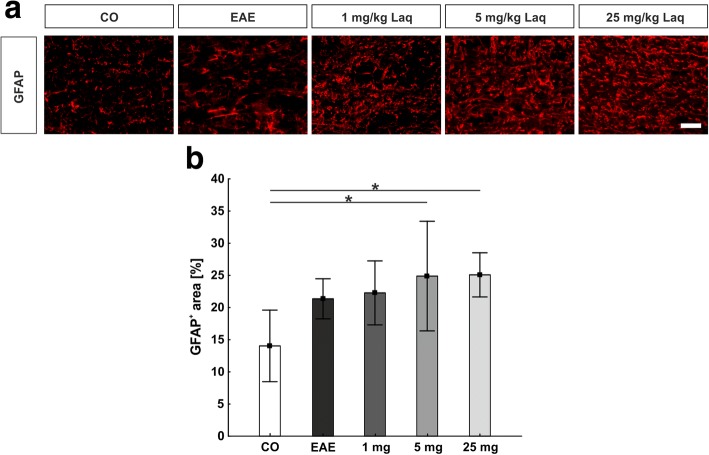
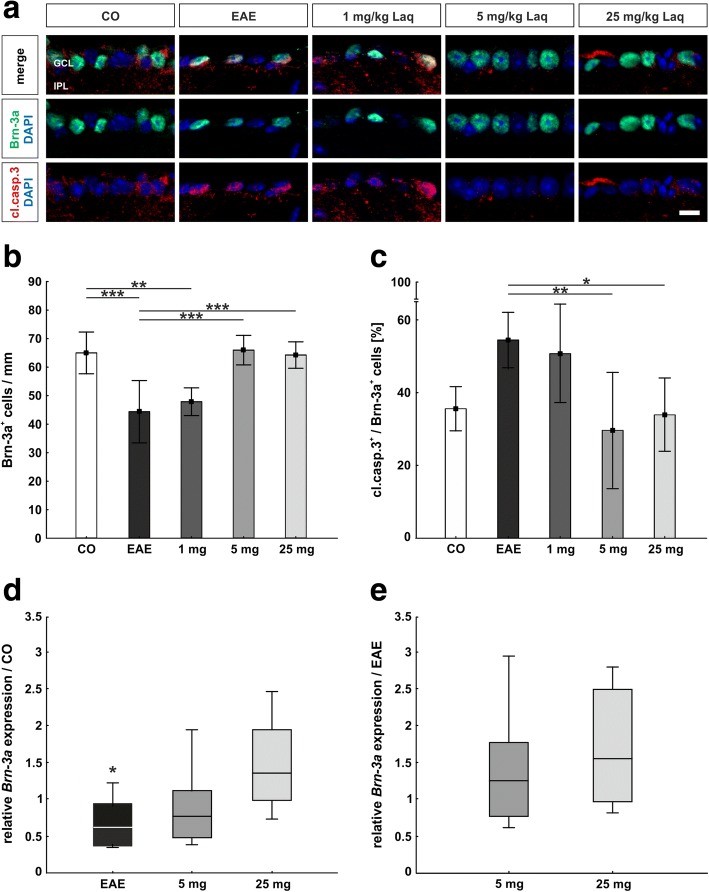
Results: Laquinimod reduced neurological EAE symptoms and improved the neuronal electrical output of the inner nuclear layer compared to untreated EAE mice. Furthermore, cellular infiltration, especially recruited phagocytes, and demyelination in the optic nerve were reduced. Microglia were diminished in optic nerve and retina. Retinal macroglial signal was reduced under treatment, whereas in the optic nerve macroglia were not affected. Additionally, laquinimod preserved retinal ganglion cells and reduced apoptosis. A later treatment with laquinimod in a therapeutic approach led to a reduction of clinical signs and to an improved b-wave amplitude. However, no changes in cellular infiltration and demyelination of the optic nerves were observed. Also, the number of retinal ganglion cells remained unaltered.
Conclusion: From our study, we deduce neuroprotective and anti-inflammatory effects of laquinimod on the optic nerve and retina in EAE mice, when animals were treated before any clinical signs were noted. Given the fact that the visual system is frequently affected by MS, the agent might be an interesting subject of further neuro-ophthalmic investigations.
Keywords: Demyelination; EAE; Electroretinogram; Glia response; Inflammation; Laquinimod; Multiple sclerosis; Optic nerve; Protection; Retinal degeneration.
Conflict of interest statement
Ethics approval and consent to participate
Not applicable.
Competing interests
SF received travel grants from Biogen Idec and Genzyme, none related to this manuscript.
RG serves on scientific advisory boards for Teva Pharmaceutical Industries Ltd., Biogen Idec, Bayer Schering Pharma, and Novartis; has received speaker honoraria from Biogen Idec, Teva Pharmaceutical Industries Ltd., Bayer Schering Pharma, and Novartis; serves as an editor for Therapeutic Advances in Neurological Diseases and on the editorial boards of Experimental Neurology and the Journal of Neuroimmunology; and receives research support from Teva Pharmaceutical Industries Ltd., Biogen Idec, Bayer Schering Pharma, Genzyme, Merck Serono, and Novartis, which are not related to this manuscript.
IK received honoraria for consultancy or speaking and travel reimbursement from Bayer Healthcare, Chugai, Merck, Roche, and Shire and grant support from Affectis, Biogen, Chugai and Diamed, all not related to this manuscript. The other authors declare that they have no competing interests.
Publisher’s Note
Springer Nature remains neutral with regard to jurisdictional claims in published maps and institutional affiliations.
Figures


Similar articles
-
Microglia response in retina and optic nerve in chronic experimental autoimmune encephalomyelitis.J Neuroimmunol. 2016 Sep 15;298:32-41. doi: 10.1016/j.jneuroim.2016.06.008. Epub 2016 Jun 23. J Neuroimmunol. 2016. PMID: 27609273
-
Inflammatory demyelination induces glia alterations and ganglion cell loss in the retina of an experimental autoimmune encephalomyelitis model.J Neuroinflammation. 2013 Oct 4;10:120. doi: 10.1186/1742-2094-10-120. J Neuroinflammation. 2013. PMID: 24090415 Free PMC article.
-
Exploring experimental autoimmune optic neuritis using multimodal imaging.Neuroimage. 2018 Jul 15;175:327-339. doi: 10.1016/j.neuroimage.2018.04.004. Epub 2018 Apr 6. Neuroimage. 2018. PMID: 29627590
-
Laquinimod, an up-and-coming immunomodulatory agent for treatment of multiple sclerosis.Exp Neurol. 2014 Dec;262 Pt A:66-71. doi: 10.1016/j.expneurol.2014.04.002. Epub 2014 Apr 13. Exp Neurol. 2014. PMID: 24731945 Free PMC article. Review.
-
Chronic experimental autoimmune encephalomyelitis is an excellent model to study neuroaxonal degeneration in multiple sclerosis.Front Mol Neurosci. 2022 Oct 19;15:1024058. doi: 10.3389/fnmol.2022.1024058. eCollection 2022. Front Mol Neurosci. 2022. PMID: 36340686 Free PMC article. Review.
Cited by
-
Synthesis, Characterization, and in vivo Evaluation of a Novel Potent Autotaxin-Inhibitor.Front Pharmacol. 2022 Jan 18;12:699535. doi: 10.3389/fphar.2021.699535. eCollection 2021. Front Pharmacol. 2022. PMID: 35126098 Free PMC article.
-
Laquinimod Supports Remyelination in Non-Supportive Environments.Cells. 2019 Oct 31;8(11):1363. doi: 10.3390/cells8111363. Cells. 2019. PMID: 31683658 Free PMC article.
-
In a novel autoimmune and high-pressure glaucoma model a complex immune response is induced.Front Immunol. 2024 Mar 7;15:1296178. doi: 10.3389/fimmu.2024.1296178. eCollection 2024. Front Immunol. 2024. PMID: 38515755 Free PMC article.
-
Scoring disease in an animal model of multiple sclerosis using a novel infrared-based automated activity-monitoring system.Sci Rep. 2019 Dec 16;9(1):19194. doi: 10.1038/s41598-019-55713-7. Sci Rep. 2019. PMID: 31844134 Free PMC article.
-
Deletion of Arginase 2 Ameliorates Retinal Neurodegeneration in a Mouse Model of Multiple Sclerosis.Mol Neurobiol. 2019 Dec;56(12):8589-8602. doi: 10.1007/s12035-019-01691-w. Epub 2019 Jul 6. Mol Neurobiol. 2019. PMID: 31280447 Free PMC article.
References
MeSH terms
Substances
LinkOut - more resources
Full Text Sources
Other Literature Sources
Research Materials
Miscellaneous
