

Integrative Analysis of Proteome and Ubiquitylome Reveals Unique Features of Lysosomal and Endocytic Pathways in Gefitinib-Resistant Non-Small Cell Lung Cancer Cells
- PMID: 29901268
- PMCID: PMC6099292
- DOI: 10.1002/pmic.201700388
Integrative Analysis of Proteome and Ubiquitylome Reveals Unique Features of Lysosomal and Endocytic Pathways in Gefitinib-Resistant Non-Small Cell Lung Cancer Cells
Abstract
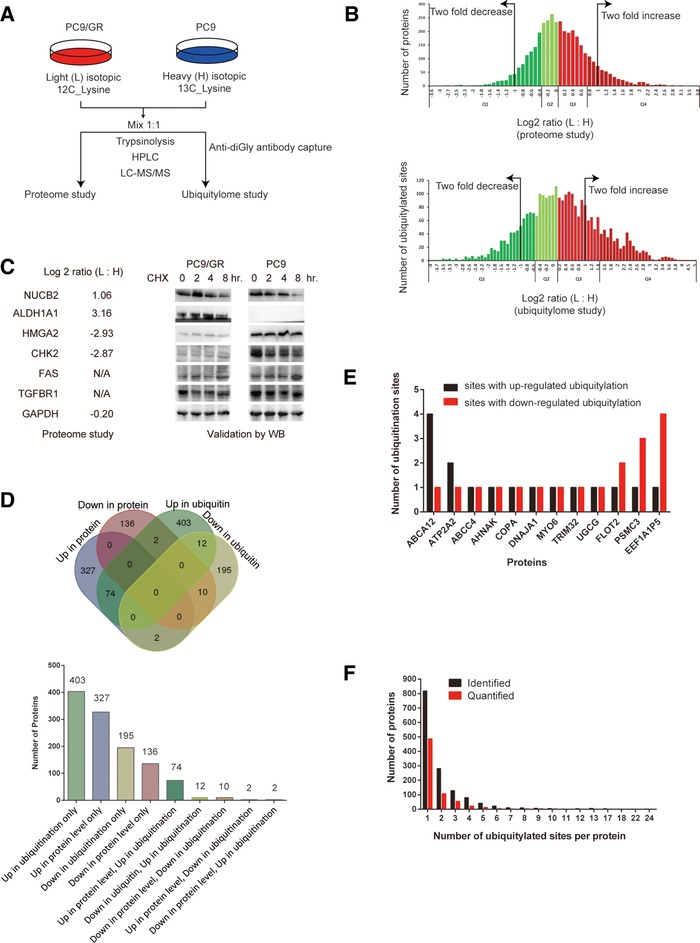
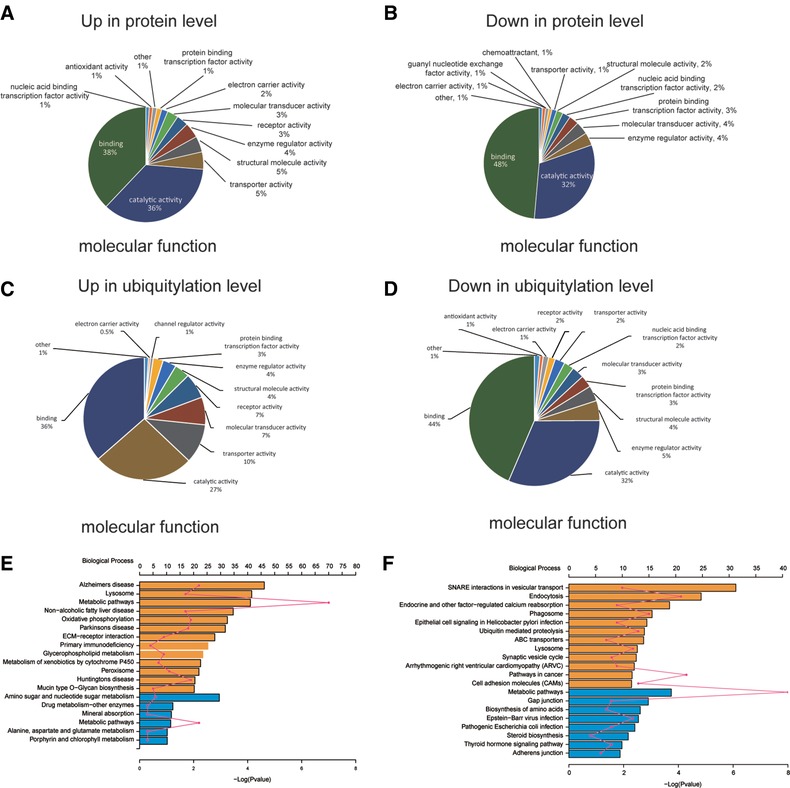
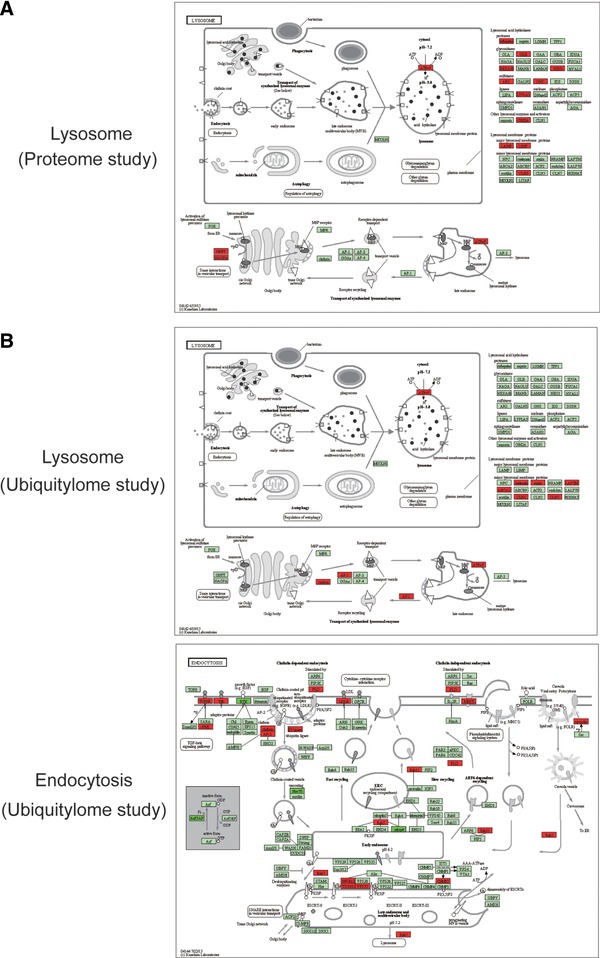
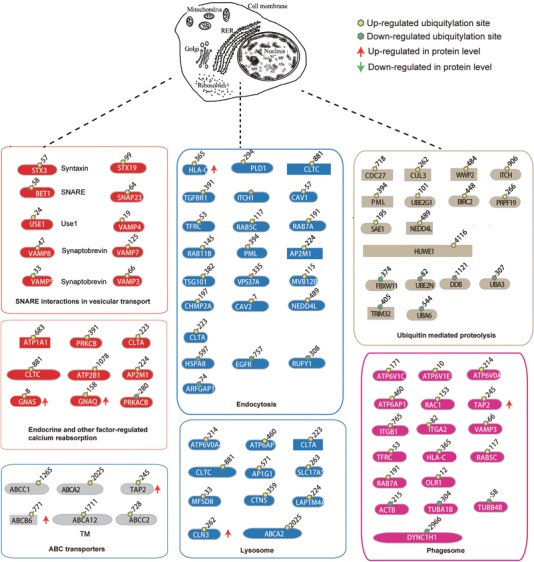
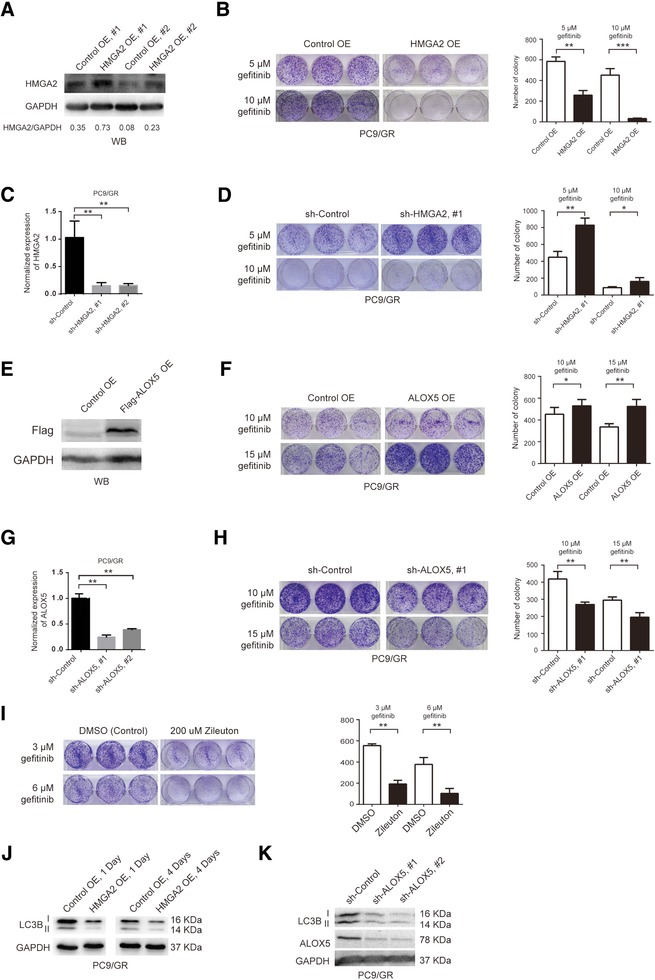
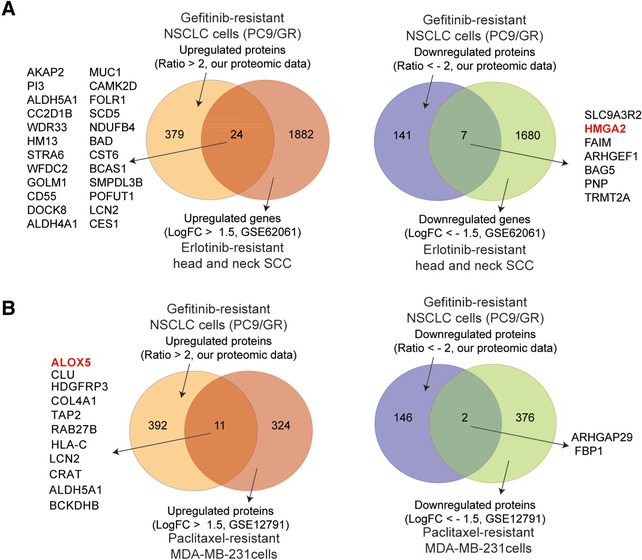
Non-small cell lung cancer (NSCLC) patients carrying EGFR activating mutations treated with gefitinib, a tyrosine kinase inhibitor, will develop drug resistance. Ubiquitylation is one of major posttranslational modifications of proteins affecting the stability or function of proteins. However, the role of protein ubiquitylation in gefitinib resistance is poorly understood. To systematically identify the global change in protein expression and ubiquitylation during gefitinib resistance, a quantitative global proteome and ubiquitylome study in a pair of gefitinib-resistant and sensitive NSCLC cells is carried out. Altogether, changes in expression of 3773 proteins are quantified, and changes in ubiquitylation of 2893 lysine sites in 1415 proteins are measured in both cells. Interestingly, lysosomal and endocytic pathways, which are involved in autophagy regulation, are enriched with upregulated proteins or ubiquitylated proteins in gefitinib-resistant cells. In addition, HMGA2 overexpression or ALOX5 knockdown suppresses gefitinib resistance in NSCLC cells by inhibiting autophagy. Overall, these results reveal the previously unknown global ubiquitylome and proteomic features associated with gefitinib resistance, uncover the opposing roles of HMGA2 or ALOX5 in regulating gefitinib resistance and autophagy, and will help to identify new therapeutic targets in overcoming gefitinib resistance.
Keywords: gefitinib resistance; non-small cell lung cancer; proteome; ubiquitylome.
© 2018 The Authors. Proteomics Published by WILEY-VCH Verlag GmbH & Co. KGaA, Weinheim.
Figures
Similar articles
-
TIP30 overcomes gefitinib resistance by regulating cytoplasmic and nuclear EGFR signaling in non-small-cell lung cancer.Cancer Sci. 2021 Oct;112(10):4139-4150. doi: 10.1111/cas.15000. Epub 2021 Aug 10. Cancer Sci. 2021. PMID: 34058054 Free PMC article.
-
Cucurbitacin B Induces the Lysosomal Degradation of EGFR and Suppresses the CIP2A/PP2A/Akt Signaling Axis in Gefitinib-Resistant Non-Small Cell Lung Cancer.Molecules. 2019 Feb 12;24(3):647. doi: 10.3390/molecules24030647. Molecules. 2019. PMID: 30759826 Free PMC article.
-
TRIP13 overexpression promotes gefitinib resistance in non‑small cell lung cancer via regulating autophagy and phosphorylation of the EGFR signaling pathway.Oncol Rep. 2023 May;49(5):84. doi: 10.3892/or.2023.8521. Epub 2023 Mar 10. Oncol Rep. 2023. PMID: 36896765 Free PMC article.
-
ID1 overexpression increases gefitinib sensitivity in non-small cell lung cancer by activating RIP3/MLKL-dependent necroptosis.Cancer Lett. 2020 Apr 10;475:109-118. doi: 10.1016/j.canlet.2020.01.025. Epub 2020 Jan 28. Cancer Lett. 2020. PMID: 32004572
-
Advances on Plant Ubiquitylome-From Mechanism to Application.Int J Mol Sci. 2020 Oct 24;21(21):7909. doi: 10.3390/ijms21217909. Int J Mol Sci. 2020. PMID: 33114409 Free PMC article. Review.
Cited by
-
The Role of Proteomics and Phosphoproteomics in the Discovery of Therapeutic Targets and Biomarkers in Acquired EGFR-TKI-Resistant Non-Small Cell Lung Cancer.Int J Mol Sci. 2023 Mar 2;24(5):4827. doi: 10.3390/ijms24054827. Int J Mol Sci. 2023. PMID: 36902280 Free PMC article. Review.
-
The Analysis of the Ubiquitylomic Responses to Streptococcus agalactiae Infection in Bovine Mammary Gland Epithelial Cells.J Inflamm Res. 2022 Jul 27;15:4331-4343. doi: 10.2147/JIR.S368779. eCollection 2022. J Inflamm Res. 2022. PMID: 35923910 Free PMC article.
-
CPLM 4.0: an updated database with rich annotations for protein lysine modifications.Nucleic Acids Res. 2022 Jan 7;50(D1):D451-D459. doi: 10.1093/nar/gkab849. Nucleic Acids Res. 2022. PMID: 34581824 Free PMC article.
-
SMARCB1 regulates the hypoxic stress response in sickle cell trait.Proc Natl Acad Sci U S A. 2023 May 23;120(21):e2209639120. doi: 10.1073/pnas.2209639120. Epub 2023 May 15. Proc Natl Acad Sci U S A. 2023. PMID: 37186844 Free PMC article.
-
Quantitative ubiquitylome analysis and crosstalk with proteome/acetylome analysis identified novel pathways and targets of perifosine treatment in neuroblastoma.Transl Cancer Res. 2018 Dec;7(6):1548-1560. doi: 10.21037/tcr.2018.11.30. Transl Cancer Res. 2018. PMID: 30761266 Free PMC article.
References
-
- a) Pao W., Miller V. A., Politi K. A., Riely G. J., Somwar R., Zakowski M. F., Kris M. G., Varmus H., PLoS Medicine 2005, 2, e73; - PMC - PubMed
- b) Sequist L. V., Waltman B. A., Dias‐Santagata D., Digumarthy S., Turke A. B., Fidias P., Bergethon K., Shaw A. T., Gettinger S., Cosper A. K., Akhavanfard S., Heist R. S., Temel J., Christensen J. G., Wain J. C., Lynch T. J., Vernovsky K., Mark E. J., Lanuti M., Iafrate A. J., Mino‐Kenudson M., Engelman J. A., Science Trans. Med. 2011, 3, 75ra26; - PMC - PubMed
- c) Bivona T. G., Hieronymus H., Parker J., Chang K., Taron M., Rosell R., Moonsamy P., Dahlman K., Miller V. A., Costa C., Hannon G., Sawyers C. L., Nature 2011, 471, 523; - PMC - PubMed
- d) Cortot A. B., Repellin C. E., Shimamura T., Capelletti M., Zejnullahu K., Ercan D., Christensen J. G., Wong K. K., Gray N. S., Janne P. A., Cancer Res. 2013, 73, 834; - PMC - PubMed
- e) Engelman J. A., Zejnullahu K., Mitsudomi T., Song Y., Hyland C., Park J. O., Lindeman N., Gale C. M., Zhao X., Christensen J., Kosaka T., Holmes A. J., Rogers A. M., Cappuzzo F., Mok T., Lee C., Johnson B. E., Cantley L. C., Janne P. A., Science 2007, 316, 1039. - PubMed
-
- Komander D., Rape M., Annual Rev. Biochem. 2012, 81, 203. - PubMed
-
- Alberts B., Molecular Biology of the Cell, Garland Science, New York: 2002.
Publication types
MeSH terms
Substances
Grants and funding
LinkOut - more resources
Full Text Sources
Other Literature Sources
Molecular Biology Databases
Research Materials
Miscellaneous
