. 2018 Jul 12;174(2):406-421.e25.
doi: 10.1016/j.cell.2018.05.007. Epub 2018 Jun 7.

SMCHD1 Merges Chromosome Compartments and Assists Formation of Super-Structures on the Inactive X

Affiliations

SMCHD1 Merges Chromosome Compartments and Assists Formation of Super-Structures on the Inactive X

Chen-Yu Wang et al. Cell. .

Abstract

Mammalian chromosomes are partitioned into A/B compartments and topologically associated domains (TADs). The inactive X (Xi) chromosome, however, adopts a distinct conformation without evident compartments or TADs. Here, through exploration of an architectural protein, structural-maintenance-of-chromosomes hinge domain containing 1 (SMCHD1), we probe how the Xi is reconfigured during X chromosome inactivation. A/B compartments are first fused into "S1" and "S2" compartments, coinciding with Xist spreading into gene-rich domains. SMCHD1 then binds S1/S2 compartments and merges them to create a compartment-less architecture. Contrary to current views, TADs remain on the Xi but in an attenuated state. Ablating SMCHD1 results in a persistent S1/S2 organization and strengthening of TADs. Furthermore, loss of SMCHD1 causes regional defects in Xist spreading and erosion of heterochromatic silencing. We present a stepwise model for Xi folding, where SMCHD1 attenuates a hidden layer of Xi architecture to facilitate Xist spreading.

Keywords: Polycomb complexes; SMCHD1; TADs; X chromosome inactivation; Xist RNA; chromosome conformation; compartments; long noncoding RNAs; nuclear organization; topologically associating domains.


Conflict of interest statement

Declaration of Interests

The authors declare no competing interests.

Figures
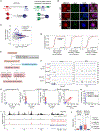
Figure 1:
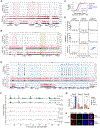
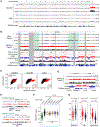
Figure 1:. SMCHD1-sensitive vs SMCHD1-insensitive genes of the Xi.
(A) Structure of SMCHD1 and canonical SMC dimers. N-terminus, N. C-terminus, C. (B) Immuno-RNA-FISH for SMCHD1 and Xist RNA. Top two rows: Wild-type (WT) and XaWTXiΔXist female fibroblasts. Fibroblasts are SV40-large-T-immortalized and are therefore polyploid (2n to 8n). Bottom: Male MEF lines harboring WT Xist transgene (♂X+P). Number of cells with SMCHD1 foci co-localizing with the Xist is shown. (C) An RNA-seq MA plot shows upregulation of Pcdh α cluster (green) and a subset of X-linked genes (red) in Smchd1-/- cells. Gray dots, genes not differentially expressed. (D) Cumulative distribution plots (CDP) of fold-changes of expressed X-linked genes (red) versus autosomal genes (black) between various WT and Smchd1-/- NPC clones as indicated. P-values by Wilcoxon ranked sum (Wilcox) test (unpaired, one-sided). (E) Workflow showing classification of X-linked genes into SMCHD1-sensitive vs -insensitive genes. (F) FPM-normalized RNA-seq coverage profiles showing failed silencing of 2 SMCHD1-sensitive genes. comp, all reads. cas, cas-specific reads (Xa). mus, mus-specific reads (Xi). Scales shown in brackets. (G) Scatter plots comparing degree of allelic skewing (%mus) between various clones, as indicated. Plotted are 230 genes subject to XCI in NPCs. Red dots, SMCHD1-sensitive genes. Blue dots, SMCHD1-insensitive genes. (H) Probability density plots of %mus for 73 concordant SMCHD1-sensitive genes. (I) X-chromosomal locations of SMCHD1-sensitive and -insensitive genes. (J) Clustering of SMCHD1-sensitive and -insensitive genes. Left: Distribution of distances from a SMCHD1-sensitive gene to the nearest sensitive (red) or insensitive gene (blue). Right: Distribution of distances from a SMCHD1-insensitive gene to the nearest sensitive (red) or insensitive gene (blue). *, P=3.2×10⁻⁸. **, P=1.6×10⁻⁸ (Wilcox test).
Figure 2.
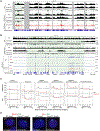
Figure 2.. Segmental erosion of H3K27me3 domains reveals SMCHD1’s role in spreading heterochromatin.
(A) H3K4me3 and H3K27me3 profiles for representative Class I genes (red-shaded area) and an escapee (Kdm5c). cas, mus, comp as defined in Fig 1. (B) H3K4me3 and H3K27me3 profiles for representative Class II genes (yellow-shaded area). Zfx, a Class I gene. Eif2s3x, an escapee. (C) CDPs of fold-changes in gene expression between Smchd1-/- and WT cells for autosomal genes (black), Class I genes (red), and all other X-linked genes (black). P-values by Wilcox test (unpaired, one-sided). Between Class I versus autosomal genes (red), and all other X-linked genes versus autosomal genes (blue). (D) For each of three gene classes, comparison of allelic skewing in expression (top), allelic skewing of H3K4me3 peaks at promoters (middle), and H3K27me3 enrichment in gene bodies (bottom) between Smchd1-/- (y-axes) versus WT (x-axes) cells. (E) Failure of H3K27me3 spreading covering intergenic regions and gene bodies of Class I genes (blue-shaded area). (F) Chromosomal locations of various categories of X-linked genes. We segmented the X into 400-kb bins and plotted the number of genes for each category. (G) Nearest neighbor analysis: Box plots showing distance relationships of Class I, II, and III genes to each other. E.g., the left panel shows the distribution of distances from a Class I gene to the nearest Class I (red), Class II (yellow), or Class III (blue) gene. NS: not significant (P>0.05). a, P=3.3×10⁻¹⁴. b, P=6.3×10⁻¹⁶. c, P=5.0×10⁻¹¹. d, P=9.9×10⁻¹¹(Wilcox test). (H) Immuno-RNA-FISH for H3K27me3 and Xist RNA on WT and Smchd1-/- NPCs. Number of cells with an Xist cloud and a co-localizing H3K27me3 focus shown.
Figure 3.
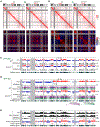
Figure 3.. SMCHD1 deficiency results in regional Xist spreading defects.
(A) Xist binding patterns (CHART-seq, comp), H3K27me3 enrichment (ChIP-seq, comp), and H3K4me3 enrichment (ChIP-seq, mus) across X chromosome. Enrichment difference determined by subtracting WT from Smchd1-/-. Green-shaded area, Xist-depleted regions. Gray-shaded area, unmappable regions. (B) Xist binding patterns, H3K27me3 and H3K4me3 enrichment across one representative Xist-depleted domain. (C) Metagene analysis of H3K27me3 and Xist enrichment in WT versus Smchd1-/- NPCs. Different X-linked gene categories are shown. The Xist locus was excluded as an escapee. TSS, transcription start site. TTS, transcription termination site. Gene bodies are “squished” between distances from 1–3 kb. Upstream and downstream regions are in absolute distance (kb). (D) Two color RNA FISH for Xist and Mecp2 (left) or Atrx (right) in WT versus Smchd1-/- cells. %nuclei shown with nascent Mecp2 or Atrx signal outside or overlapping the edge of Xist cloud. In WT cells, 85% (159/186) of nuclei show monoallelic Mecp2 and 96% (129/134) show monoallelic Atrx. In Smchd1-/- cells, 73% of Mecp2 is biallelic (186/255), and 88% of the Xi allele is outside of Xist cloud; for Atrx, 80% is biallelic (135/168), and 70% of the Xi allele is outside of Xist cloud.
Figure 4.
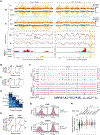
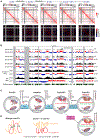
Figure 4.. Smchd1 ablation reveals a hidden layer of Xi organization.
(A) Allele-specific Hi-C analysis: Top: Contact maps of the Xa (Xcas) in WT and Smchd1-/- NPCs analyzed in 200-kb bins. Bottom: Corresponding Pearson correlation maps. Gray-shaded area, unmappable regions. (B) Allele-specific Hi-C analysis. Top: Contact maps of the Xi (Xmus) in WT and Smchd1-/- NPCs analyzed in 200-kb bins. Bottom: Corresponding Pearson correlation maps. (C) Principle component analysis (PCA) of the Xa correlated with allele-specific H3K4me3 peaks (black tracks). Positive principle component 1 (PC1) values represent A (active) compartments (red); negative PC1 values represent B (repressed) compartments (blue). (D) PCA of the Xi correlated with allele-specific H3K4me3 peaks (black tracks), Xist binding (CHART heatmap), and H3K27me3 (ChIP heatmap) in NPCs. Red/blue structures are S1/S2 compartments. (E) Xist-binding patterns and the distribution of Class I genes correlated with S1/S2 compartments.
Figure 5.
Figure 5.. Smchd1 ablation leads to retention of CTCF/cohesin and strong TADs on the Xi.
(A) Hi-C interaction maps (in 40-kb bins), insulation profiles, and the genomic location of Class I and II genes at two representative X-linked regions. TADs (as defined by Dixon et al., 2012) are delineated as blue bars between interaction maps and as dashed lines in the insulation graphs. (B) CDPs of the insulation scores (in 40-kb bins) on the Xa (blue) and the Xi (red) in WT versus Smchd1-/- NPCs as indicated. WT: p<2.2×10⁻¹⁶. Smchd1-/-: p=1.6×10⁻¹³ (KS test). (C) CDPs of the insulation scores for the Xa and Xi in WT (black) versus Smchd1-/- (KO, red) NPCs. Xa: p=0.31. Xi: p=1.4×10⁻¹⁰ (KS test). (D) Pearson correlation analysis of the insulation profiles analyzed in B,C. (E) CDPs of insulation scores in WT (black) versus Smchd1-/- (red) NPCs for bins containing Class I genes versus other bins. Xa and Xi profiles shown, as indicated. Xa: Class I regions, p=0.55; other regions, p=0.28. Xi: Class I regions, p=0.038; other regions, p=4.4×10⁻¹¹(KS test). (F) Allelic CTCF and RAD21 binding within a representative X-linked region. Xi, mus. Xa, cas. Significant binding peaks are indicated in green. (G) Top: Probability density plots of CTCF (top) or RAD21 (bottom) binding to the mus allele (%mus) of chrX or chr13 in WT versus Smchd1-/- NPCs, as indicated. P-values by KS test. (H) Box plots showing the distribution of differences in allelic skewing (Δ%mus) for CTCF in Smchd1-/- vs WT cells for the categories indicated. Class I vs II genes, P=1. Class I genes vs all other X gene categories, P< 0.03. Chr13 vs escapees, P=1. Chr13 vs all other X gene categories, P<0.001 (one-sided Wilcox test with Bonferroni correction).
Figure 6.
Figure 6.. SMCHD1 bridges S1 and S2 to merge compartments on the Xi
(A) Genomic SMCHD1 and CBX1 binding determined by DamID. Enrichment profiles were determined by log2(Dam fusion/ Dam alone) of each GATC fragment, with negative values (depleted relative to Dam alone) displayed with gray. (B) SMCHD1 and CBX1 enrichment profiles across the X chromosome correlated with Class I and II genes, S1/S2 compartments in Smchd1-/- NPCs, Xist CHART, and H3K27me3 ChIP profiles in MEFs (GSE48649). Green-shaded areas, SNP-scarce regions. (C) Scatter plots comparing SMCHD1 and CBX1 allele-specific binding to autosomes (black dots) and X chromosomes (red dots) at 100-kb bins. r, Pearson correlation coefficient for autosomes (black) and X chromosomes (red). (D) SMCHD1 DamID profiles at two representative S1/S2 borders. (E) SMCHD1 DamID profiles at two representative Class I regions. (F) Box plots comparing SMCHD1 binding for indicated gene categories. (G) Box plots comparing SMCHD1, Xist, and H3K27me3 enrichment in S1 vs S2 compartments. P-values by Wilcox test (one-sided).
Figure 7.
Figure 7.. S1/S2 compartments are transitional states during XCI.
(A) Allele-specific Hi-C analysis: Top: Contact maps (200-kb resolution) of the Xi (Xmus) in undifferentiated ES cells (D0 ES, pre-XCI), embryoid bodies after 4 or 7 differentiation days (D4 and D7 EB, early-mid XCI), and WT and Smchd1-/- NPCs (post-XCI). Bottom: Pearson correlation maps. (B) PCA of the D0 Xa (comp), the Xi (Xmus) at different stages of XCI, and correlation with Xist spreading patterns (GSE48649). D3 Xist patterns represent “early domains.” Blue and red arrows indicate fusion of consecutive A/B compartments to form S1/S2. (C) The Origami Model for step-wise Xi folding. Xist RNA is produced from A compartment and initially spreads to co-segregated A compartments (red) through proximity transfer. Xist fuses A/B into S1/S2 compartments, correlating with the two-step Xist spreading into early (gene-rich), then late (gene-poor) domains (Simon et al., 2013). Following SMCHD1 recruitment, S1/S2 compartments are merged (top) to form a compartmentless structure. In Smchd1-/- cells, the final transformation does not occur and S1/S2 compartments persist (bottom), resulting in defective Xist spreading and gene silencing. (D) Model: SMCHD1 bridges Xist-rich and Xist-poor chromatin to promote chromatin mixing and merging of S1/S2 compartments (left). Without SMCHD1, Xist-rich chromatin co-segregates, leading to the formation of S1/S2 compartments (right).

Similar articles

Cited by

References

    1. Anders S, and Huber W (2010). Differential expression analysis for sequence count data. Genome biology 11, R106. - PMC - PubMed
    1. Berletch JB, Ma W, Yang F, Shendure J, Noble WS, Disteche CM, and Deng X (2015). Escape from X inactivation varies in mouse tissues. PLoS genetics 11, e1005079. - PMC - PubMed
    1. Bickmore WA, and van Steensel B (2013). Genome architecture: domain organization of interphase chromosomes. Cell 152, 1270–1284. - PubMed
    1. Blewitt ME, Gendrel AV, Pang Z, Sparrow DB, Whitelaw N, Craig JM, Apedaile A, Hilton DJ, Dunwoodie SL, Brockdorff N, et al. (2008). SmcHD1, containing a structural-maintenance-of-chromosomes hinge domain, has a critical role in X inactivation. Nature genetics 40, 663–669. - PubMed
    1. Blewitt ME, Vickaryous NK, Hemley SJ, Ashe A, Bruxner TJ, Preis JI, Arkell R, and Whitelaw E (2005). An N-ethyl-N-nitrosourea screen for genes involved in variegation in the mouse. Proc Natl Acad Sci U S A 102, 7629–7634. - PMC - PubMed

Publication types

MeSH terms