Transcriptome-pathology correlation identifies interplay between TDP-43 and the expression of its kinase CK1E in sporadic ALS
- PMID: 29881994
- PMCID: PMC6215775
- DOI: 10.1007/s00401-018-1870-7
Transcriptome-pathology correlation identifies interplay between TDP-43 and the expression of its kinase CK1E in sporadic ALS
Abstract
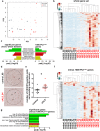
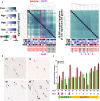
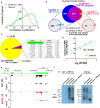
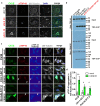
Sporadic amyotrophic lateral sclerosis (sALS) is the most common form of ALS, however, the molecular mechanisms underlying cellular damage and motor neuron degeneration remain elusive. To identify molecular signatures of sALS we performed genome-wide expression profiling in laser capture microdissection-enriched surviving motor neurons (MNs) from lumbar spinal cords of sALS patients with rostral onset and caudal progression. After correcting for immunological background, we discover a highly specific gene expression signature for sALS that is associated with phosphorylated TDP-43 (pTDP-43) pathology. Transcriptome-pathology correlation identified casein kinase 1ε (CSNK1E) mRNA as tightly correlated to levels of pTDP-43 in sALS patients. Enhanced crosslinking and immunoprecipitation in human sALS patient- and healthy control-derived frontal cortex, revealed that TDP-43 binds directly to and regulates the expression of CSNK1E mRNA. Additionally, we were able to show that pTDP-43 itself binds RNA. CK1E, the protein product of CSNK1E, in turn interacts with TDP-43 and promotes cytoplasmic accumulation of pTDP-43 in human stem-cell-derived MNs. Pathological TDP-43 phosphorylation is therefore, reciprocally regulated by CK1E activity and TDP-43 RNA binding. Our framework of transcriptome-pathology correlations identifies candidate genes with relevance to novel mechanisms of neurodegeneration.
Keywords: ALS; Casein kinase; Gene-expression; Laser capture microdissection; Motor neuron; Neurodegeneration; RNA; RNA-seq; Sporadic disease; TDP-43.
Figures


Similar articles
-
Pathological TDP-43 changes in Betz cells differ from those in bulbar and spinal α-motoneurons in sporadic amyotrophic lateral sclerosis.Acta Neuropathol. 2017 Jan;133(1):79-90. doi: 10.1007/s00401-016-1633-2. Epub 2016 Oct 18. Acta Neuropathol. 2017. PMID: 27757524 Free PMC article.
-
Amyotrophic lateral sclerosis: dash-like accumulation of phosphorylated TDP-43 in somatodendritic and axonal compartments of somatomotor neurons of the lower brainstem and spinal cord.Acta Neuropathol. 2010 Jul;120(1):67-74. doi: 10.1007/s00401-010-0683-0. Epub 2010 Apr 9. Acta Neuropathol. 2010. PMID: 20379728
-
Matrin 3 Is a Component of Neuronal Cytoplasmic Inclusions of Motor Neurons in Sporadic Amyotrophic Lateral Sclerosis.Am J Pathol. 2018 Feb;188(2):507-514. doi: 10.1016/j.ajpath.2017.10.007. Epub 2017 Nov 9. Am J Pathol. 2018. PMID: 29128563
-
The molecular link between inefficient GluA2 Q/R site-RNA editing and TDP-43 pathology in motor neurons of sporadic amyotrophic lateral sclerosis patients.Brain Res. 2014 Oct 10;1584:28-38. doi: 10.1016/j.brainres.2013.12.011. Epub 2013 Dec 16. Brain Res. 2014. PMID: 24355598 Review.
-
Review: Prion-like mechanisms of transactive response DNA binding protein of 43 kDa (TDP-43) in amyotrophic lateral sclerosis (ALS).Neuropathol Appl Neurobiol. 2015 Aug;41(5):578-97. doi: 10.1111/nan.12206. Epub 2015 Apr 20. Neuropathol Appl Neurobiol. 2015. PMID: 25487060 Review.
Cited by
-
Regulation of TDP-43 phosphorylation in aging and disease.Geroscience. 2021 Aug;43(4):1605-1614. doi: 10.1007/s11357-021-00383-5. Epub 2021 May 25. Geroscience. 2021. PMID: 34032984 Free PMC article.
-
Mechanism of STMN2 cryptic splice-polyadenylation and its correction for TDP-43 proteinopathies.Science. 2023 Mar 17;379(6637):1140-1149. doi: 10.1126/science.abq5622. Epub 2023 Mar 16. Science. 2023. PMID: 36927019 Free PMC article.
-
Persistent mRNA localization defects and cell death in ALS neurons caused by transient cellular stress.Cell Rep. 2021 Sep 7;36(10):109685. doi: 10.1016/j.celrep.2021.109685. Cell Rep. 2021. PMID: 34496257 Free PMC article.
-
Small-Molecule Modulation of TDP-43 Recruitment to Stress Granules Prevents Persistent TDP-43 Accumulation in ALS/FTD.Neuron. 2019 Sep 4;103(5):802-819.e11. doi: 10.1016/j.neuron.2019.05.048. Epub 2019 Jul 1. Neuron. 2019. PMID: 31272829 Free PMC article.
-
Loss of Nuclear TDP-43 Is Associated with Decondensation of LINE Retrotransposons.Cell Rep. 2019 Apr 30;27(5):1409-1421.e6. doi: 10.1016/j.celrep.2019.04.003. Cell Rep. 2019. PMID: 31042469 Free PMC article.
References
-
- Alquezar C, Salado IG, de la Encarnacion A, Perez DI, Moreno F, Gil C, de Munain AL, Martinez A, Martin-Requero A. Targeting TDP-43 phosphorylation by Casein Kinase-1delta inhibitors: a novel strategy for the treatment of frontotemporal dementia. Mol Neurodegener. 2016;11:36. doi: 10.1186/s13024-016-0102-7. - DOI - PMC - PubMed
-
- Amlie-Wolf A, Ryvkin P, Tong R, Dragomir I, Suh E, Xu Y, Van Deerlin VM, Gregory BD, Kwong LK, Trojanowski JQ, Lee VM, Wang LS, Lee EB. Transcriptomic Changes Due to Cytoplasmic TDP-43 Expression Reveal Dysregulation of Histone Transcripts and Nuclear Chromatin. PLoS ONE. 2015;10:e0141836. doi: 10.1371/journal.pone.0141836. - DOI - PMC - PubMed
-
- Arai T, Hasegawa M, Akiyama H, Ikeda K, Nonaka T, Mori H, Mann D, Tsuchiya K, Yoshida M, Hashizume Y, Oda T. TDP-43 is a component of ubiquitin-positive tau-negative inclusions in frontotemporal lobar degeneration and amyotrophic lateral sclerosis. Biochem Biophys Res Commun. 2006;351:602–611. doi: 10.1016/j.bbrc.2006.10.093. - DOI - PubMed
Publication types
MeSH terms
Substances
Grants and funding
LinkOut - more resources
Full Text Sources
Other Literature Sources
Medical
Molecular Biology Databases
Research Materials
Miscellaneous

