. 2018 Jun;558(7708):73-79.
doi: 10.1038/s41586-018-0175-2. Epub 2018 Jun 6.

Genomic atlas of the human plasma proteome

Affiliations

Genomic atlas of the human plasma proteome

Benjamin B Sun et al. Nature. 2018 Jun.

Abstract

Although plasma proteins have important roles in biological processes and are the direct targets of many drugs, the genetic factors that control inter-individual variation in plasma protein levels are not well understood. Here we characterize the genetic architecture of the human plasma proteome in healthy blood donors from the INTERVAL study. We identify 1,927 genetic associations with 1,478 proteins, a fourfold increase on existing knowledge, including trans associations for 1,104 proteins. To understand the consequences of perturbations in plasma protein levels, we apply an integrated approach that links genetic variation with biological pathway, disease, and drug databases. We show that protein quantitative trait loci overlap with gene expression quantitative trait loci, as well as with disease-associated loci, and find evidence that protein biomarkers have causal roles in disease using Mendelian randomization analysis. By linking genetic factors to diseases via specific proteins, our analyses highlight potential therapeutic targets, opportunities for matching existing drugs with new disease indications, and potential safety concerns for drugs under development.


Conflict of interest statement

Competing interests The authors declare the following competing interests: A.C., CSF-Merck employee; N.J., S.K.W., SomaLogic Inc employees and stakeholders; E.S.Z., SomaLogic Inc employee; J.C.M., R.M.P., Merck employees during this study, now Celgene employees; H.R., Merck employee during this study; J.E.P., travel and accommodation expenses and hospitality from Olink to speak at Olink-sponsored academic meetings; A.S.B., grants from Merck, Pfizer, Novartis, Biogen and Bioverativ and personal fees from Novartis; J.D., sits on the Novartis Cardiovascular and Metabolic Advisory Board, had grant support from Novartis.

Figures

Extended Data Fig. 1
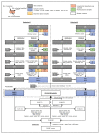
Extended Data Fig. 1. Flowchart of sample processing and quality control stages for proteomic and genetic measurements before genetic analyses.
Extended Data Fig. 2
Extended Data Fig. 2. Examples of protein targets for which the SOMAmer is highly specific.
SDS–PAGE with Alexa-647-labelled proteins captured by the IL1RL2 SOMAmer (a) or GP1BA SOMAmer (b). For each protein target, the protein captured by the SOMAmer is compared to the standard. The cognate targets are the only ones with protein visible in the capture lanes, whereas the proteins homologous to the target proteins show no evidence of binding. These experiments were performed once. MW markers, molecular weight markers.
Extended Data Fig. 3
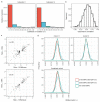
Extended Data Fig. 3. Evidence for the reliability of protein measurements made using the SOMAscan assay.
a, Distribution of coefficients of variation of all proteins on the SOMAscan assay in each subcohort. b, Spearman’s correlations for all proteins passing QC derived from contemporaneous assay of baseline and two-year samples from 60 participants. c, Scatterplot of pQTL effect size estimates from SOMAscan versus Olink showing all 163 pQTLs tested (top) and the 106 that replicated (bottom). r is Pearson’s correlation coefficient. d, Distribution of inflation factors across proteins that underwent genome-wide association testing, stratified by subcohort and allele frequency (MAF ≥ 5%, MAF < 5%).
Extended Data Fig. 4
Extended Data Fig. 4. The WFIKKN2 region is a trans pQTL for GDF11/8 plasma levels.
a, Regional association plots of the trans pQTL (sentinel variant rs11079936) for GDF11/8 before and after adjusting for levels of WFIKKN2 (upper panels), and the WFIKKN2 cis pQTL after adjusting for GDF11/8 levels (bottom panel). A similar pattern of association for WFIKKN2 was seen before GDF11/8 adjustment (not shown). b, Attenuation of the GDF11/8 trans pQTL upon adjustment for plasma levels of the cis protein WFIKKN2.
Extended Data Fig. 5
Extended Data Fig. 5. Genetic architecture of the pQTLs.
pQTL mapping in n = 3,301 individuals. a, Distribution of the predicted consequences of the sentinel pQTL variants compared to matched permuted null sets of variants, stratified by cis and trans. Asterisks indicate empirical enrichment using a permutation test (10,000 permuted sets of non-associated variants) at a Bonferroni-corrected significance value (P < 0.005). Bar height represents the mean proportion of variants within each class and error bars reflect one standard deviation from the mean. b, Number of proteins associated (P < 1.5 × 10⁻¹¹) with each sentinel variant across the genome.
Extended Data Fig. 6
Extended Data Fig. 6. Enrichment of pQTLs at DNase I hypersensitive sites by tissue or cell type.
Circle shows enrichment for DNase I hypersensitive sites (‘hotspots’) for each of 55 tissues (183 cell types) available from the ENCODE and Roadmap Epigenomics projects, with tissues or cell types clustered and coloured by anatomical grouping. Some tissues have multiple values due to availability of multiple cell types or multiple tests per cell type. Radial lines show fold-enrichment, while dots around the inside edge of the circle denote statistically significant enrichment at a Bonferroni-corrected significant threshold P < 5 × 10⁻⁵. Enrichment testing performed using GARFIELD (which tests enrichment against permuted sets of variants matched for MAF, distance to TSS and LD). pQTL data from n = 3,301 individuals.
Extended Data Fig. 7
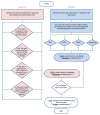
Extended Data Fig. 7. Scheme outlining the combined ‘bottom-up’ and ‘top-down’ process used for candidate gene annotation of trans pQTL regions.
See Methods. GbA, guilt-by-association; KEGG, Kyoto Encyclopedia of Genes and Genomes; OMIM, Online Mendelian Inheritance in Man; STRINGdb, STRING database.
Extended Data Fig. 8
Extended Data Fig. 8. Follow-up of PR3 SOMAmers.
These experiments were repeated three times independently with similar results. a, SOMAmer pulldowns with purified PR3, A1AT, and PR3–A1AT complex. SOMAmer PRTN3.3514.49.2 enriched the PR3–A1AT complex to a much greater degree than free PR3. Conversely, SOMAmer PRTN3.13720.95.3 enriched free PR3 to a greater degree than the PR3–A1AT complex. b, Solution affinity of PRTN3.3514.49.2 and PRTN3.13720.95.3 for PR3, A1AT, and the PR3–A1AT complex. SOMAmer PRTN3.3514.49.2 has a higher affinity for the PR3–A1AT complex than for free PR3. SOMAmer PRTN3.13720.95.3, on the other hand, has a higher affinity for free PR3 than SOMAmer PRTN3.3514.49.2. c, Competitive binding of SOMAmers PRTN3.13720.95.3 and PRTN3.3514.49.2 to PR3. A limiting amount of radiolabelled PRTN3.13720.95.3 was incubated with 1 nM proteinase-3 and a titration of either cold PRTN3.13720.95.3 or cold PRTN3.3514.49.2.
Extended Data Fig. 9
Extended Data Fig. 9. Comparison between a randomized controlled trial and Mendelian randomization to assess the causal effect of changes in protein biomarker levels on disease risk.
Extended Data Fig. 10
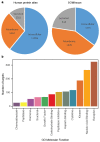
Extended Data Fig. 10. Characterization of protein targets measured using the SOMAscan assay.
a, Compartment distribution with annotations of all proteins in the Human Protein Atlas for comparison. b, GO molecular functions.
Fig. 1
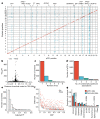
Fig. 1. The genetic architecture of plasma protein levels.
n = 3,301 participants. a, Genomic locations of pQTLs. Red, cis; blue, trans. The x- and y-axes indicate the positions of the sentinel variant and the gene encoding the associated protein, respectively. Highly pleiotropic genomic regions are annotated. b, Significance of cis associations (linear regression) versus distance of sentinel variant from TSS. c, Number of significantly associated loci per protein. d, Number of conditionally significant associations within each pQTL. e, Histogram of variance explained by conditionally significant variants. f, Effect size versus MAF. g, Distributions of the predicted functional annotation classes of sentinel pQTL variants versus null sets of variants from permutation. Bar height represents the mean proportion of variants within each class and error bars reflect one s.d. from the mean. *Significant enrichment (permutation test, Bonferroni-corrected threshold, P < 0.005).
Fig. 2
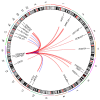
Fig. 2. Missense variant rs28929474:T in SERPINA1 is a trans pQTL hotspot.
Outermost numbers indicate chromosomes. Lines link the genomic location of rs28929474 with genes encoding significantly associated proteins. Associations with and without asterisks indicate significance at P < 5 × 10⁻⁸ and P < 1.5 × 10⁻¹¹, respectively. Line thickness is proportional to effect size (red, positive; blue, negative); n = 3,301 participants.
Fig. 3
Fig. 3. trans pQTL for BLIMP1 at an inflammatory bowel disease (IBD) associated missense variant (rs3197999:A) in MST1.
a, rs3197999:A is associated with multiple proteins. Lines link rs3197999 and the genes encoding significantly associated proteins. Line thickness is proportional to effect size of the IBD risk allele (red = positive, blue = negative). n = 3,301 participants. Asterisks indicate genes in IBD GWAS loci. b, Regional association plots at MST1, showing IBD association (top) and trans pQTLs for BLIMP1, DOCK9 and FASLG. Colour key indicates r2 with rs3197999. c, Regional association plot of the IBD susceptibility locus at PRDM1, which encodes BLIMP1. IBD association data are for European participants from a GWAS meta-analysis.
Fig. 4
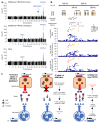
Fig. 4. Proteinase-3, SERPINA1 and vasculitis.
a, Manhattan plots for plasma PR3 measured with two SOMAmers and the Olink assay. b, PRTN3 regional association plots. Colour key indicates r2 with sentinel variant rs10425544. ‘Vasculitis GWAS’: previously reported vasculitis-associated variants (see Supplementary Note). EVGC, rs62132295 (from European Vasculitis Genetics Consortium); VCRCi, rs138303849 and VCRCt, rs62132293 (most significant imputed and genotyped variants, respectively, from Vasculitis Clinical Research Consortium). ‘Independent pQTLs’: conditionally independent PR3 pQTL variants (black lettering shows lead variant for both SOMAmers; purple and green show conditionally independent variants for SOMAmers PRTN3.3514.49.2 and PRTN3.13720.95.3, respectively). c, Proposed mechanisms by which PRTN3 and SERPINA1 affect PR3 levels and thus vasculitis risk. Left, individuals without either the PRTN3 or SERPINA1 vasculitis risk alleles. Middle, SERPINA1 Z-allele carriers have lower circulating A1AT, resulting in higher free plasma PR3. Right, cis-acting variant at the PRTN3 locus results in higher total plasma PR3. Increases in either free or total PR3 predispose individuals to loss of immune tolerance.
Fig. 5
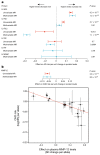
Fig. 5. Evaluation of causal role of proteins in disease.
n = 3,301 participants. a, MR estimates with 95% confidence intervals (CIs) (instrumental variable analysis) for proteins encoded in the IL1RL1IL18R1 locus and risk of atopic dermatitis (AD) risk. Univariable MR not possible for IL1R1 and IL18RAP (no significant pQTLs to select as ‘genetic instruments’). b, MMP-12 levels and risk of coronary heart disease (CHD). Top, MR estimates with 95% CIs. Bottom, estimated effect sizes (with 95% CIs) on plasma MMP-12 (from linear regression) and CHD risk (from logistic regression) for each variant used in the genetic score.

Similar articles

  • Large-scale integration of the plasma proteome with genetics and disease.
    Ferkingstad E, Sulem P, Atlason BA, Sveinbjornsson G, Magnusson MI, Styrmisdottir EL, Gunnarsdottir K, Helgason A, Oddsson A, Halldorsson BV, Jensson BO, Zink F, Halldorsson GH, Masson G, Arnadottir GA, Katrinardottir H, Juliusson K, Magnusson MK, Magnusson OT, Fridriksdottir R, Saevarsdottir S, Gudjonsson SA, Stacey SN, Rognvaldsson S, Eiriksdottir T, Olafsdottir TA, Steinthorsdottir V, Tragante V, Ulfarsson MO, Stefansson H, Jonsdottir I, Holm H, Rafnar T, Melsted P, Saemundsdottir J, Norddahl GL, Lund SH, Gudbjartsson DF, Thorsteinsdottir U, Stefansson K. Ferkingstad E, et al. Nat Genet. 2021 Dec;53(12):1712-1721. doi: 10.1038/s41588-021-00978-w. Epub 2021 Dec 2. Nat Genet. 2021. PMID: 34857953
  • High-Throughput Characterization of Blood Serum Proteomics of IBD Patients with Respect to Aging and Genetic Factors.
    Di Narzo AF, Telesco SE, Brodmerkel C, Argmann C, Peters LA, Li K, Kidd B, Dudley J, Cho J, Schadt EE, Kasarskis A, Dobrin R, Hao K. Di Narzo AF, et al. PLoS Genet. 2017 Jan 27;13(1):e1006565. doi: 10.1371/journal.pgen.1006565. eCollection 2017 Jan. PLoS Genet. 2017. PMID: 28129359 Free PMC article.
  • Genetic-informed proteome-wide scan reveals potential causal plasma proteins for idiopathic pulmonary fibrosis.
    Zhu J, Liu H, Gao R, Gong R, Wang J, Zhou D, Yu M, Li Y. Zhu J, et al. Thorax. 2024 Aug 19;79(9):878-882. doi: 10.1136/thorax-2024-221398. Thorax. 2024. PMID: 38871465
  • Plasma proteomic associations with genetics and health in the UK Biobank.
    Sun BB, Chiou J, Traylor M, Benner C, Hsu YH, Richardson TG, Surendran P, Mahajan A, Robins C, Vasquez-Grinnell SG, Hou L, Kvikstad EM, Burren OS, Davitte J, Ferber KL, Gillies CE, Hedman ÅK, Hu S, Lin T, Mikkilineni R, Pendergrass RK, Pickering C, Prins B, Baird D, Chen CY, Ward LD, Deaton AM, Welsh S, Willis CM, Lehner N, Arnold M, Wörheide MA, Suhre K, Kastenmüller G, Sethi A, Cule M, Raj A; Alnylam Human Genetics; AstraZeneca Genomics Initiative; Biogen Biobank Team; Bristol Myers Squibb; Genentech Human Genetics; GlaxoSmithKline Genomic Sciences; Pfizer Integrative Biology; Population Analytics of Janssen Data Sciences; Regeneron Genetics Center; Burkitt-Gray L, Melamud E, Black MH, Fauman EB, Howson JMM, Kang HM, McCarthy MI, Nioi P, Petrovski S, Scott RA, Smith EN, Szalma S, Waterworth DM, Mitnaul LJ, Szustakowski JD, Gibson BW, Miller MR, Whelan CD. Sun BB, et al. Nature. 2023 Oct;622(7982):329-338. doi: 10.1038/s41586-023-06592-6. Epub 2023 Oct 4. Nature. 2023. PMID: 37794186 Free PMC article.
  • Genetics' Piece of the PI: Inferring the Origin of Complex Traits and Diseases from Proteome-Wide Protein-Protein Interaction Dynamics.
    Gauthier L, Stynen B, Serohijos AWR, Michnick SW. Gauthier L, et al. Bioessays. 2020 Feb;42(2):e1900169. doi: 10.1002/bies.201900169. Epub 2019 Dec 18. Bioessays. 2020. PMID: 31854021 Review.

Cited by

References

    1. Albert FW, Kruglyak L. The role of regulatory variation in complex traits and disease. Nat Rev Genet. 2015;16:197–212. - PubMed
    1. Liu Y, et al. Quantitative variability of 342 plasma proteins in a human twin population. Mol Syst Biol. 2015;11:786. - PMC - PubMed
    1. Suhre K, et al. Connecting genetic risk to disease end points through the human blood plasma proteome. Nat Commun. 2017;8 14357. - PMC - PubMed
    1. Yao C, et al. Genome-wide association study of plasma proteins identifies putatively causal genes, proteins, and pathways for cardiovascular disease. 2017 Preprint at https://www.biorxiv.org/content/early/2017/05/12/136523.
    1. de Vries PS, et al. Whole-genome sequencing study of serum peptide levels: the Atherosclerosis Risk in Communities study. Hum Mol Genet. 2017;26:3442–3450. - PMC - PubMed