An increase in LRRK2 suppresses autophagy and enhances Dectin-1-induced immunity in a mouse model of colitis
- PMID: 29875204
- PMCID: PMC6636639
- DOI: 10.1126/scitranslmed.aan8162
An increase in LRRK2 suppresses autophagy and enhances Dectin-1-induced immunity in a mouse model of colitis
Abstract
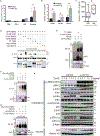
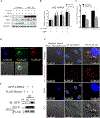
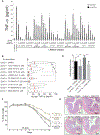
The LRRK2/MUC19 gene region constitutes a high-risk genetic locus for the occurrence of both inflammatory bowel diseases (IBDs) and Parkinson's disease. We show that dendritic cells (DCs) from patients with Crohn's disease (CD) and lymphoblastoid cell lines derived from patients without CD but bearing a high-risk allele (rs11564258) at this locus as heterozygotes exhibited increased LRRK2 expression in vitro. To investigate the immunological consequences of this increased LRRK2 expression, we conducted studies in transgenic mice overexpressing Lrrk2 and showed that these mice exhibited more severe colitis induced by dextran sodium sulfate (DSS) than did littermate control animals. This increase in colitis severity was associated with lamina propria DCs that showed increased Dectin-1-induced NF-κB activation and proinflammatory cytokine secretion. Colitis severity was driven by LRRK2 activation of NF-κB pathway components including the TAK1 complex and TRAF6. Next, we found that membrane-associated LRRK2 (in association with TAB2) caused inactivation of Beclin-1 and inhibition of autophagy. HCT116 colon epithelial cells lacking Beclin-1 exhibited increased LRRK2 expression compared to wild-type cells, suggesting that inhibition of autophagy potentially could augment LRRK2 proinflammatory signaling. We then showed that LRRK2 inhibitors decreased Dectin-1-induced TNF-α production by mouse DCs and ameliorated DSS-induced colitis, both in control and Lrrk2 transgenic animals. Finally, we demonstrated that LRRK2 inhibitors blocked TNF-α production by cultured DCs from patients with CD. Our findings suggest that normalization of LRRK2 activation could be a therapeutic approach for treating IBD, regardless of whether a LRRK2 risk allele is involved.
Copyright © 2018 The Authors, some rights reserved; exclusive licensee American Association for the Advancement of Science. No claim to original U.S. Government Works.
Conflict of interest statement
Figures


Similar articles
-
Leucine-Rich Repeat Kinase 2 Controls Inflammatory Cytokines Production through NF-κB Phosphorylation and Antigen Presentation in Bone Marrow-Derived Dendritic Cells.Int J Mol Sci. 2020 Mar 10;21(5):1890. doi: 10.3390/ijms21051890. Int J Mol Sci. 2020. PMID: 32164260 Free PMC article.
-
Enterocyte dendritic cell-specific intercellular adhesion molecule-3-grabbing non-integrin expression in inflammatory bowel disease.World J Gastroenterol. 2015 Jan 7;21(1):187-95. doi: 10.3748/wjg.v21.i1.187. World J Gastroenterol. 2015. PMID: 25574091 Free PMC article.
-
Mild Chronic Colitis Triggers Parkinsonism in LRRK2 Mutant Mice Through Activating TNF-α Pathway.Mov Disord. 2022 Apr;37(4):745-757. doi: 10.1002/mds.28890. Epub 2021 Dec 17. Mov Disord. 2022. PMID: 34918781
-
FGL2 regulates IKK/NF-κB signaling in intestinal epithelial cells and lamina propria dendritic cells to attenuate dextran sulfate sodium-induced colitis.Mol Immunol. 2020 Jan;117:84-93. doi: 10.1016/j.molimm.2019.11.001. Epub 2019 Nov 16. Mol Immunol. 2020. PMID: 31743856
-
Autophagy and Crohn's disease: at the crossroads of infection, inflammation, immunity, and cancer.Curr Mol Med. 2010 Jul;10(5):486-502. doi: 10.2174/156652410791608252. Curr Mol Med. 2010. PMID: 20540703 Free PMC article. Review.
Cited by
-
Astrocytic LRRK2 Controls Synaptic Connectivity via Regulation of ERM Phosphorylation.bioRxiv [Preprint]. 2024 Aug 28:2023.04.09.536178. doi: 10.1101/2023.04.09.536178. bioRxiv. 2024. PMID: 39253496 Free PMC article. Preprint.
-
LRRK2 G2019S Promotes Colon Cancer Potentially via LRRK2-GSDMD Axis-Mediated Gut Inflammation.Cells. 2024 Mar 23;13(7):565. doi: 10.3390/cells13070565. Cells. 2024. PMID: 38607004 Free PMC article.
-
Meta-analysis of sample-level dbGaP data reveals novel shared genetic link between body height and Crohn's disease.Hum Genet. 2021 Jun;140(6):865-877. doi: 10.1007/s00439-020-02250-3. Epub 2021 Jan 16. Hum Genet. 2021. PMID: 33452914 Free PMC article.
-
Mechanistic Insights Into Gut Microbiome Dysbiosis-Mediated Neuroimmune Dysregulation and Protein Misfolding and Clearance in the Pathogenesis of Chronic Neurodegenerative Disorders.Front Neurosci. 2022 Feb 25;16:836605. doi: 10.3389/fnins.2022.836605. eCollection 2022. Front Neurosci. 2022. PMID: 35281490 Free PMC article. Review.
-
Casuarina glauca branchlets' extract as a potential treatment for ulcerative colitis: chemical composition, in silico and in vivo studies.Front Pharmacol. 2023 Dec 22;14:1322181. doi: 10.3389/fphar.2023.1322181. eCollection 2023. Front Pharmacol. 2023. PMID: 38196993 Free PMC article.
References
-
- Strober W, Asano N, Fuss IJ, Kitani A, Watanabe T, Cellular and molecular mechanisms underlying NOD2 risk-associated polymorphisms in Crohn’s disease. Immunol. Rev 260, 249–260 (2014). - PubMed
-
- Zimprich A, Biskup S, Leitner P, Lichtner P, Farrer MJ, Lincoln S, Kachergus J, Hulihan M, Uitti RJ, Calne DB, Stoessl AJ, Pfeiffer RF, Patenge N, Carbajal IC, Vieregge P, Asmus F, Müller-Myhsok B, Dickson DW, Meitinger T, Strom TM, Wszolek ZK, Gasser T, Mutations in LRRK2 cause autosomal-dominant parkinsonism with pleomorphic pathology. Neuron 44, 601–607 (2004). - PubMed
-
- Simón-Sánchez J, Schulte C, Bras JM, Sharma M, Gibbs JR, Berg D, Paisan-Ruiz C, Lichtner P, Scholz SW, Hernandez DG, Krüger R, Federoff M, Klein C, Goate AM, Perlmutter JS, Bonin M, Nalls MA, Illig T, Gieger C, Houlden H, Steffens M, Okun MS, Racette BA, Cookson MR, Foote KD, Fernandez HH, Traynor BJ, Schreiber S, Arepalli S, Zonozi R, Gwinn K, van der Brug M, Lopez G, Chanock SJ, Schatzkin A, Park Y, Hollenbeck A, Gao J, Huang X, Wood NW, Lorenz D, Deuschl G, Chen H, Riess O, Hardy JA, Singleton AB, Gasser T, Genome-wide association study reveals genetic risk underlying Parkinson’s disease. Nat. Genet 41, 1308–1312 (2009). - PMC - PubMed
Publication types
MeSH terms
Substances
Grants and funding
LinkOut - more resources
Full Text Sources
Other Literature Sources
Molecular Biology Databases
Miscellaneous

