. 2018 Jul;8(7):850-865.
doi: 10.1158/2159-8290.CD-17-1211. Epub 2018 Jun 6.

NF-κB-Dependent Lymphoid Enhancer Co-option Promotes Renal Carcinoma Metastasis

Affiliations

NF-κB-Dependent Lymphoid Enhancer Co-option Promotes Renal Carcinoma Metastasis

Paulo Rodrigues et al. Cancer Discov. 2018 Jul.

Abstract

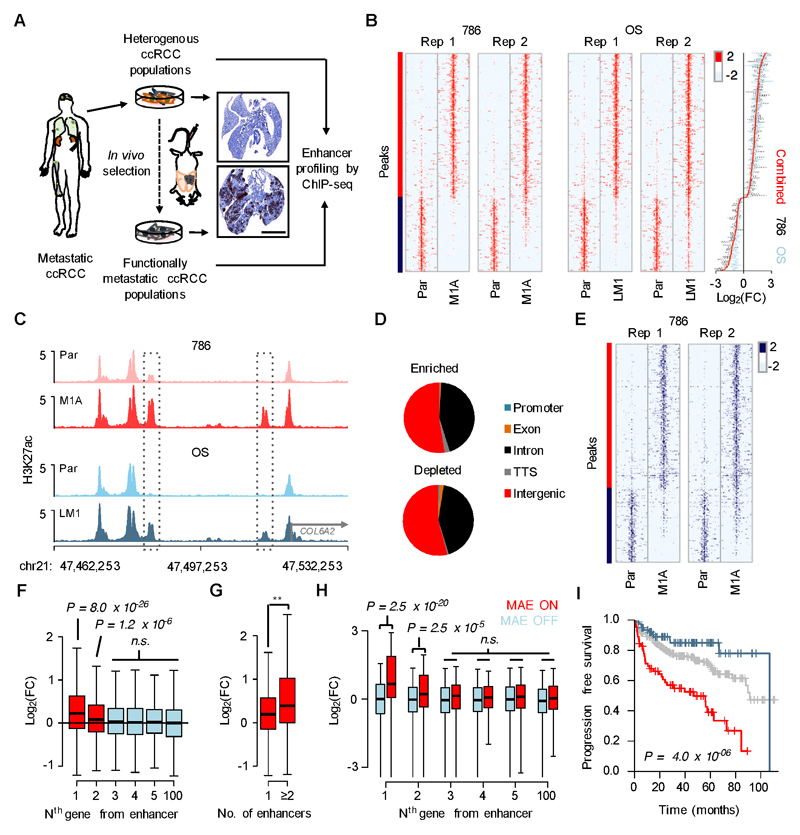
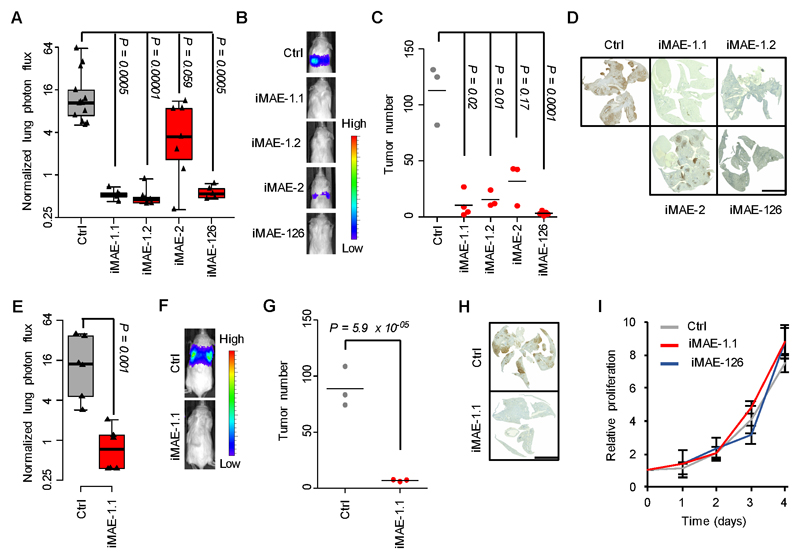
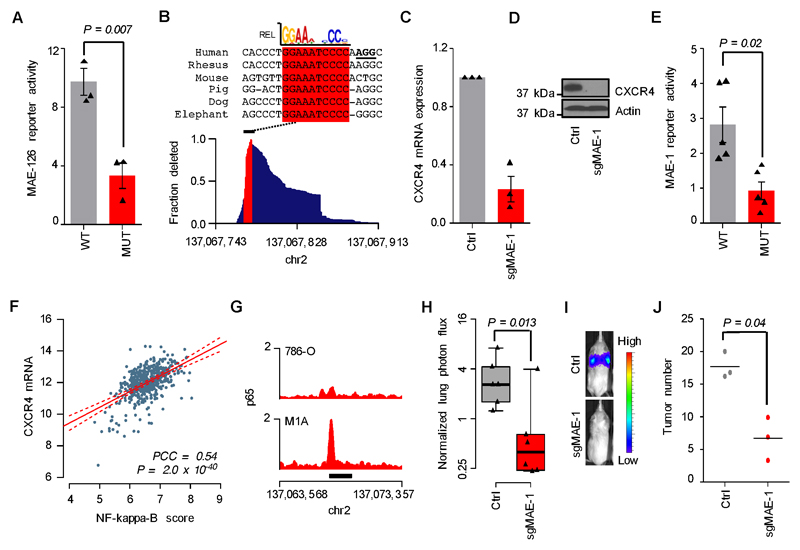
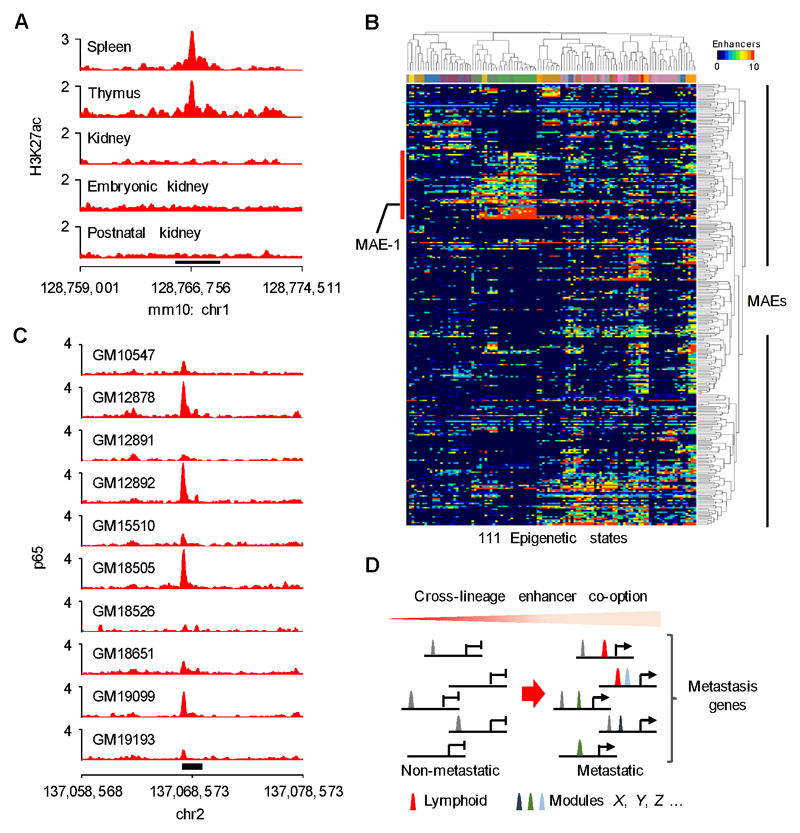
Metastases, the spread of cancer cells to distant organs, cause the majority of cancer-related deaths. Few metastasis-specific driver mutations have been identified, suggesting aberrant gene regulation as a source of metastatic traits. However, how metastatic gene expression programs arise is poorly understood. Here, using human-derived metastasis models of renal cancer, we identify transcriptional enhancers that promote metastatic carcinoma progression. Specific enhancers and enhancer clusters are activated in metastatic cancer cell populations, and the associated gene expression patterns are predictive of poor patient outcome in clinical samples. We find that the renal cancer metastasis-associated enhancer complement consists of multiple coactivated tissue-specific enhancer modules. Specifically, we identify and functionally characterize a coregulatory enhancer cluster, activated by the renal cancer driver HIF2A and an NF-κB-driven lymphoid element, as a mediator of metastasis in vivo We conclude that oncogenic pathways can acquire metastatic phenotypes through cross-lineage co-option of physiologic epigenetic enhancer states.Significance: Renal cancer is associated with significant mortality due to metastasis. We show that in metastatic renal cancer, functionally important metastasis genes are activated via co-option of gene regulatory enhancer modules from distant developmental lineages, thus providing clues to the origins of metastatic cancer. Cancer Discov; 8(7); 850-65. ©2018 AACR.This article is highlighted in the In This Issue feature, p. 781.


Conflict of interest statement

Conflicts of interest: The authors declare no potential conflicts of interest.

Figures

Figure 1
Figure 1. Enhancer activation landscape in metastatic renal cancer.
A, A schematic of the experimental approach. Human vimentin immunohistochemistry of mouse lungs 40 days after tail vein inoculation of 786-O (top) and M1A (bottom) cells. Scale bar 5mm. B, Left, heatmaps showing normalized H3K27ac ChIP-seq signal at 314 H3K27ac-enriched (red side bar) and 161 H3K27ac-depleted (blue side bar) genomic regions in metastatic ccRCC subpopulations (M1A and LM1) compared to their corresponding parental lines. A 10kb region centered to the H3K27ac peak is shown. Right, median fold change in ChIP-seq signal for all 475 enhancer elements. C, Examples of genomic regions with increased H3K27ac signal in metastatic cells. D, Genomic distribution of enriched and depleted H3K27ac regions relative to known transcripts. E, Heatmap showing normalized H3K4me1 ChIP-seq signal, genomic regions as in panel B. F, Relative mRNA expression of transcripts at different positions relative to altered H3K27ac regions. Data from two RNA-seq experiments for both 786 and OS systems combined, whiskers 1.5 x interquartile range. Wilcoxon rank-sum test with Bonferroni correction. G, Relative mRNA expression of transcripts with one or ≥2 associated altered H3K27ac regions. Data from two RNA-seq experiments for both 786 and OS systems combined, whiskers 1.5 x interquartile range. ** P = 0.002, Wilcoxon rank-sum test. H, mRNA expression fold change (tumor/normal) of transcripts at different positions relative to active (MAE ON) and inactive (MAE OFF) H3K27ac-enricehd MAEs. RNA-seq data from ten normal and matched human ccRCC samples, whiskers 1.5 x interquartile range. Wilcoxon rank-sum test with Bonferroni correction. I, Progression free survival in the TCGA ccRCC cohort, patients categorized based on the sum of Z-scores of mRNAs correlating with altered H3K27ac regions in the model systems, top 20% in red, bottom 20% in blue, middle 60% in grey. P-value derived from a Cox proportional hazards model in which sum of Z-scores is used as a continuous variable. N=400
Figure 2
Figure 2. Specific inhibition of MAE activity by CRISPRi.
A, Average ChIP-seq signal for the 314 H3K27ac-enriched MAEs in the M1A cells. B, The 10 most significantly enriched p300-containing MAEs, ranked by H3K27 fold change (FC) shown as grey bars, P-value shown in red. C, Strategy for CRISPRi-mediated repression of enhancer activity. A lentiviral vector expressing two sgRNAs from independent U6 promoters was used to direct dCas9-KRAB to p300 peaks within MAEs. D, H3K27ac ChIP-seq signal in the MAE-1/MAE-126 locus on chromosome 2. E, H3K27ac ChIP-seq signal showing effects of CRISPRi-mediated targeting of MAE-1 and MAE-126. F, Genome wide effects of CRISPRi-mediated enhancer targeting on H3K27ac enrichment.
Figure 3
Figure 3. Enhancers promote metastatic colonization.
A, Effects of CRISPRi-mediated targeting of MAE-1, MAE-2 and MAE-126 on lung metastatic fitness of M1A cells. Normalized lung photon flux in mice after 7 weeks of tail vein inoculation of 300,000 cells. P-value calculated by one-tailed Wilcoxon rank-sum test with Bonferroni correction. N=13 for Ctrl, N=5 for iMAE-1.1, N=7 for iMAE-1.2, N=7 for iMAE-2, N=5 for iMAE-126. Whiskers extend to data extremes. B, Representative bioluminescence images from the experiment shown in A. C, Histological quantification of lung metastatic foci from representative lungs of the experiment shown in A. N=3 for Ctrl, N=4 for iMAE-1.1, N=3 for iMAE-1.2, N=3 for iMAE-2, N=5 for iMAE-126. Horizontal bars represent sample mean. P-values for log-transformed data calculated by one-sided Student’s t-test with Bonferroni correction. D, Representative human vimentin immunohistochemistry of mouse lungs quantified in C. Scale bar 5mm. E, Normalized lung photon flux in mice after 9 weeks of tail vein inoculation of 300,000 M2B cells. P-value calculated by one-tailed Wilcoxon rank-sum test. N=6 for both groups. Whiskers extend to data extremes. F, Representative bioluminescence images from the experiment shown in E. G, Histological quantification of lung metastatic foci from representative lungs of the experiment shown in E. N=3 for both groups. Horizontal bars represent sample mean. P-value for log-transformed data calculated by one-sided Student’s t-test. H, Representative human vimentin immunohistochemistry of mouse lungs quantified in G. Scale bar 5mm. I, In vitro proliferation of M1A cells transduced with the indicated constructs. N=3 for each time point. Whiskers represent S.D. Two-sided Student’s t-test. P=0.82 and 0.69 for iMAE1.1 and iMAE-126, respectively.
Figure 4
Figure 4. The co-regulatory MAE-1/MAE-126 enhancer cluster supports CXCR4 expression.
A, Heatmap showing Hi-C signal and predicted TADs (green triangles) in a 3.6Mb region flanking the MAE-1/MAE-126 locus in 786-O and M1A cells. TAD containing the MAE-1/MAE-126 locus highlighted with an asterisk. B, A close-up of the TAD highlighted in panel A showing known genes and their position in relation to MAE-126 and MAE-1. C, RNA-seq data showing the effects of CRISPRi-mediated targeting of MAE-1 and MAE-126 on the expression of genes within 10Mb from MAE-1. N=6 for Ctrl, N=4 for iMAE1.1, N=4 for iMAE-1.2, N=2 for iMAE-126, technical replicates. D, mRNA expression as measured by qRT-PCR in M1A cells transduced with the indicated CRISPRi constructs. Mean of three experiments. Error bars S.E.M. E, Western blot in M1A and M2B cells transduced with the indicated CRISPRi constructs. A representative experiment of three is shown. F-G, SUZ12 (F) and H3K27me3 (G) ChIP followed by qPCR analysis at the CXCR4 locus in response to CRISPRa-mediated enhancer activation. Mean of two experiments. Error bars S.E.M. H, CXCR4 mRNA expression as measured by qRT-PCR in 786-O cells expressing the indicated constructs. Mean of three experiments. Error bars S.E.M. I, CXCR4 protein expression in 786-O cells as measured by immunoblotting. A representative experiment of three is shown.
Figure 5
Figure 5. CXCR4 is the functional mediator of MAE-1/MAE-126-driven metastatic colonization.
A, Normalized lung photon flux in mice 5 weeks after tail vein inoculation of 300,000 M1A cells expressing the indicated constructs. N=9 for Ctrl-EV, N=8 for iMAE-1.1-EV, N=9 for iMAE-1.1-CXCR4. P-value calculated by one-tailed Wilcoxon rank-sum test with Bonferroni correction. Whiskers extend to data extremes. B, Representative bioluminescence images from the experiment shown in A. C, Histological quantification of lung metastatic foci from representative lungs of the experiment shown in A. N=3 for all groups. Horizontal bars represent sample mean. P-values for log-transformed data calculated by one-sided Student’s t-test with Bonferroni correction. D, Representative human vimentin immunohistochemistry of mouse lungs quantified in C. Scale bar 5mm.
Figure 6
Figure 6. Mechanisms of MAE-1/MAE-126 activation in metastatic ccRCC.
A, Transient reporter assay showing the effects of mutated HIF motif on MAE-126 enhancer activity in M1A cells. Mean of three experiments. Error bars S.E.M. Two-sided Student’s t-test. B, Bottom, genomic MAE-1 deletion profile in M1A cells targeted by sgMAE-1. Top, mammalian sequence alignment of the most commonly deleted region, a conserved RELA/p65 motif highlighted in red. sgMAE-1 PAM sequence underlined in black. C, CXCR4 mRNA expression in M1A cells as measured by qRT-PCR. Mean of three experiments. Error bars S.E.M. D, CXCR4 protein expression in M1A cells as measured by immunoblotting. A representative experiment of three is shown. E, Transient reporter assay showing the effects of mutated RELA/p65 motif on MAE-1 enhancer activity in M1A cells. Mean of five experiments. Error bars S.E.M. Two-sided Student’s t-test. F, Correlation of CXCR4 mRNA expression with NF-kappaB activity in the TCGA ccRCC data set. N=506; PCC, Pearson’s correlation coefficient. G, p65 ChIP-seq data in the MAE-1 locus. Black bar indicates MAE-1. H, Effects of CRISPR/Cas9-mediated targeting of MAE-1 on lung metastatic fitness of M1A cells. Normalized lung photon flux in mice after 9 weeks of tail vein inoculation of 300,000 cells. N=6 for both groups. One-tailed Wilcoxon rank-sum test. Whiskers extend to data extremes. I, Representative bioluminescence images from the experiment shown in H. J, Histological quantification of lung metastatic foci from representative lungs of the experiment shown in H. N=3 for both groups. Horizontal bars represent sample mean. P-values for log-transformed data calculated by one-sided Student’s t-test.
Figure 7
Figure 7. Cross-lineage enhancer co-option in metastatic ccRCC.
A, H3K27ac ChIP-seq signal in the orthologous mouse Mae-1 region. Black bar indicates Mae-1. B, Heatmap showing the activity of 294/314 MAEs in 111 physiological tissues from the Roadmap Epigenomics project. Column color code indicates normal tissue type, for a description of associated epigenetic states see Supplementary Figure 15B. Red bar highlights an enhancer module active in various lymphoid tissues. C, ENCODE p65 ChIP-seq data showing binding at the MAE-1 locus (black rectangle) in human lymphoblastoid cell lines. D, Model: Metastasis genes are activated via cross-lineage co-option of enhancer modules that collaborate with previously activated enhancers (grey peaks) to increase metastatic fitness.

Similar articles

Cited by

References

    1. Fidler IJ. The pathogenesis of cancer metastasis: the 'seed and soil' hypothesis revisited. Nature Reviews Cancer. 2003;3:453–8. - PubMed
    1. Lambert AW, Pattabiraman DR, Weinberg RA. Emerging Biological Principles of Metastasis. Cell. 2017;168:670–91. - PMC - PubMed
    1. Massagué J, Obenauf AC. Metastatic colonization by circulating tumour cells. Nature. 2016;529:298–306. - PMC - PubMed
    1. Turajlic S, Swanton C. Metastasis as an evolutionary process. Science. 2016;352:169–75. - PubMed
    1. Vanharanta S, Massagué J. Origins of metastatic traits. Cancer Cell. 2013;24:410–21. - PMC - PubMed

Publication types

Substances