American Gut: an Open Platform for Citizen Science Microbiome Research
- PMID: 29795809
- PMCID: PMC5954204
- DOI: 10.1128/mSystems.00031-18
American Gut: an Open Platform for Citizen Science Microbiome Research
Abstract
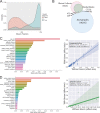
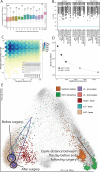
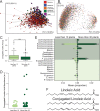
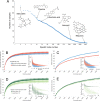
Although much work has linked the human microbiome to specific phenotypes and lifestyle variables, data from different projects have been challenging to integrate and the extent of microbial and molecular diversity in human stool remains unknown. Using standardized protocols from the Earth Microbiome Project and sample contributions from over 10,000 citizen-scientists, together with an open research network, we compare human microbiome specimens primarily from the United States, United Kingdom, and Australia to one another and to environmental samples. Our results show an unexpected range of beta-diversity in human stool microbiomes compared to environmental samples; demonstrate the utility of procedures for removing the effects of overgrowth during room-temperature shipping for revealing phenotype correlations; uncover new molecules and kinds of molecular communities in the human stool metabolome; and examine emergent associations among the microbiome, metabolome, and the diversity of plants that are consumed (rather than relying on reductive categorical variables such as veganism, which have little or no explanatory power). We also demonstrate the utility of the living data resource and cross-cohort comparison to confirm existing associations between the microbiome and psychiatric illness and to reveal the extent of microbiome change within one individual during surgery, providing a paradigm for open microbiome research and education. IMPORTANCE We show that a citizen science, self-selected cohort shipping samples through the mail at room temperature recaptures many known microbiome results from clinically collected cohorts and reveals new ones. Of particular interest is integrating n = 1 study data with the population data, showing that the extent of microbiome change after events such as surgery can exceed differences between distinct environmental biomes, and the effect of diverse plants in the diet, which we confirm with untargeted metabolomics on hundreds of samples.
Figures


Similar articles
-
Systematic Analysis of Impact of Sampling Regions and Storage Methods on Fecal Gut Microbiome and Metabolome Profiles.mSphere. 2020 Jan 8;5(1):e00763-19. doi: 10.1128/mSphere.00763-19. mSphere. 2020. PMID: 31915218 Free PMC article.
-
Correcting for Microbial Blooms in Fecal Samples during Room-Temperature Shipping.mSystems. 2017 Mar 7;2(2):e00199-16. doi: 10.1128/mSystems.00199-16. eCollection 2017 Mar-Apr. mSystems. 2017. PMID: 28289733 Free PMC article.
-
Extreme Dysbiosis of the Microbiome in Critical Illness.mSphere. 2016 Aug 31;1(4):e00199-16. doi: 10.1128/mSphere.00199-16. eCollection 2016 Jul-Aug. mSphere. 2016. PMID: 27602409 Free PMC article.
-
The Rare Biosphere: This report is based on a colloquium convened by the American Academy of Microbiology on April 27–29, 2009 in San Francisco, CA.Washington (DC): American Society for Microbiology; 2011. Washington (DC): American Society for Microbiology; 2011. PMID: 32809309 Free Books & Documents. Review.
-
The Effects of Temperature on Animal Gut Microbiomes.Front Microbiol. 2020 Mar 10;11:384. doi: 10.3389/fmicb.2020.00384. eCollection 2020. Front Microbiol. 2020. PMID: 32210948 Free PMC article. Review.
Cited by
-
How important are fatty acids in human health and can they be used in treating diseases?Gut Microbes. 2024 Jan-Dec;16(1):2420765. doi: 10.1080/19490976.2024.2420765. Epub 2024 Oct 27. Gut Microbes. 2024. PMID: 39462280 Free PMC article. Review.
-
Akkermansia beyond muciniphila - emergence of new species Akkermansia massiliensis sp. nov.Microbiome Res Rep. 2024 Jun 25;3(3):37. doi: 10.20517/mrr.2024.28. eCollection 2024. Microbiome Res Rep. 2024. PMID: 39421258 Free PMC article.
-
Empirically establishing drug exposure records directly from untargeted metabolomics data.bioRxiv [Preprint]. 2024 Oct 26:2024.10.07.617109. doi: 10.1101/2024.10.07.617109. bioRxiv. 2024. PMID: 39416075 Free PMC article. Preprint.
-
Cardiovascular Disease May Be Triggered by Gut Microbiota, Microbial Metabolites, Gut Wall Reactions, and Inflammation.Int J Mol Sci. 2024 Oct 2;25(19):10634. doi: 10.3390/ijms251910634. Int J Mol Sci. 2024. PMID: 39408963 Free PMC article. Review.
-
Gut microbiome in two high-altitude bird populations showed heterogeneity in sex and life stage.FEMS Microbes. 2024 Jul 4;5:xtae020. doi: 10.1093/femsmc/xtae020. eCollection 2024. FEMS Microbes. 2024. PMID: 39385800 Free PMC article.
References
-
- Thompson LR, Sanders JG, McDonald D, Amir A, Ladau J, Locey KJ, Prill RJ, Tripathi A, Gibbons SM, Ackermann G, Navas-Molina JA, Janssen S, Kopylova E, Vázquez-Baeza Y, González A, Morton JT, Mirarab S, Zech Xu Z, Jiang L, Haroon MF, Kanbar J, Zhu Q, Jin Song S, Kosciolek T, Bokulich NA, Lefler J, Brislawn CJ, Humphrey G, Owens SM, Hampton-Marcell J, Berg-Lyons D, McKenzie V, Fierer N, Fuhrman JA, Clauset A, Stevens RL, Shade A, Pollard KS, Goodwin KD, Jansson JK, Gilbert JA, Knight R, Earth Microbiome Project . 2017. A communal catalogue reveals Earth’s multiscale microbial diversity. Nature 551:457–463. doi:10.1038/nature24621. - DOI - PMC - PubMed
-
- Falony G, Joossens M, Vieira-Silva S, Wang J, Darzi Y, Faust K, Kurilshikov A, Bonder MJ, Valles-Colomer M, Vandeputte D, Tito RY, Chaffron S, Rymenans L, Verspecht C, De Sutter L, Lima-Mendez G, D’hoe K, Jonckheere K, Homola D, Garcia R, Tigchelaar EF, Eeckhaudt L, Fu J, Henckaerts L, Zhernakova A, Wijmenga C, Raes J. 2016. Population-level analysis of gut microbiome variation. Science 352:560–564. doi:10.1126/science.aad3503. - DOI - PubMed
-
- Qin J, Li R, Raes J, Arumugam M, Burgdorf KS, Manichanh C, Nielsen T, Pons N, Levenez F, Yamada T, Mende DR, Li J, Xu J, Li S, Li D, Cao J, Wang B, Liang H, Zheng H, Xie Y, Tap J, Lepage P, Bertalan M, Batto JM, Hansen T, Le Paslier D, Linneberg A, Nielsen HB, Pelletier E, Renault P, Sicheritz-Ponten T, Turner K, Zhu H, Yu C, Li S, Jian M, Zhou Y, Li Y, Zhang X, Li S, Qin N, Yang H, Wang J, Brunak S, Doré J, Guarner F, Kristiansen K, Pedersen O, Parkhill J, Weissenbach J, MetaHIT Consortium, Bork P, Ehrlich SD, Wang J, Wang J. 2010. A human gut microbial gene catalogue established by metagenomic sequencing. Nature 464:59–65. doi:10.1038/nature08821. - DOI - PMC - PubMed
-
- Zhernakova A, Kurilshikov A, Bonder MJ, Tigchelaar EF, Schirmer M, Vatanen T, Mujagic Z, Vila AV, Falony G, Vieira-Silva S, Wang J, Imhann F, Brandsma E, Jankipersadsing SA, Joossens M, Cenit MC, Deelen P, Swertz MA, LifeLines Cohort Study, Weersma RK, Feskens EJM, Netea MG, Gevers D, Jonkers D, Franke L, Aulchenko YS, Huttenhower C, Raes J, Hofker MH, Xavier RJ, Wijmenga C, Fu J. 2016. Population-based metagenomics analysis reveals markers for gut microbiome composition and diversity. Science 352:565–569. doi:10.1126/science.aad3369. - DOI - PMC - PubMed
Grants and funding
LinkOut - more resources
Full Text Sources
Other Literature Sources

