. 2018 Jul 6;46(12):6166-6187.
doi: 10.1093/nar/gky389.

PUF60-activated exons uncover altered 3' splice-site selection by germline missense mutations in a single RRM

Affiliations

PUF60-activated exons uncover altered 3' splice-site selection by germline missense mutations in a single RRM

Jana Královicová et al. Nucleic Acids Res. .

Abstract

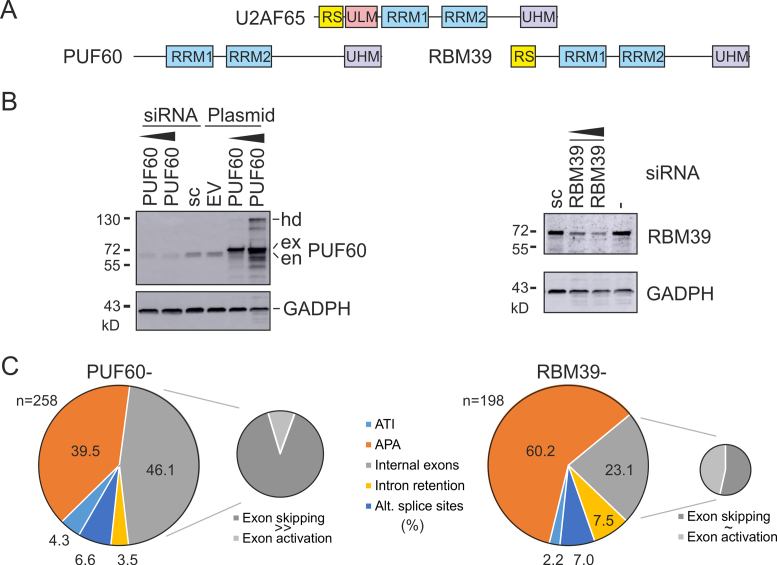
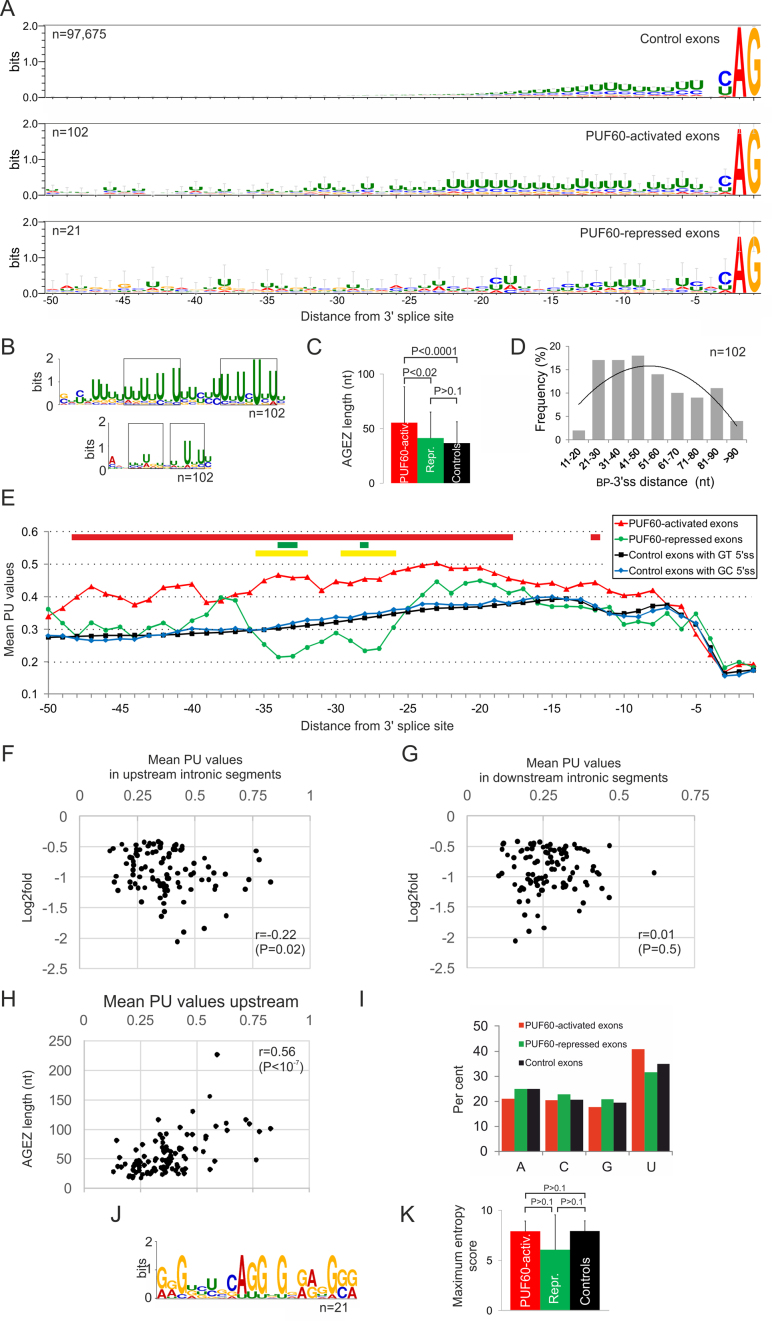
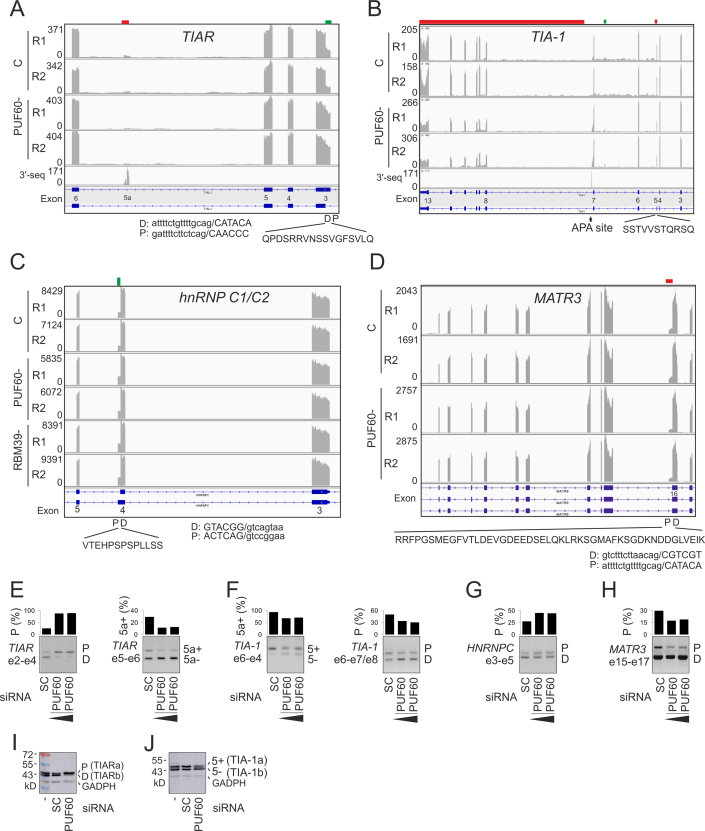
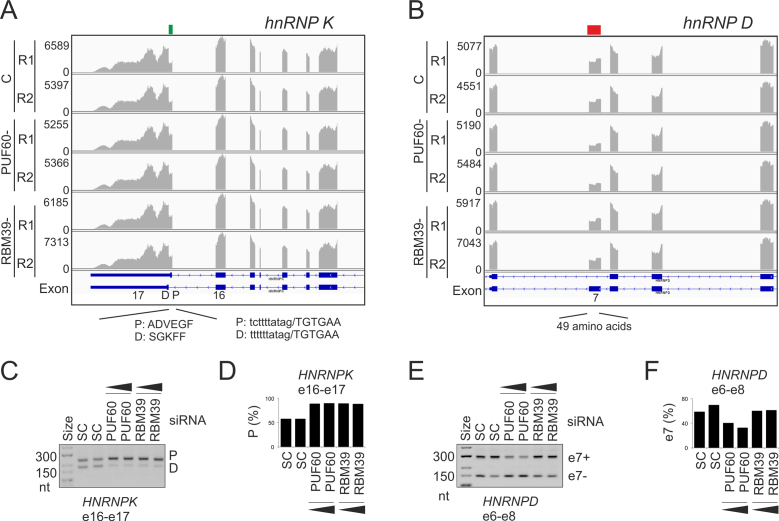
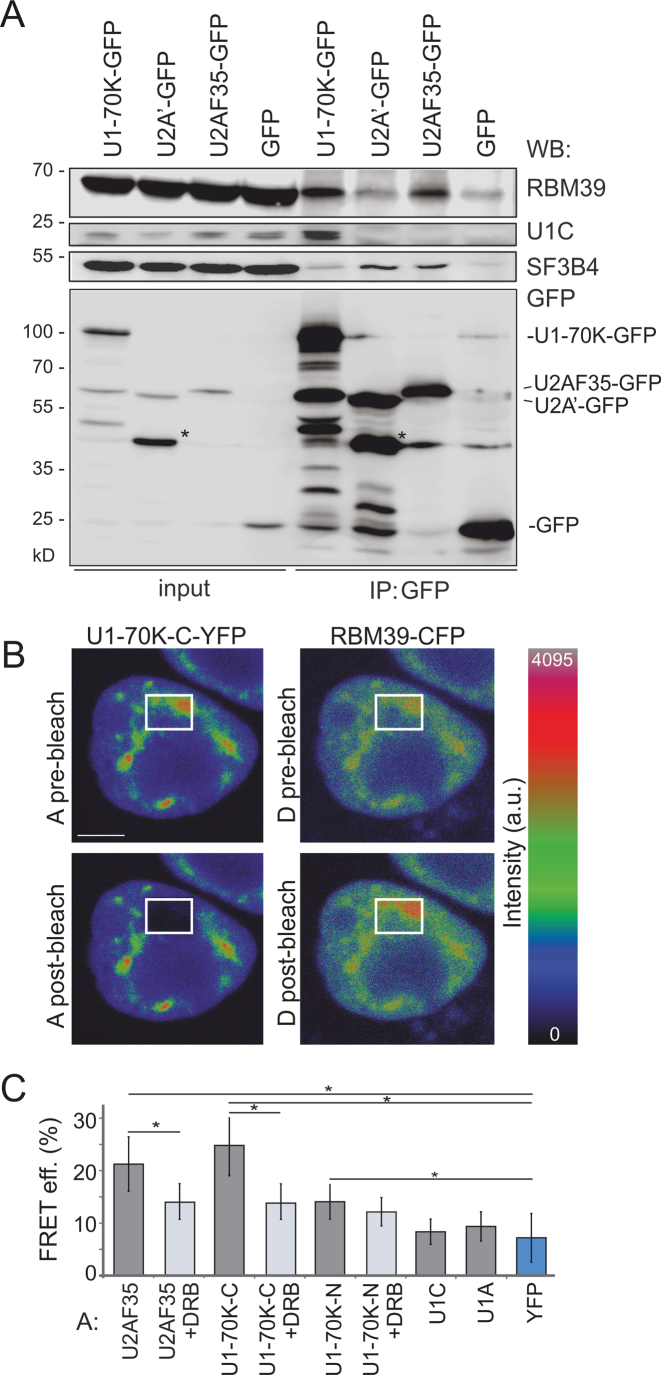
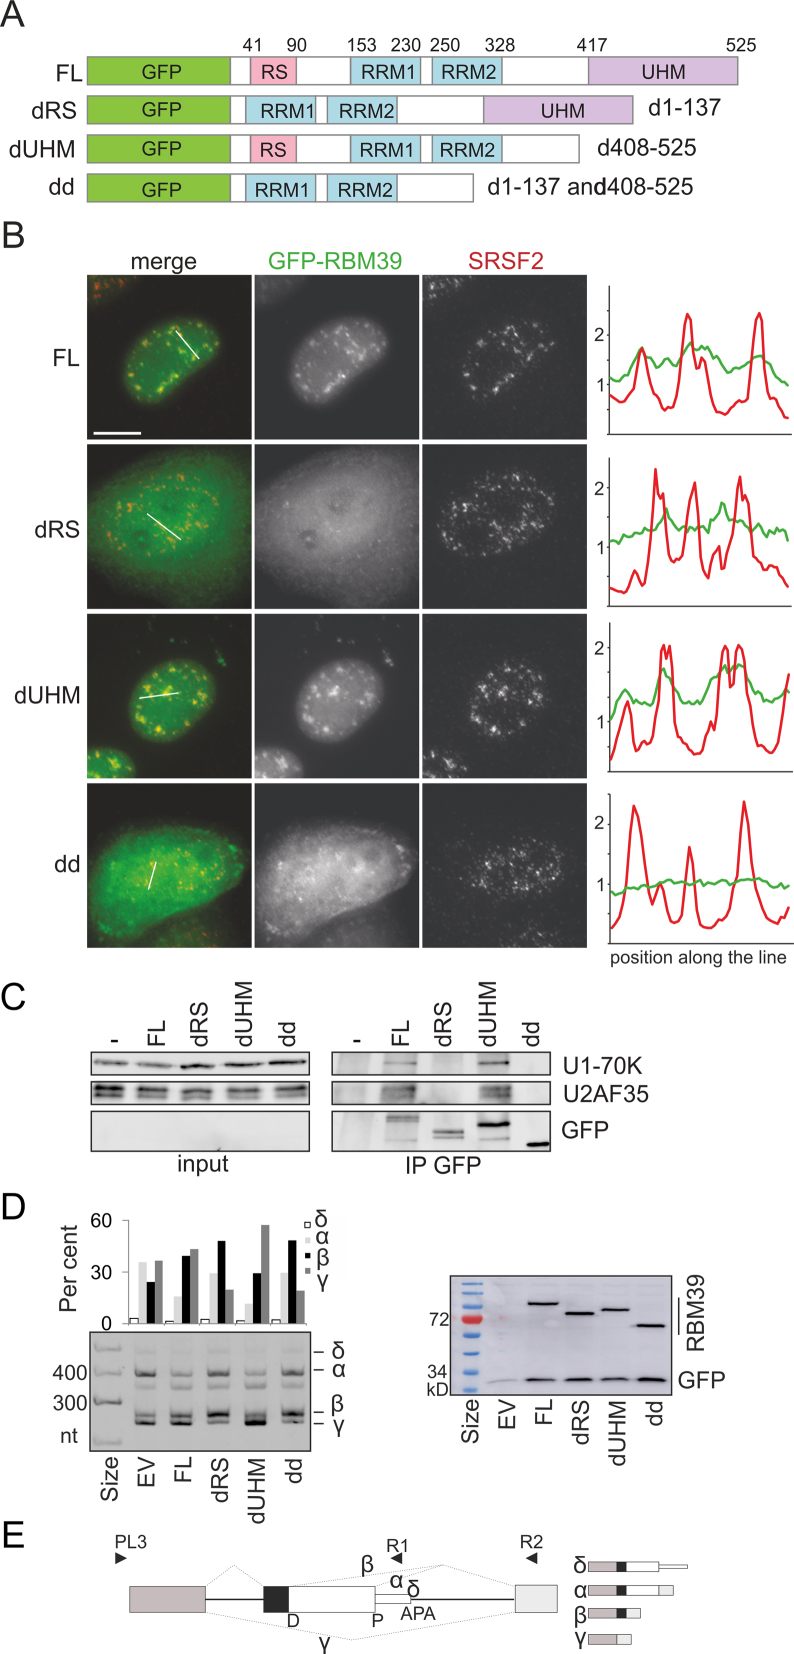
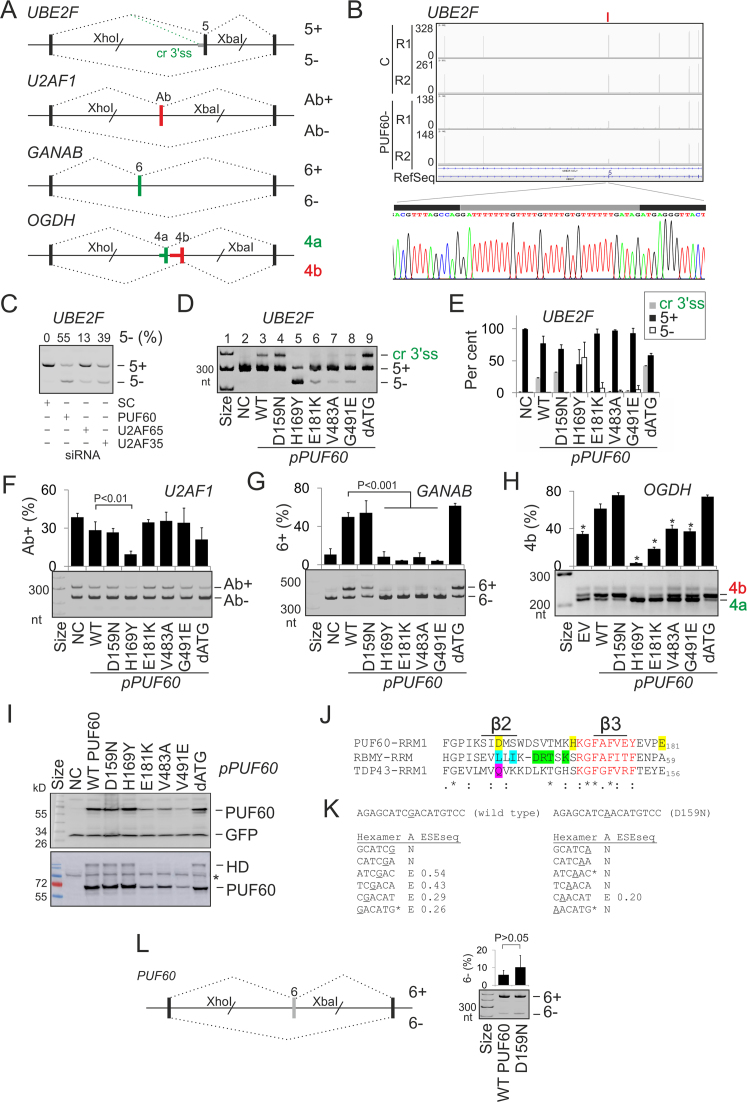
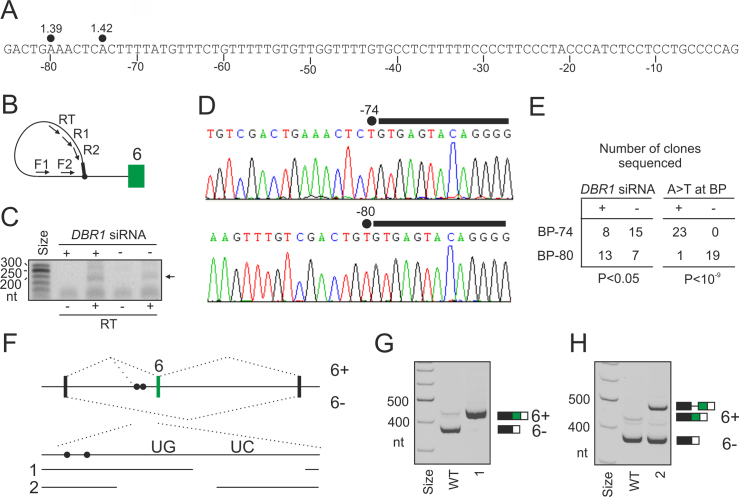
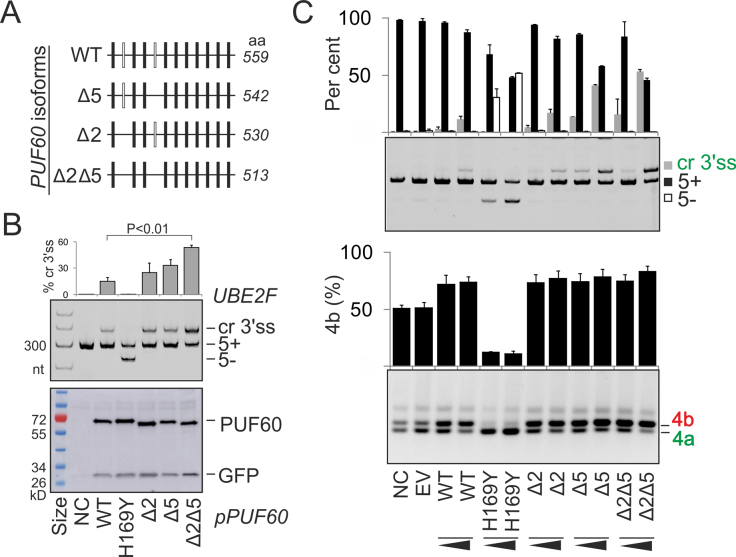
PUF60 is a splicing factor that binds uridine (U)-rich tracts and facilitates association of the U2 small nuclear ribonucleoprotein with primary transcripts. PUF60 deficiency (PD) causes a developmental delay coupled with intellectual disability and spinal, cardiac, ocular and renal defects, but PD pathogenesis is not understood. Using RNA-Seq, we identify human PUF60-regulated exons and show that PUF60 preferentially acts as their activator. PUF60-activated internal exons are enriched for Us upstream of their 3' splice sites (3'ss), are preceded by longer AG dinucleotide exclusion zones and more distant branch sites, with a higher probability of unpaired interactions across a typical branch site location as compared to control exons. In contrast, PUF60-repressed exons show U-depletion with lower estimates of RNA single-strandedness. We also describe PUF60-regulated, alternatively spliced isoforms encoding other U-bound splicing factors, including PUF60 partners, suggesting that they are co-regulated in the cell, and identify PUF60-regulated exons derived from transposed elements. PD-associated amino-acid substitutions, even within a single RNA recognition motif (RRM), altered selection of competing 3'ss and branch points of a PUF60-dependent exon and the 3'ss choice was also influenced by alternative splicing of PUF60. Finally, we propose that differential distribution of RNA processing steps detected in cells lacking PUF60 and the PUF60-paralog RBM39 is due to the RBM39 RS domain interactions. Together, these results provide new insights into regulation of exon usage by the 3'ss organization and reveal that germline mutation heterogeneity in RRMs can enhance phenotypic variability at the level of splice-site and branch-site selection.


Figures

Figure 1.
Figure 1.
RNA-Seq of HEK293 cells depleted of PUF60 and RBM39. (A) Domain structure. (B) Western blot analysis of HEK293 cells lacking or overexpressing PUF60 (left panel) and lacking RBM39 (right panel). hd, homodimers; ex, exogenous; en, endogenous protein; sc, scrambled siRNA controls; EV, empty vector. (C) Distribution of RNA processing events altered by depletion of PUF60 and RBM39. Each event was confirmed in the genome browser by visualizing complete transcripts and cleaned APA sites annotated in the APA atlas (43).
Figure 2.
Figure 2.
Sequence characteristics of PUF60-regulated exons. (A) Information content upstream of PUF60-activated and -repressed exons and controls. The overall height of the stack shows the relative frequency of the indicated nucleotides at each position. Error bars display Bayesian 95% confidence intervals. Number of exons is to the left. (B) De novo motif discovery upstream of PUF60-activated exons with MEME. The upper panel shows a motif with the lowest E value (2.1e−28) for input sequences between positions –100 and –4 relative to 3′ss; the lower panel shows a motif with the lowest E value for input sequences between –50 and –18. Rectangles denote two subregions with alternating uridines. (C) AGEZ length of PUF60-regulated and control exons. Error bars, SD. P-values were derived by the Wilcoxon–Mann–Whitney test. (D) Frequency distribution of BP-to-3′ss distances predicted for PUF60-activated exons. (E) Mean PU values, estimating RNA singlestrandedness, upstream of PUF60-regulated and control exons. Coloured rectangles at the top denote significant intron positions when comparing the means of PUF60-activated exons and controls (red; P-values <0.01), PUF60-repressed exons and controls (green, P-values <0.1) and PUF60-activated and -repressed exons (yellow, P-values <0.05). (F, G) Correlation of the mean PU values upstream (F) or downstream (G) of 102 PUF60-activated 3′ss with their log2fold values. The PU means were computed for positions –4 to –100 and +7 to +100 upstream and downstream of each exon, respectively. (H) The AGEZ length correlates with the predicted RNA singlestrandedness upstream of PUF60-activated 3′ss. (I) Mean nucleobase frequencies in 100-nt intronic flanks upstream of PUF60-regulated exons. (J). De novo motif identified upstream of PUF60-repressed exons (E-value: 3.6e−4). (K) Mean maximum entropy scores (50) for 3′ss of PUF60-regulated exons and controls. Error bars, SD.
Figure 3.
Figure 3.
Alternative splicing of U-binding interaction partners of PUF60 in depleted cells. (A–D) Genome browser views of RNA-Seq tracks in control (C) and depleted (–) cells. Down- and up-regulated exonic segments are marked by red and green rectangles at the top, respectively. Y-axis, sequencing read numbers. R1, R2; replicates. Peptides encoded by PUF60/RBM39-dependent exons are shown at the bottom together with their intron-proximal (P) or -distal (D) 3′ss. The 3′-seq tracts superimpose the APA atlas data (43). (A) TIAR. (B) TIA-1. (C) HNRNPC. (D) MATR3/SNHG4. (E–H) RT-PCR validation from independent transfections. The final siRNA concentrations were 50 and 90 nM. SC, scrambled controls. Exons (e) containing amplification primers (Supplementary Table S1) are to the left and RNA products are to the right in each panel. Columns show the relative abundance of the indicated transcripts (shown in panels A–D). (I, J) Immunoblotting of PUF60- and control cells with anti-TIAR (I) and anti-TIA-1 (J) antibodies. The extra band between TIA-1a and TIA-1b is likely to result from phosphorylated residue(s) reported in the peptide shown in panel B (http://www.phosphosite.org).
Figure 4.
Figure 4.
Alternative splicing of hnRNP genes regulated by PUF60/RBM39. (A) HNRNPK. (B) HNRNPD. (C–F) RT-PCR validation. Down- and up-regulated exonic segments are marked by red and green rectangles at the top, respectively. The siRNA concentrations were 50 and 90 nM. SC, scrambled siRNA controls. Exons (e) targeted by amplification primers (Supplementary Table S1) are at the bottom. Columns show the relative abundance of the indicated transcripts (shown in panels A and B).
Figure 5.
Figure 5.
RBM39 interactions with spliceosome components. (A) RBM39 interacts with U1 snRNP and U2AF. Interaction of RBM39 with the U1-specific protein U1-70K, the U2-specific protein U2A’ and the small subunit of U2AF was assayed by immunoprecipitations. HeLa cells were transiently transfected with U1-70K-GFP, U2A′-GFP or U2AF35-GFP, immunoprecipitated with anti-GFP antibodies and probed with antibodies shown to the right. U1C and SF3B4 served as positive controls for immunoprecipitations for U1-70K-GFP and U2A’-GFP, respectively. Asterisks denote a partially degraded U2A’-GFP. (B, C) RBM39 interactions monitored by FRET. Cells were transiently co-transfected with RBM39-CFP and C-terminally YFP-tagged U1-70K. (B) YFP was bleached in a small region comprising the nucleoplasm and nuclear speckles; CFP fluorescence was measured before and after bleaching. Fluorescence of RBM39 increased after bleaching of U1-70K-YFP [cf. CFP fluorescence in the bleached region (rectangles) before (top panel) and after (bottom panel) bleaching]. A, acceptor; D, donor; scale bar, 5 μm. (C) Quantification of individual donor-acceptor FRET efficiencies upon the inhibition of RNA polymerase II by DRB. Columns indicate means; errors bars SEMs. Interaction between RBM39-CFP and U2AF35-YFP (22) served as a positive control and interaction between RBM39-CFP and YFP as a negative control. Significantly different means are denoted by an asterisk (P< 0.01; t-test).
Figure 6.
Figure 6.
RBM39 RS domain is responsible for nuclear localization and interactions with U1-70K and U2AF35. (A) RBM39 domains deletion (d) constructs. FL, full-length protein; dd, double deletion. Deleted amino acids are to the right. (B) The RS domain of RBM39 is important for localization into nuclear speckles. HeLa cells expressing GFP-tagged RBM39 constructs (green) were immunostained with the anti-SRSF2 antibody (red), which marks nuclear speckles. Scale bar, 10 μm. y-axis, fluorescence intensity (arbitrary units ×103). (C) The N-terminal segment with the RS domain is responsible for interaction with U1-70K and U2AF35. Transiently transfected GFP-tagged RBM39 mutants were immunoprecipitated using anti-GFP antibodies and co-precipitated proteins were visualized by western blotting. Non-transfected HeLa cells served as a negative control. (D) Isoform expression of exogenous poliovirus receptor (PVR) transcripts (left panel) in cells transiently co-transfected with RBM39 deletion constructs and GFP plasmids as transfection/loading controls (right panel). The membrane was incubated with anti-GFP antibodies. EV, empty vector. (E) PVR minigene schematics. D,P, distal and proximal 5′ss; arrowheads, PCR primers (Supplementary Table S1); dotted lines, PVR isoforms (schematically shown to the right).
Figure 7.
Figure 7.
Splicing outcomes of PD alleles. (A) Schematics of PUF60-dependent splicing reporter constructs. Exons are shown as boxes, introns as horizontal lines and canonical/aberrant RNA products (named to the right) as dotted lines above/below the pre-mRNA, respectively. Cr3′ss, cryptic 3′ss. (B) A genome browser view of RNA-Seq tracks of UBE2F from control (C) and PUF60- cells. For full legend, see Figure 3. RNA product employing Cr3′ss in cells overexpressing PUF60 is sequenced at the bottom. Grey rectangle shows a 33-nt insertion. (C) UBE2F exon 5 inclusion in cells lacking PUF60, U2AF65 and U2AF35. Protein depletion is shown in Supplementary Figure 6D. (D) Splicing of exogeneous UBE2F transcripts in cells overexpressing WT and mutated PUF60 plasmids. NC, no plasmid control. RNA products (right) were amplified with vector primers PL3 and PL4 (46). PD alleles (bottom) are in Table 1. Construct dATG lacked exons 1–2, translating PUF60 from a downstream start codon in exon 3 (panel I), possibly representing the outcome of PD-associated 5′ss mutations of exon 1 (33,34), which lead to a loss of canonical start codon. (E) The relative abundance of mRNA products in panel D. Error bars are SDs of two transfections. (F–H) Splicing pattern of exogenous U2AF1 (F), GANAB (G) and OGDH (H) transcripts in cells overexpressing PUF60 constructs shown at the bottom. I, Immunoblots of HEK293 cultures transiently transfected with WT and mutated PUF60. Shown are two independent transfections, one with 30 (upper panel) and the other with 60 (lower panel) μg of protein lysates in each lane. Membranes were blotted with anti-myc and anti-GFP antibodies. HD, homodimers; asterisk, a non-specific band. J, Alignments of PUF60-RRM1 (Q9UHX1; aa 129–207), RBMY-RRM (Q15415; aa 8–85) and TDP43-RRM1 (Q13148; aa 104–200) around residues mutated in PD (shown in yellow). RNP1 is in red; RBMY residues contacting an RNA loop and stem (90) are in blue and green, respectively, and a DNA-interacting residue TDP43 Q134 (89) is in magenta. Alignment was with full-length RRMs using Clustal Omega (v.1.2.4). (K) Hexamer profile across point mutation c.475G>A (underlined) leading to substitution D159N. ‘A’, assignment of splicing neutral (N) and enhancing (E) motifs; ESESeq scores were determined previously for all hexamers (129). Asterisks denote splicing regulatory elements reported by Goren et al. (130). (L) PUF60 reporter. Cloning primers are in Supplementary Table S1. Mutation D159N is encoded by exon 6, its inclusion levels are to the right. Error bars are SDs of two transfections.
Figure 8.
Figure 8.
Functional and structural PPT partitioning. (A) Nucleotide sequence upstream of GANAB exon 6. Predicted BP adenines are denoted by closed circles; numbers indicate their SVM scores (49). B, BP mapping primers (Supplementary Table S1). The 5′ end of intron is denoted by a black rectangle. C, PCR products amplified from DBR1-depleted (+) and control (–) cultures. Samples were reverse-transcribed in the presence (RT+) or absence (RT–) of reverse transcriptase. Products shown in panel D are denoted by an arrow. (D) Representative sequence chromatograms showing A>T mismatches at the lariat junction, which occurs when RT traverses the noncanonical 2′ to 5′ linkage between the 5′ss nucleotide and BP (66,92). (E) Distribution of BPs mapped to positions –74 and –80 in DBR1-depleted cells and controls (left panel) and with/without A>T substitutions at the lariat junction (right panel). P-values were derived from Fisher's exact tests. (F) Deletions of the UC- and UG-rich segments in the PPT of the WT GANAB reporter construct (deletion 1 and 2). Closed circles show two BPs mapped in panels B–D. (GH) Splicing pattern of the two deletion constructs after transient transfection into HEK293 cells. RNA products are to the right. Cryptic 3′ss activated by deletion 2 is 91 nt upstream of the natural 3′ss of exon 6 and is schematically shown in panel F.
Figure 9.
Figure 9.
Alternative splicing of PUF60 affects 3′ss choice. (A) Exon structure of tested PUF60 mRNA isoforms. (B) UBE2E splicing pattern in HEK293 cells individually expressing PUF60 isoforms (upper panel). Their expression was assayed by the anti-myc antibodies (lower panel). NC, no plasmid control, H169Y, a negative control for cr3′ss. Error bars are SDs of two transfections. P-value was derived by an unpaired t-test. (C) Exon usage of UBE2F and OGDH reporters (Figure 7A) cotransfected with plasmids expressing PUF60 isoforms. Error bars, SDs of two transfections.

Similar articles

Cited by

References

    1. Wahl M.C., Will C.L., Lührmann R.. The spliceosome: design principles of a dynamic RNP machine. Cell. 2009; 136:701–718. - PubMed
    1. Ruskin B., Zamore P.D., Green M.R.. A factor, U2AF, is required for U2 snRNP binding and splicing complex assembly. Cell. 1988; 52:207–219. - PubMed
    1. Zamore P.D., Green M.R.. Identification, purification, and biochemical characterization of U2 small nuclear ribonucleoprotein auxiliary factor. Proc. Natl. Acad. Sci. U.S.A. 1989; 86:9243–9247. - PMC - PubMed
    1. Shao C., Yang B., Wu T., Huang J., Tang P., Zhou Y., Zhou J., Qiu J., Jiang L., Li H. et al. . Mechanisms for U2AF to define 3′ splice sites and regulate alternative splicing in the human genome. Nat. Struct. Mol. Biol. 2014; 21:997–1005. - PMC - PubMed
    1. Yoshida H., Park S.Y., Oda T., Akiyoshi T., Sato M., Shirouzu M., Tsuda K., Kuwasako K., Unzai S., Muto Y. et al. . A novel 3′ splice site recognition by the two zinc fingers in the U2AF small subunit. Genes Dev. 2015; 29:1649–1660. - PMC - PubMed

Publication types

MeSH terms