. 2018 Jun;24(6):847-856.
doi: 10.1038/s41591-018-0025-7. Epub 2018 May 21.

HIV vaccine candidate activation of hypoxia and the inflammasome in CD14+ monocytes is associated with a decreased risk of SIVmac251 acquisition

Affiliations

HIV vaccine candidate activation of hypoxia and the inflammasome in CD14+ monocytes is associated with a decreased risk of SIVmac251 acquisition

Monica Vaccari et al. Nat Med. 2018 Jun.

Abstract

Qualitative differences in the innate and adaptive responses elicited by different HIV vaccine candidates have not been thoroughly investigated. We tested the ability of the Aventis Pasteur live recombinant canarypox vector (ALVAC)-SIV, DNA-SIV and Ad26-SIV vaccine prime modalities together with two ALVAC-SIV + gp120 protein boosts to reduce the risk of SIVmac251 acquisition in rhesus macaques. We found that the DNA and ALVAC prime regimens were effective, but the Ad26 prime was not. The activation of hypoxia and the inflammasome in CD14+CD16- monocytes, gut-homing CCR5-negative CD4+ T helper 2 (TH2) cells and antibodies to variable region 2 correlated with a decreased risk of SIVmac251 acquisition. By contrast, signal transducer and activator of transcription 3 activation in CD16+ monocytes was associated with an increased risk of virus acquisition. The Ad26 prime regimen induced the accumulation of CX3CR1+CD163+ macrophages in lymph nodes and of long-lasting CD4+ TH17 cells in the gut and lungs. Our data indicate that the selective engagement of monocyte subsets following a vaccine prime influences long-term immunity, uncovering an unexpected association of CD14+ innate monocytes with a reduced risk of SIVmac251 acquisition.


Conflict of interest statement

Competing interests

The US Government in conjunction with Sanofi Pasteur holds Patent 5766598: A Recombinant Attenuated ALVAC Canarypox virus Expression Vectors Containing Heterologous DNA Segments Encoding Lentiviral Gene, inventors E. Paoletti, J. Tartaglia and W. I. Cox, issued 16 June 1998, for the ALVAC vaccine. The US Government also holds Patent 7094408: Improved Immunogenicity Using a Combination of DNA and Vaccinia Virus Vector Vaccines, inventors G. Franchini, Z. Hel and G. Pavlakis, issued 22 August 2006. This patent is for the combination DNA and ALVAC poxvirus vaccines.

Figures

Fig. 1
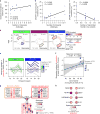
Fig. 1. Study design and differences in monocytes in the DNA and Ad26 group
a, A scematic of the study design (see. ref.). Arrows represent time of vaccination (weeks 0–24) or challenges (week 28). b, Acquisition curve in the DNA-primed group (n = 12). The black line represents 53 controls (concurrent: n = 6 and historical n = 47), and the number of challenges before viral acquisition was assessed using the log-rank test of the discrete-time proportional hazards model (P = 0.029, vaccine efficacy = 52%). c, The frequency of total monocytes in Ad26-primed (n = 10) and DNA-primed (n = 10) animals measured in the blood 2 weeks after the prime with 1× Ad26–SIV or 2× DNA–SIV (weeks 2 and 6, respectively). d,e, Changes in CCL2 (pg ml−1) (d) and in IL-18 (e) plasma levels at week 13 (n = 12 animals each), after the first ALVAC–SIV + gp120 boost, compared to prevaccination levels. f, The percentage of CXC3R1-expressing macrophages (CD163+ cells) in peripheral lymph nodes at week 13 in the Ad26 group and the DNA group (n = 12 animals each). g, The percentage of IL-17+CD4+ T cells in the blood at week 13. h,i, The levels of IL-8 (h) and IL-23 (pg ml−1) (i) in rectal mucosa cell culture after stimulation with Env peptides (n = 7 each group). j, The percentage of CD8CD3+ (CD4+) T cells in the mucosa at week 25 after phorbol 12-myristate 13-acetate (PMA) ionomycine stimulation. In panels c–j, the median (black horizontal line) is shown and the Mann–Whitney two-tailed test was used for statistical analysis.
Fig. 2
Fig. 2. Differential contribution of monocytes to protection
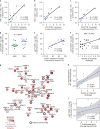
a,b, The frequency of classical (CD14+CD16) (a) and CXCR4+ (b) monocytes measured in the blood (week 27) in the DNA group correlates with the risk of SIVmac251 acquisition (the number of challenges to infection; n = 12). c, The frequency of CXCR4+ monocytes in the DNA group correlates with the number of transmitted SIV variants in the animals that became infected. A Spearman correlation was used for statistical analysis in a–c. d, Radial plots showing the relative contribution of immune subsets in protection against SIV acquisition. The normalized enrichment score (NES) estimated by GSEA is plotted for each subset and separated by vaccine regimen (Ad26–SIV: n = 11 animals, ALVAC–SIV: n = 27 animals and DNA–SIV: n = 12 animals). An NES of >0 or NES of <0 corresponds to markers of immune subsets enriched among genes associated with protection or SIV acquisition, respectively. FDR, false discovery rate; mDC, myeloid dendritic cell; pDC, plasmacytoid dendritic cell. e, Line plot showing the normalized average expression of monocyte genes associated with protection in each macaque (y axis) as a function of the four timepoints after boosting with ALVAC–SIV + gp120 (x axis) for both the Ad26–SIV (n = 11 animals) and the DNA–SIV (n = 12 animals) vaccine regimens. SLEA, sample-level enrichment analysis. f, Scatter plot showing the normalized average expression of monocyte genes associated with protection in each macaque at week 25 (y axis) as a function of the fraction of classical monocytes (CD14+CD16) among monocytes at week 27 (n = 12 animals). The linear regression fit (blue line) and the 95% confidence interval (gray region) are given on the plot. g,h, The GeneMANIA network of the monocyte genes associated with protection from SIV challenge (g) and the network of the monocyte genes associated with protection from SIV infection that are part of the inflammasome pathway of REACTOME (h). TFBS, transcription factor–binding site. Each node is colored by the Spearman correlation of the genes (24 h after the second boost) with the number of SIV challenges to infection of the DNA–SIV animals (n = 12 animals).
Fig. 3
Fig. 3. Monocytes cross-talk with CD4+ T cells and NK cells
a–c, A significant direct correlation between the frequency of total monocytes and the blood cells after the prime and env-specific T cell responses in the blood to Env peptides measured at week 27 in the DNA group (n = 11, Spearman correlation test, two-tailed, 95% confidence). d–f, The frequency of vaccine-induced TH2-type CD4+ T cell expressing α4β7, but not CCR5, was higher in the DNA group (n = 12 each, Mann–Whitney two-sided test, median represented by horizontal line) (d), and this cell subset directly correlated with CCR2+ classical monocytes in the blood at the same time (week 27) in the DNA group (e) and with the number of challenges to infection in both vaccines (f). The Jonckheere–Terpstra test was used in this analysis. g, The GeneMANIA network shows the TH2 genes associated with protection of the DNA–SIV animals (n = 12 animals) and GATA3, the main hub in the network. h,i, TH2 genes associated with protection 24 h after the second ALVAC boost. Scatters plots show the relative expression of the TH2 genes as a function of the number of SIV challenge to infection (h) and the relative expression of α4β7+CCR5 TH2 cells as a function of TH2 genes for the DNA-primed animals (n = 12 animals) (i). The linear regression fit (blue line) and the 95% confidence interval (gray region) are given on the plot. The Student’s t-test was used to assess the significance of the correlation.
Fig. 4
Fig. 4. TH2 cells are associated with NKp44+ cells and antibody response to V2
a, The DNA vaccine induced mucosal recruitment of NKp44+ cells at significantly higher counts than the Ad26 group (week 25; n = 12 and n = 11, respectively, Mann–Whitney two-sided test). The median (black horizontal line) is shown. b,c, Correlation between the numbers of NKp44+ cells measured in the mucosa in both vaccines and the levels of CCL2 in the plasma (week 13) (b) or with the percentage of vaccine-induced (Ki67+) TH2 (CXCR3CCR6) cells in the blood at week 27 (c). d, The positivity for mucosal antibody to the cyclic V2 (cV2) to E660 in the ALVAC + gp120 alum and the DNA-primed ALVAC + gp120 alum strategy showed an association with protection (log-rank test). e, Association between the frequency of TH2 cell responses induced by the ALVAC + gp120 alum strategy (ALVAC primed) and protective mucosal responses to the cyclic V2 SIVsmE600 (n = 16). A Spearman correlation test (two-tailed, 95% confidence) was used for statistical analysis in b–e.
Fig. 5
Fig. 5. Monocyte markers of protection identified in the present study are associated with the number of SIV challenges to infection in previous studies with ALVAC–SIV or gp96 SIV prime
a, Heatmaps showing the expression of the 88 monocytes markers of protection after DNA (n = 12 animals), ALVAC (n = 24 animals) or gp96 prime inoculation (n = 12 animals). All transcriptomic data collected after immunization were used to perform this analysis (DNA: 24 h and 1 or 2 weeks after immunization; ALVAC: 24 h and 1 week after immunization; gp96: 1, 7 and 17 weeks after immunization). Samples were ordered from left to right by increasing mean expression of the 88 monocytes markers. A Pearson correlation and t-test were performed to statistically evaluate the association between the markers of protection and the number of SIV challenges to infection. NA, value not available. b,c, A similar analysis (as in a) for inflammasome (b) and TH2-associated (c) genes. d, The expression of the 88 monocytes markers of protection, the NLRP3 inflammasome and TH2-associated genes are correlated with each other. A Student’s t-test was used to test the significance of the correlation. Only correlations associated with P < 0.05 are presented in the network.
Fig. 6
Fig. 6
Schematic of correlates of protection and the risk of acquisitions measured after inoculation of prime or each of the boosts in different compartments. TGF-β3, transforming growth factor-β3. Arrows represent time of vaccination (weeks 0–24) or challenges (week 28).

Similar articles

Cited by

References

    1. Pitisuttithum P, et al. Randomized, double-blind, placebo-controlled efficacy trial of a bivalent recombinant glycoprotein 120 HIV-1 vaccine among injection drug users in Bangkok, Thailand. J. Infect. Dis. 2006;194:1661–1671. - PubMed
    1. Gray GE, et al. Safety and efficacy of the HVTN 503/Phambili study of a clade-B-based HIV-1 vaccine in South Africa: a double-blind, randomised, placebo-controlled test-of-concept phase 2b study. Lancet Infect. Dis. 2011;11:507–515. - PMC - PubMed
    1. Buchbinder SP, et al. Efficacy assessment of a cell-mediated immunity HIV-1 vaccine (the Step study): a double-blind, randomised, placebo-controlled, test-of-concept trial. Lancet. 2008;372:1881–1893. - PMC - PubMed
    1. Hammer SM, et al. Efficacy trial of a DNA/rAd5 HIV-1 preventive vaccine. N. Engl. J. Med. 2013;369:2083–2092. - PMC - PubMed
    1. Rerks-Ngarm S, et al. Vaccination with ALVAC and AIDSVAX to prevent HIV-1 infection in Thailand. N. Engl. J. Med. 2009;361:2209–2220. - PubMed

Publication types

MeSH terms