. 2018 Jul;40(1):179-194.
doi: 10.3892/or.2018.6451. Epub 2018 May 17.

Knockdown of KPNA2 inhibits autophagy in oral squamous cell carcinoma cell lines by blocking p53 nuclear translocation

Affiliations

Knockdown of KPNA2 inhibits autophagy in oral squamous cell carcinoma cell lines by blocking p53 nuclear translocation

Feng Lin et al. Oncol Rep. 2018 Jul.

Abstract

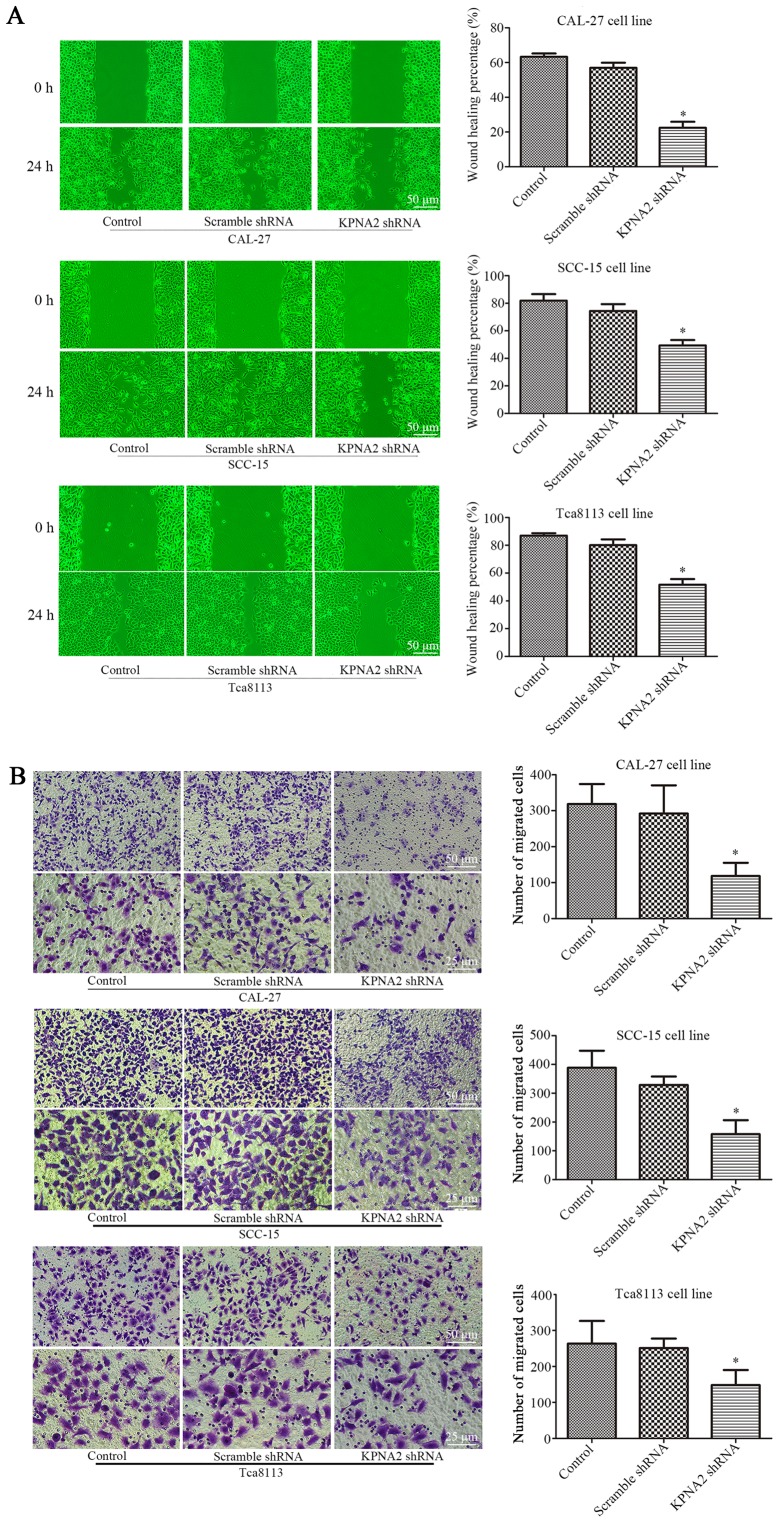
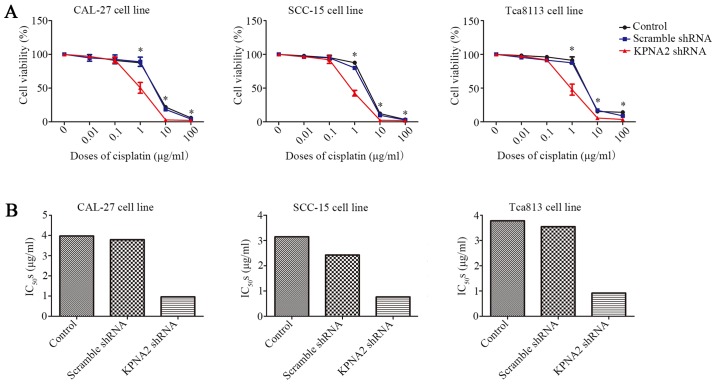
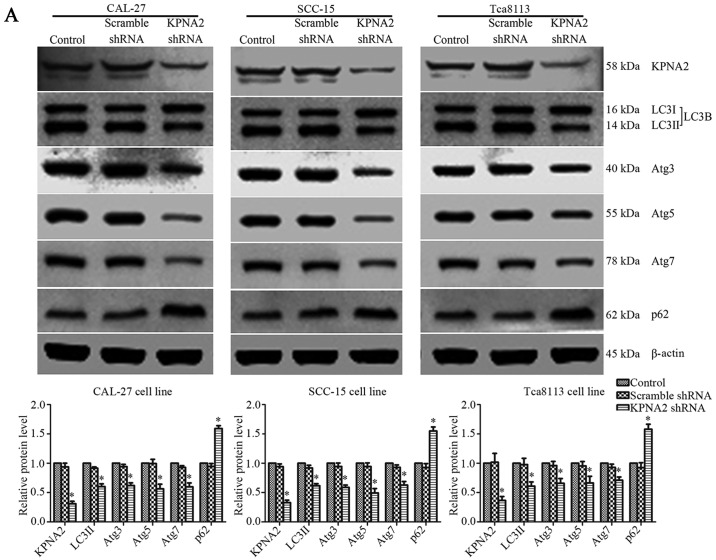
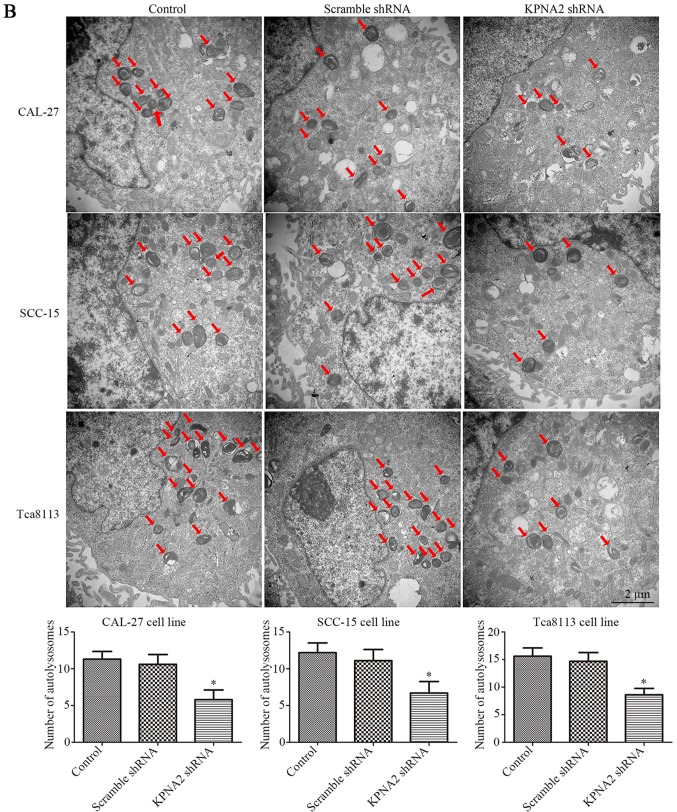
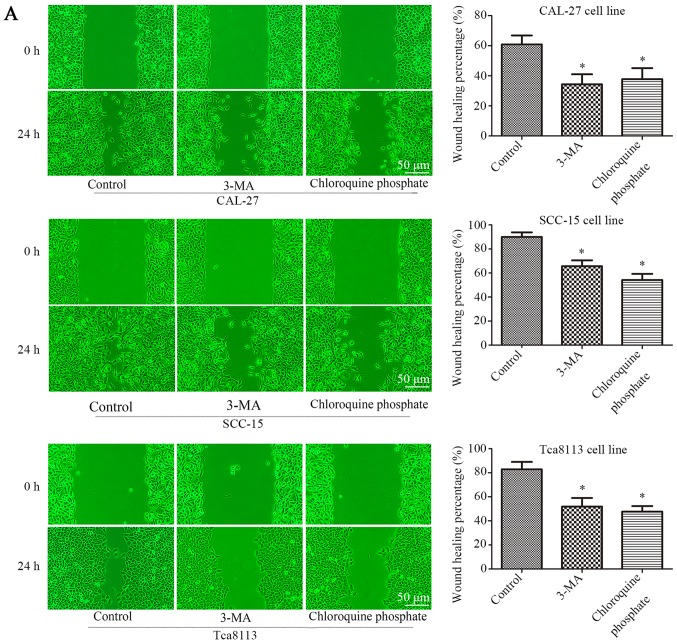
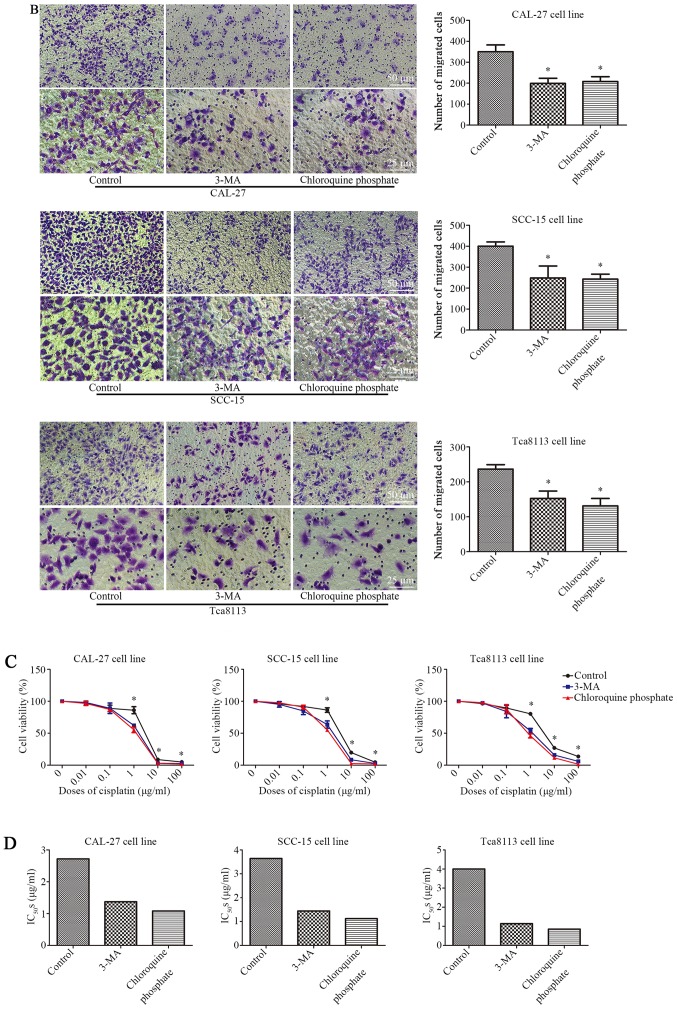
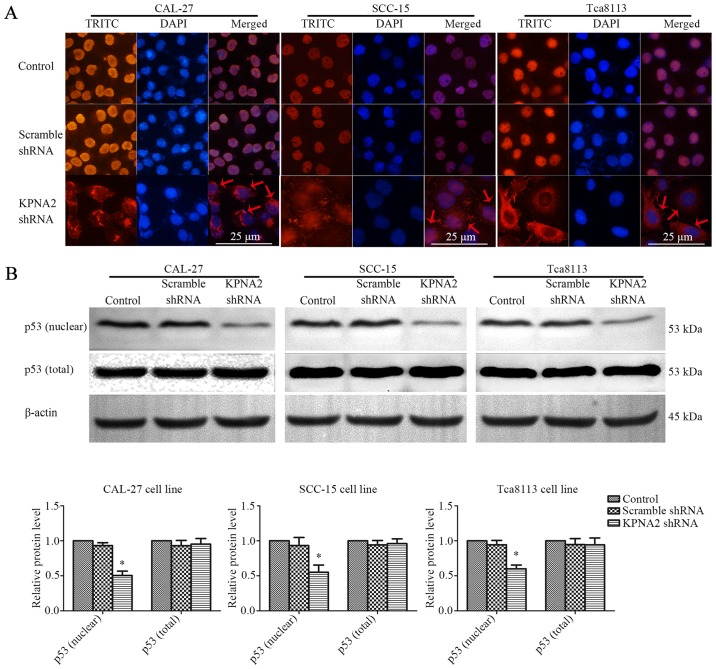
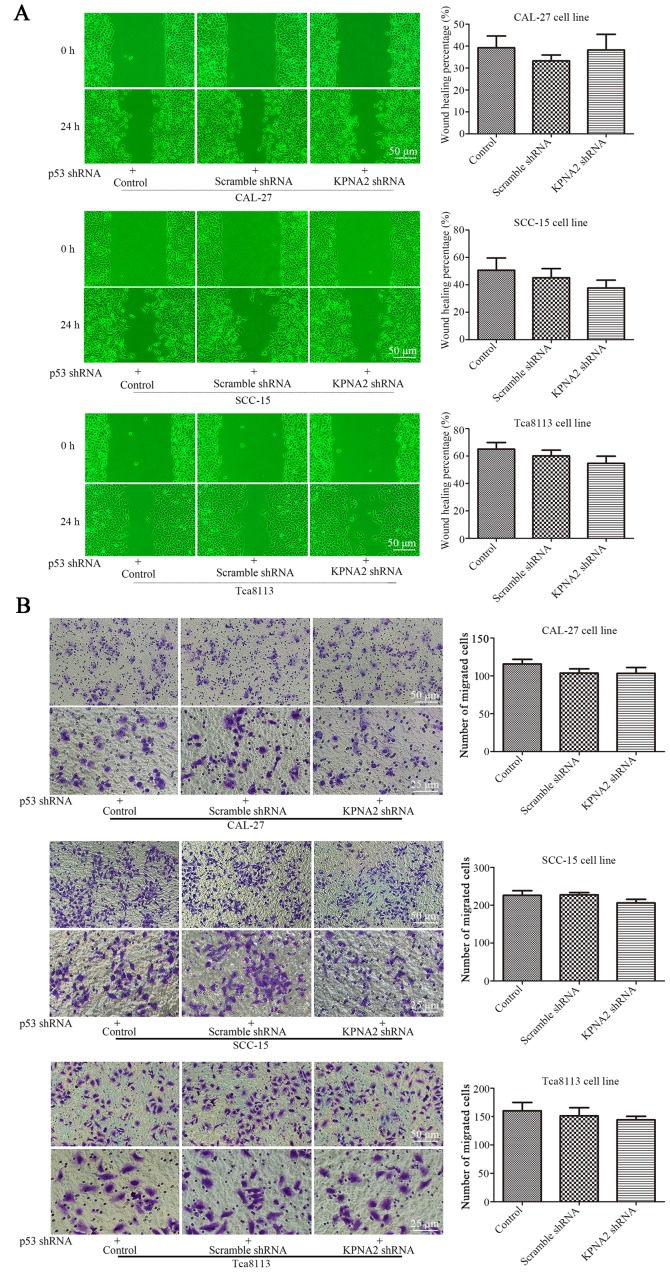
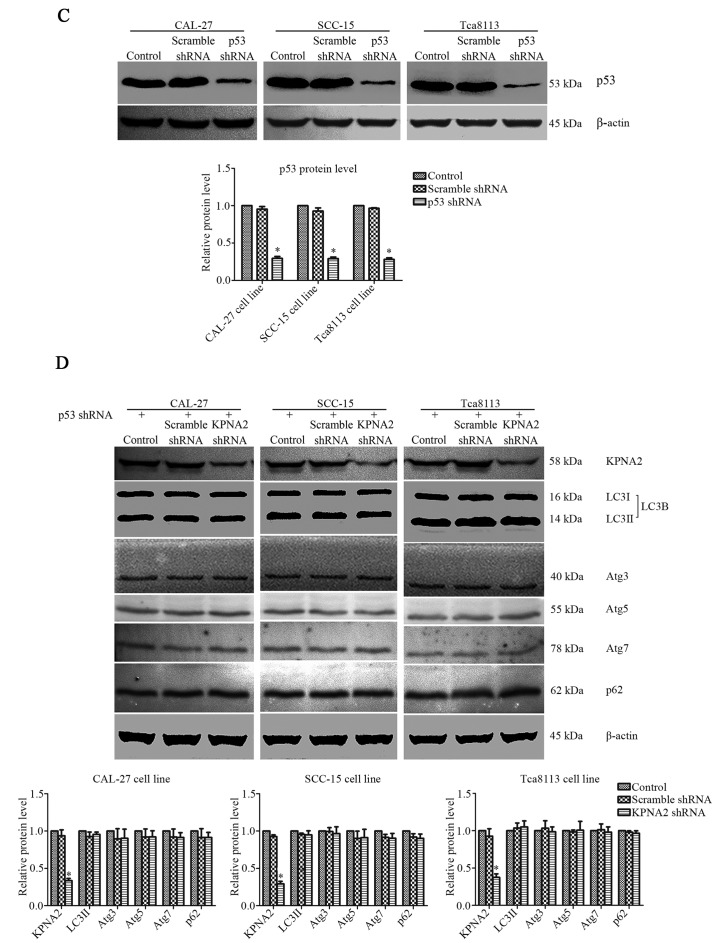
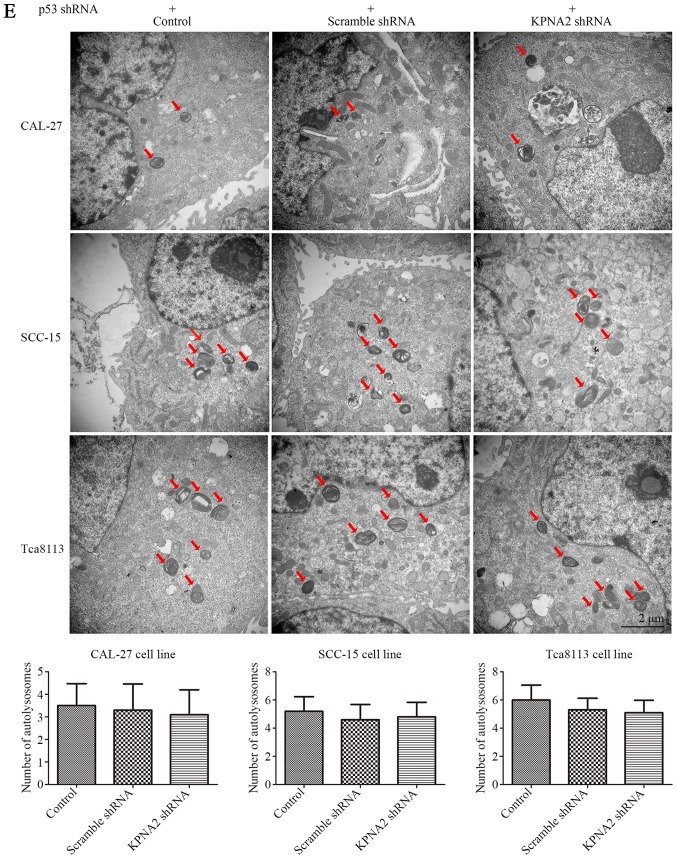
Oral squamous cell carcinoma (OSCC), one of the 10 most common types of neoplasms in the US, constitutes ~90% of all cases of oral malignancies. Chemoresistance and metastasis are difficult to avoid during the course of treatment, leading to a poor prognosis and a high mortality rate for patients with OSCC. Autophagy, a critical conserved cellular process, has been reported to be highly associated with the regulation of chemoresistance and metastasis of cancer cells. The present study investigated the role of karyopherin α2 (KPNA2), a member of the importin α family, which may serve an important role in p53 nucleocytoplasmic transport in the process of OSCC autophagy. In the CAL‑27, SCC‑15 and Tca8113 OSCC cell lines, we observed that the downregulation of KPNA2 suppressed cell migration and cisplatin resistance, using wound‑healing, Transwell and CCK‑8 assays. Additionally, the results of western blot analysis and transmission electron microscopy (TEM) analysis indicated that the knockdown of KPNA2 inhibited autophagy. We confirmed that the inhibition of autophagy with anti‑autophagy agents decreased the migration and cisplatin resistance of OSCC cells. We hypothesized that the suppression of cell migration and cisplatin resistance induced by KPNA2 knockdown may be associated with the inhibition of autophagy. To identify the underlying mechanism, further experiments determined that KPNA2 affects the level of autophagy via regulating the p53 nuclear import. Thus, the present study demonstrated that the function of KPNA2 in the process of autophagy may be p53‑dependent, and by regulating the translocation of p53, KPNA2 can support autophagy to promote the chemoresistance and metastasis of OSCC cells.


Figures

Figure 1.
Figure 1.
KPNA2 knockdown inhibits the migration of OSCC cells. CAL-27, SCC-15 and Tca8113 cells were transfected with KPNA2 shRNA. (A) Wound-healing assay of CAL-27, SCC-15 and Tca8113 cells, and quantification of the wound closure percentage. (B) The number of migrating cells in Transwell assays. *P<0.05 compared with the control group. Data are expressed as the mean ± standard deviation of three independent experiments for each group.
Figure 2.
Figure 2.
Knockdown of KPNA2 reduces the cisplatin resistance of OSCC cells. (A) Relative cell viability of each group as determined by a CCK-8 assay in a graded concentration of cisplatin. (B) IC50s for each group of cells. *P<0.05 vs. the control group. Data are expressed as the mean ± standard deviation of three independent experiments for each group.
Figure 3.
Figure 3.
Knockdown of KPNA2 inhibits the autophagy of OSCC cells. (A) Following the establishment of CAL-27, SCC-15 and Tca8113 cells exhibiting KPNA2 knockdown, autophagy-related protein expression levels of each group were assessed by western blotting. Densitometry analysis of the western blots is also shown. *P<0.05 compared with the control. Data are presented as the mean ± standard deviation (n=3). (B) TEM images of CAL-27, SCC-15 and Tca8113 cells following KPNA2 knockdown. Red arrows indicate formation of autolysosomes. The number of autolysosomes counted in each view are presented in histograms. *P<0.05 compared with the control group. Data are presented as the mean ± standard deviation (n=10 views of each group).
Figure 3.
Figure 3.
Knockdown of KPNA2 inhibits the autophagy of OSCC cells. (A) Following the establishment of CAL-27, SCC-15 and Tca8113 cells exhibiting KPNA2 knockdown, autophagy-related protein expression levels of each group were assessed by western blotting. Densitometry analysis of the western blots is also shown. *P<0.05 compared with the control. Data are presented as the mean ± standard deviation (n=3). (B) TEM images of CAL-27, SCC-15 and Tca8113 cells following KPNA2 knockdown. Red arrows indicate formation of autolysosomes. The number of autolysosomes counted in each view are presented in histograms. *P<0.05 compared with the control group. Data are presented as the mean ± standard deviation (n=10 views of each group).
Figure 4.
Figure 4.
Inhibition of autophagy decreases the migration and cisplatin resistance of OSCC cells. (A) Wound-healing assay of CAL-27, SCC-15 and Tca8113 cells in the presence or absence of autophagy inhibitors, and quantification of the wound closure percentage in each group of cells. (B) Transwell assays were conducted to evaluate the migration capacity in CAL-27, SCC-15 and Tca8113 cells treated with or without autophagy inhibitors. Histograms represent the number of migrating cells from 3 independent experiments. (C) Relative cell viability detected via a CCK-8 assay for cells treated with or without anti-autophagy agents in a graded concentration of cisplatin. (D) The IC50s of each group from (C) were calculated and are displayed in histograms. *P<0.05 compared with the control. Data are presented as the mean and error bars represent the standard deviation (n=3 for each experiment).
Figure 4.
Figure 4.
Inhibition of autophagy decreases the migration and cisplatin resistance of OSCC cells. (A) Wound-healing assay of CAL-27, SCC-15 and Tca8113 cells in the presence or absence of autophagy inhibitors, and quantification of the wound closure percentage in each group of cells. (B) Transwell assays were conducted to evaluate the migration capacity in CAL-27, SCC-15 and Tca8113 cells treated with or without autophagy inhibitors. Histograms represent the number of migrating cells from 3 independent experiments. (C) Relative cell viability detected via a CCK-8 assay for cells treated with or without anti-autophagy agents in a graded concentration of cisplatin. (D) The IC50s of each group from (C) were calculated and are displayed in histograms. *P<0.05 compared with the control. Data are presented as the mean and error bars represent the standard deviation (n=3 for each experiment).
Figure 5.
Figure 5.
Knockdown of KPNA2 inhibits p53 nuclear translocation. (A) Representative immunofluorescence images of p53 in CAL-27, SCC-15 and Tca8113 cells following the knockdown of KPNA2. Immunofluorescence analysis was conducted to determine the localization of p53. (B) The level of p53 protein in the nucleus and in total were analyzed by western blotting. *P<0.05 compared with the control, error bars represent the standard deviation (n=3).
Figure 6.
Figure 6.
KPNA2 knockdown does not inhibit autophagy in p53-knockdown cells. The expression of p53 in all groups of cells was downregulated by p53 shRNA. (A) Wound-healing assay of CAL-27, SCC-15 and Tca8113 cells in the presence or absence of KPNA2 shRNA, and quantification of the wound closure percentage for each group (n=3). (B) Confirmation of the migration ability of cells in each group via a Transwell assay; quantification of the assay is shown in histograms (n=3). (C) The level of p53 protein levels of each group were assessed by western blotting to confirm the effectiveness of the knockdown. (D) KPNA2 shRNA and scramble control shRNA were transfected into p53-knockdown CAL-27, SCC-15 and Tca8113 cells, and the levels of KPNA2 and autophagy-related protein expression were detected by western blot analysis. Densitometry analysis of the western blots was displayed in histograms (n=3). (E) TEM images of p53-knockdown CAL-27, SCC-15 and Tca8113 cells treated with or without KPNA2 shRNA, and the formation of autolysosomes indicated by red arrows. The histogram represents the number of autolysosomes counted in 10 views of each group. *P<0.05 compared with the control, and error bars represent the standard deviation.
Figure 6.
Figure 6.
KPNA2 knockdown does not inhibit autophagy in p53-knockdown cells. The expression of p53 in all groups of cells was downregulated by p53 shRNA. (A) Wound-healing assay of CAL-27, SCC-15 and Tca8113 cells in the presence or absence of KPNA2 shRNA, and quantification of the wound closure percentage for each group (n=3). (B) Confirmation of the migration ability of cells in each group via a Transwell assay; quantification of the assay is shown in histograms (n=3). (C) The level of p53 protein levels of each group were assessed by western blotting to confirm the effectiveness of the knockdown. (D) KPNA2 shRNA and scramble control shRNA were transfected into p53-knockdown CAL-27, SCC-15 and Tca8113 cells, and the levels of KPNA2 and autophagy-related protein expression were detected by western blot analysis. Densitometry analysis of the western blots was displayed in histograms (n=3). (E) TEM images of p53-knockdown CAL-27, SCC-15 and Tca8113 cells treated with or without KPNA2 shRNA, and the formation of autolysosomes indicated by red arrows. The histogram represents the number of autolysosomes counted in 10 views of each group. *P<0.05 compared with the control, and error bars represent the standard deviation.

Similar articles

Cited by

References

    1. Siegel RL, Miller KD, Jemal A. Cancer statistics, 2017. CA Cancer J Clin. 2017;67:7–30. doi: 10.3322/caac.21387. - DOI - PubMed
    1. Sarode GS, Sarode SC, Maniyar N, Anand R, Patil S. Oral cancer databases: A comprehensive review. J Oral Pathol Med. 2017 doi: 10.1111/jop.12667. - DOI - PubMed
    1. Gharat SA, Momin M, Bhavsar C. Oral squamous cell carcinoma: Current treatment strategies and nanotechnology-based approaches for prevention and therapy. Crit Rev Ther Drug Carrier Syst. 2016;33:363–400. doi: 10.1615/CritRevTherDrugCarrierSyst.2016016272. - DOI - PubMed
    1. Mizushima N, Yoshimori T, Ohsumi Y. The role of Atg proteins in autophagosome formation. Annu Rev Cell Dev Biol. 2011;27:107–132. doi: 10.1146/annurev-cellbio-092910-154005. - DOI - PubMed
    1. White E, Mehnert JM, Chan CS. Autophagy, metabolism, and cancer. Clin Cancer Res. 2015;21:5037–5046. doi: 10.1158/1078-0432.CCR-15-0490. - DOI - PMC - PubMed

MeSH terms