

Src Kinase Dependent Rapid Non-genomic Modulation of Hippocampal Spinogenesis Induced by Androgen and Estrogen
- PMID: 29765299
- PMCID: PMC5938344
- DOI: 10.3389/fnins.2018.00282
Src Kinase Dependent Rapid Non-genomic Modulation of Hippocampal Spinogenesis Induced by Androgen and Estrogen
Abstract
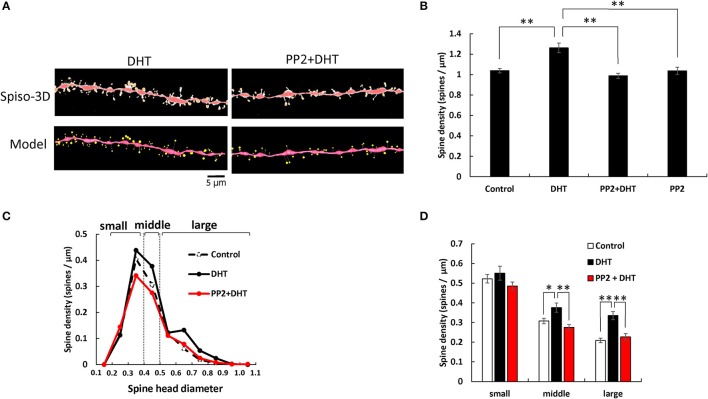
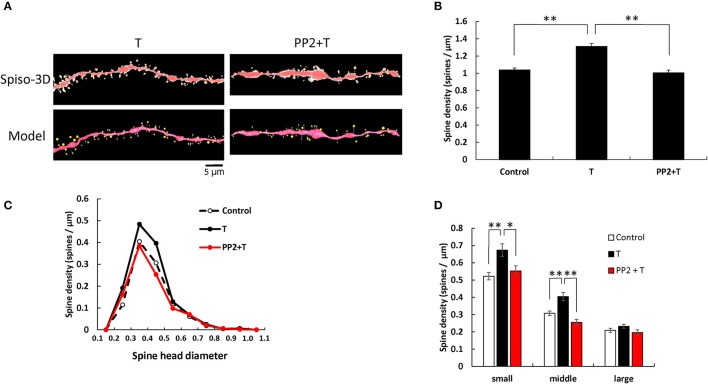
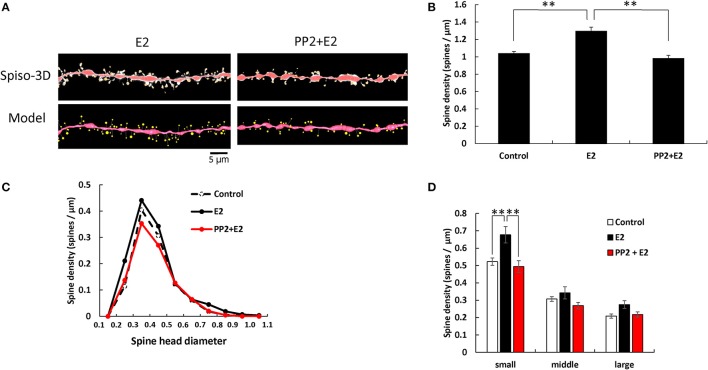
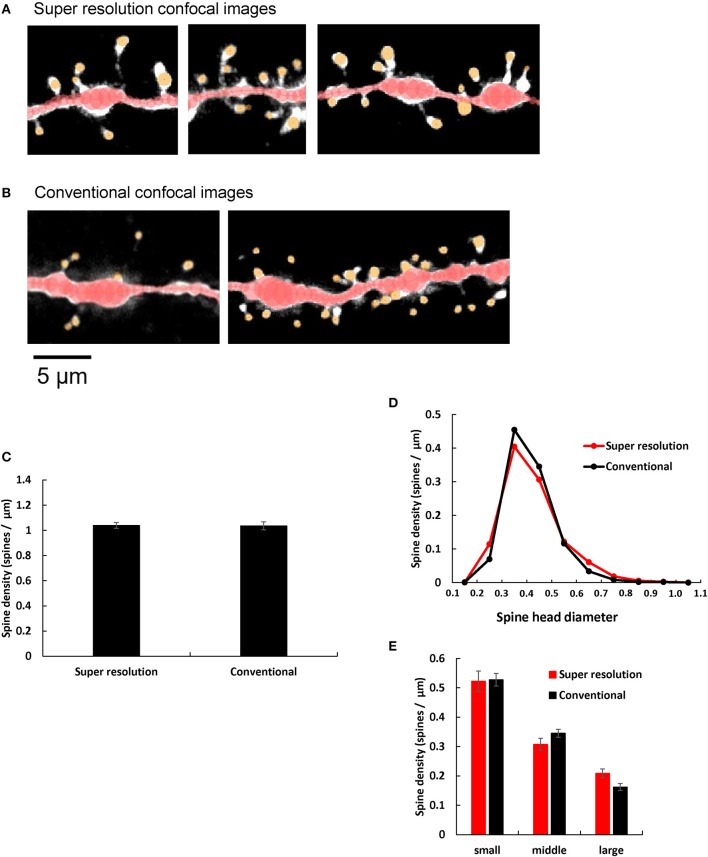
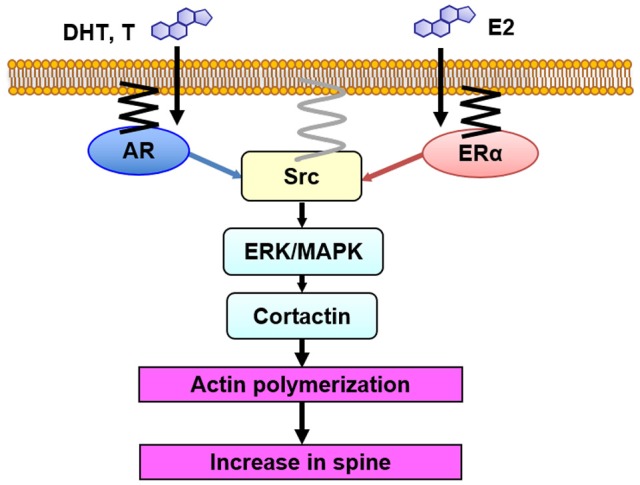
Dendritic spine is a small membranous protrusion from a neuron's dendrite that typically receives input from an axon terminal at the synapse. Memories are stored in synapses which consist of spines and presynapses. Rapid modulations of dendritic spines induced by hippocampal sex steroids, including dihydrotestosterone (DHT), testosterone (T), and estradiol (E2), are essential for synaptic plasticity. Molecular mechanisms underlying the rapid non-genomic modulation through synaptic receptors of androgen (AR) and estrogen (ER) as well as its downstream kinase signaling, however, have not been well understood. We investigated the possible involvement of Src tyrosine kinase in rapid changes of dendritic spines in response to androgen and estrogen, including DHT, T, and E2, using hippocampal slices from adult male rats. We found that the treatments with DHT (10 nM), T (10 nM), and E2 (1 nM) increased the total density of spines by ~1.22 to 1.26-fold within 2 h using super resolution confocal imaging of Lucifer Yellow-injected CA1 pyramidal neurons. We examined also morphological changes of spines in order to clarify differences between three sex steroids. From spine head diameter analysis, DHT increased middle- and large-head spines, whereas T increased small- and middle-head spines, and E2 increased small-head spines. Upon application of Src tyrosine kinase inhibitor, the spine increases induced through DHT, T, and E2 treatments were completely blocked. These results imply that Src kinase is essentially involved in sex steroid-induced non-genomic modulation of the spine density and morphology. These results also suggest that rapid effects of exogenously applied androgen and estrogen can occur in steroid-depleted conditions, including "acute" hippocampal slices and the hippocampus of gonadectomized animals.
Keywords: Src kinase; androgen; estrogen; hippocampus; non-genomic; spine; synapse.
Figures
Similar articles
-
Rapid increase of spines by dihydrotestosterone and testosterone in hippocampal neurons: Dependence on synaptic androgen receptor and kinase networks.Brain Res. 2015 Sep 24;1621:121-32. doi: 10.1016/j.brainres.2014.12.011. Epub 2014 Dec 13. Brain Res. 2015. PMID: 25511993
-
Rapid nongenomic modulation by neurosteroids of dendritic spines in the hippocampus: Androgen, oestrogen and corticosteroid.J Neuroendocrinol. 2018 Feb;30(2). doi: 10.1111/jne.12561. J Neuroendocrinol. 2018. PMID: 29194818 Review.
-
Modulation of synaptic plasticity in the hippocampus by hippocampus-derived estrogen and androgen.J Steroid Biochem Mol Biol. 2012 Aug;131(1-2):37-51. doi: 10.1016/j.jsbmb.2011.10.004. Epub 2011 Oct 31. J Steroid Biochem Mol Biol. 2012. PMID: 22075082 Review.
-
Estradiol rapidly modulates spinogenesis in hippocampal dentate gyrus: Involvement of kinase networks.Horm Behav. 2015 Aug;74:149-56. doi: 10.1016/j.yhbeh.2015.06.008. Epub 2015 Jun 27. Horm Behav. 2015. PMID: 26122288
-
Estradiol rapidly modulates synaptic plasticity of hippocampal neurons: Involvement of kinase networks.Brain Res. 2015 Sep 24;1621:147-61. doi: 10.1016/j.brainres.2014.12.056. Epub 2015 Jan 13. Brain Res. 2015. PMID: 25595055
Cited by
-
The Divergent Function of Androgen Receptor in Breast Cancer; Analysis of Steroid Mediators and Tumor Intracrinology.Front Endocrinol (Lausanne). 2018 Oct 26;9:594. doi: 10.3389/fendo.2018.00594. eCollection 2018. Front Endocrinol (Lausanne). 2018. PMID: 30416486 Free PMC article. Review.
-
Rapid Estrogenic and Androgenic Neurosteroids Effects in the Induction of Long-Term Synaptic Changes: Implication for Early Memory Formation.Front Neurosci. 2020 Oct 27;14:572511. doi: 10.3389/fnins.2020.572511. eCollection 2020. Front Neurosci. 2020. PMID: 33192257 Free PMC article. Review.
-
Testosterone Promotes Glioblastoma Cell Proliferation, Migration, and Invasion Through Androgen Receptor Activation.Front Endocrinol (Lausanne). 2019 Feb 4;10:16. doi: 10.3389/fendo.2019.00016. eCollection 2019. Front Endocrinol (Lausanne). 2019. PMID: 30778332 Free PMC article.
-
Polygenic risk for circulating reproductive hormone levels and their influence on hippocampal volume and depression susceptibility.Psychoneuroendocrinology. 2019 Aug;106:284-292. doi: 10.1016/j.psyneuen.2019.04.011. Epub 2019 Apr 20. Psychoneuroendocrinology. 2019. PMID: 31039525 Free PMC article.
-
Osteopontin and Integrin Mediated Modulation of Post-Synapses in HIV Envelope Glycoprotein Exposed Hippocampal Neurons.Brain Sci. 2020 Jun 4;10(6):346. doi: 10.3390/brainsci10060346. Brain Sci. 2020. PMID: 32512754 Free PMC article.
References
-
- Anahara R., Toyama Y., Maekawa M., Yoshida M., Kai M., et al. . (2006). Anti-estrogen ICI 182.780 and anti-androgen flutamide induce tyrosine phosphorylation of cortactin in the ectoplasmic specialization between the Sertoli cell and spermatids in the mouse testis. Biochem. Biophys. Res. Commun. 346, 276–280. 10.1016/j.bbrc.2006.05.125 - DOI - PubMed
-
- Campbell D. H., Sutherland R. L., Daly R. J. (1999). Signaling pathways and structural domains required for phosphorylation of EMS1/cortactin. Cancer Res. 59, 5376–5385. - PubMed
LinkOut - more resources
Full Text Sources
Other Literature Sources
Research Materials
Miscellaneous