. 2018:1757:251-305.
doi: 10.1007/978-1-4939-7737-6_10.

Navigating Xenbase: An Integrated Xenopus Genomics and Gene Expression Database

Affiliations

Navigating Xenbase: An Integrated Xenopus Genomics and Gene Expression Database

Christina James-Zorn et al. Methods Mol Biol. 2018.

Abstract

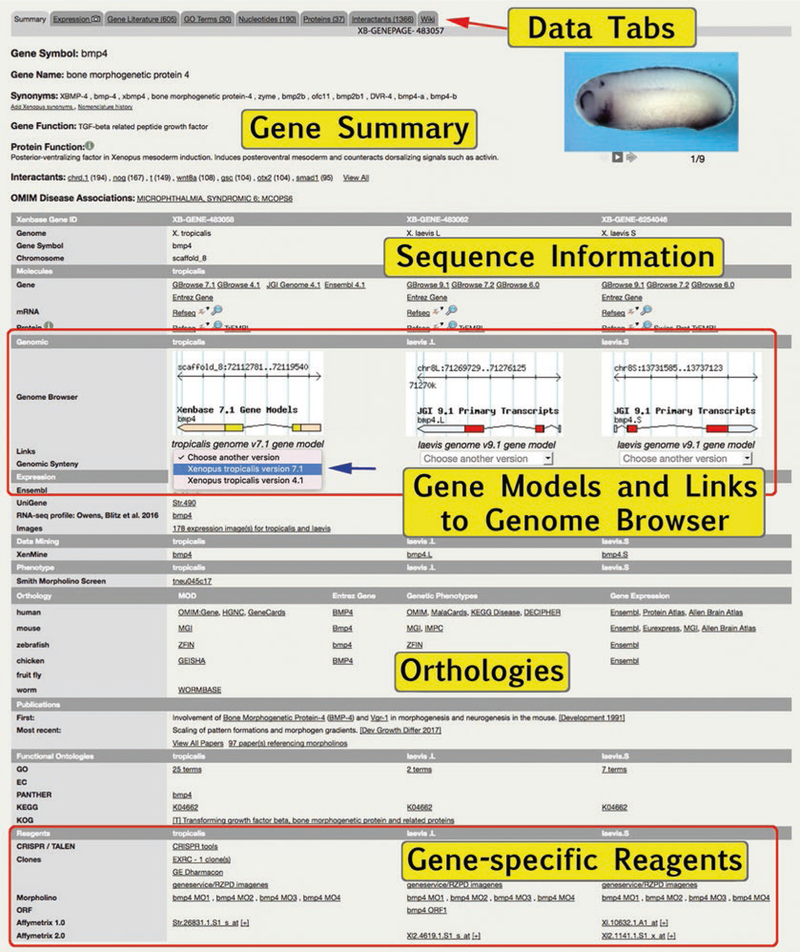
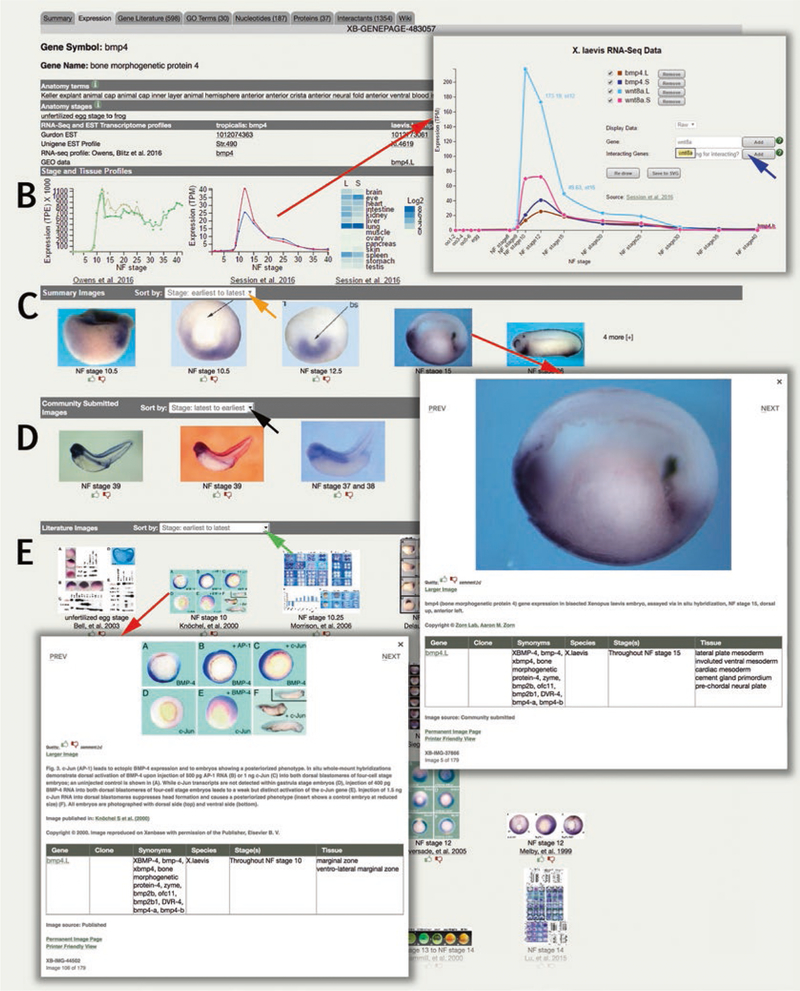
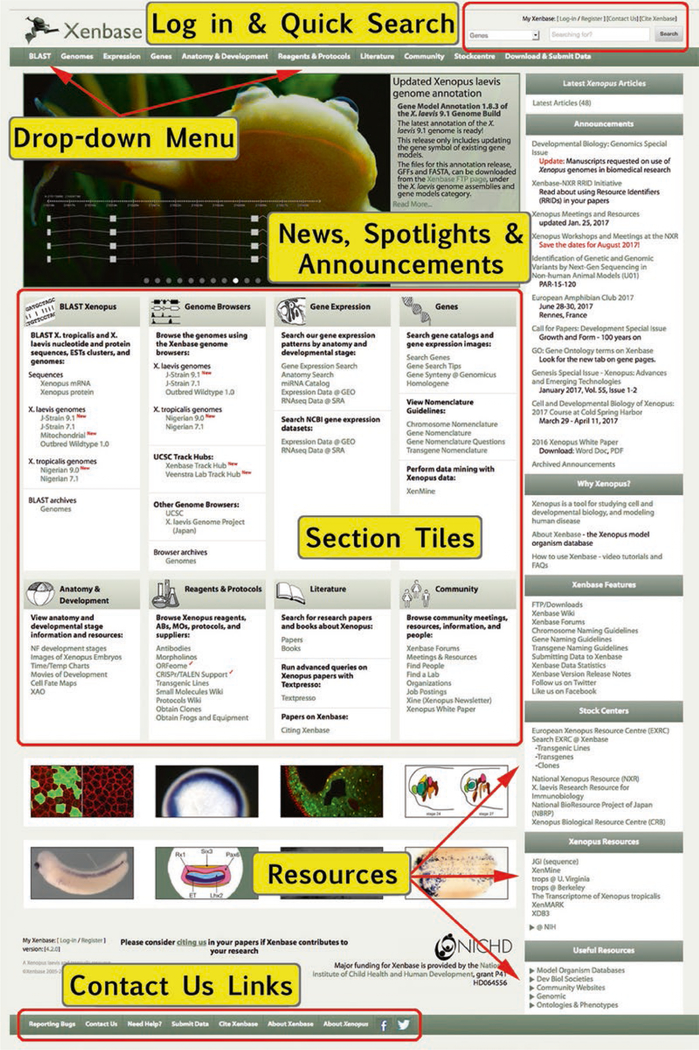
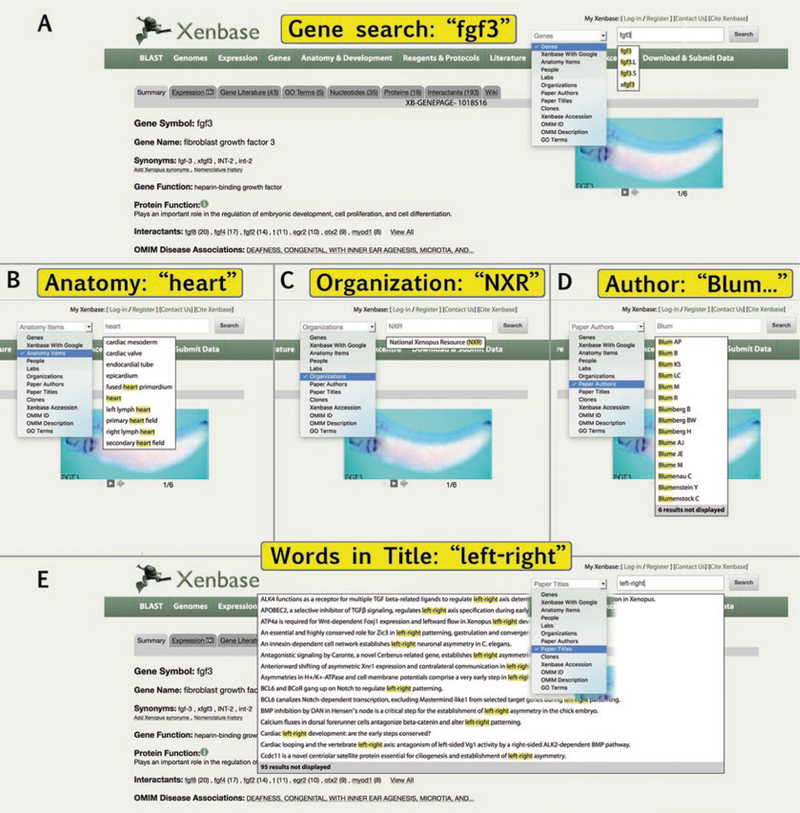
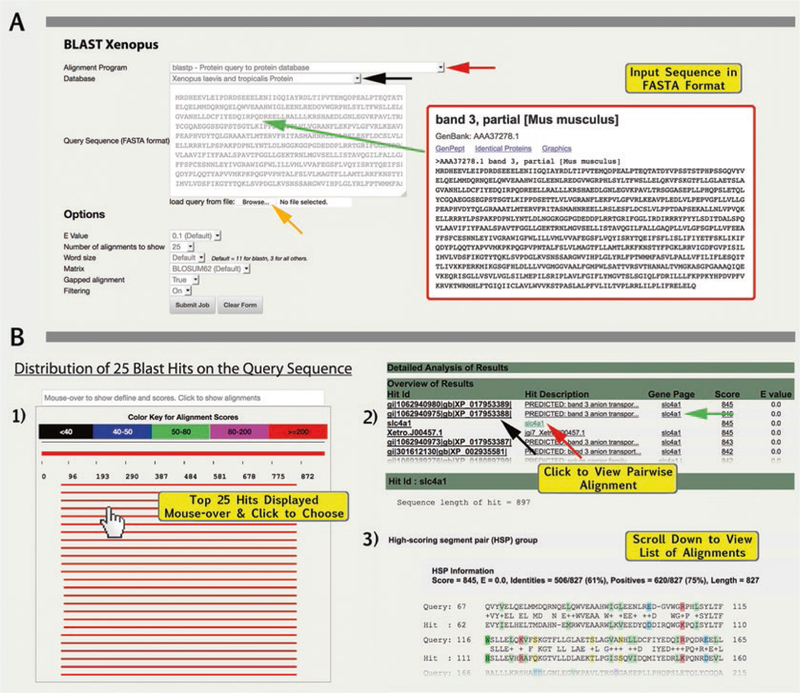
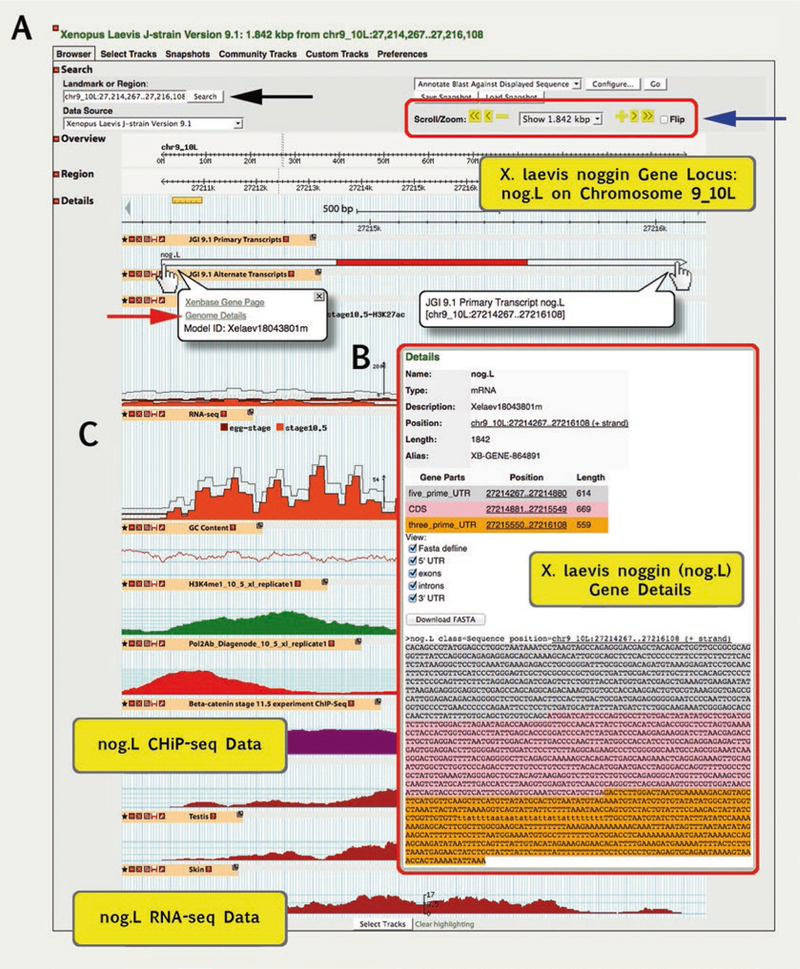
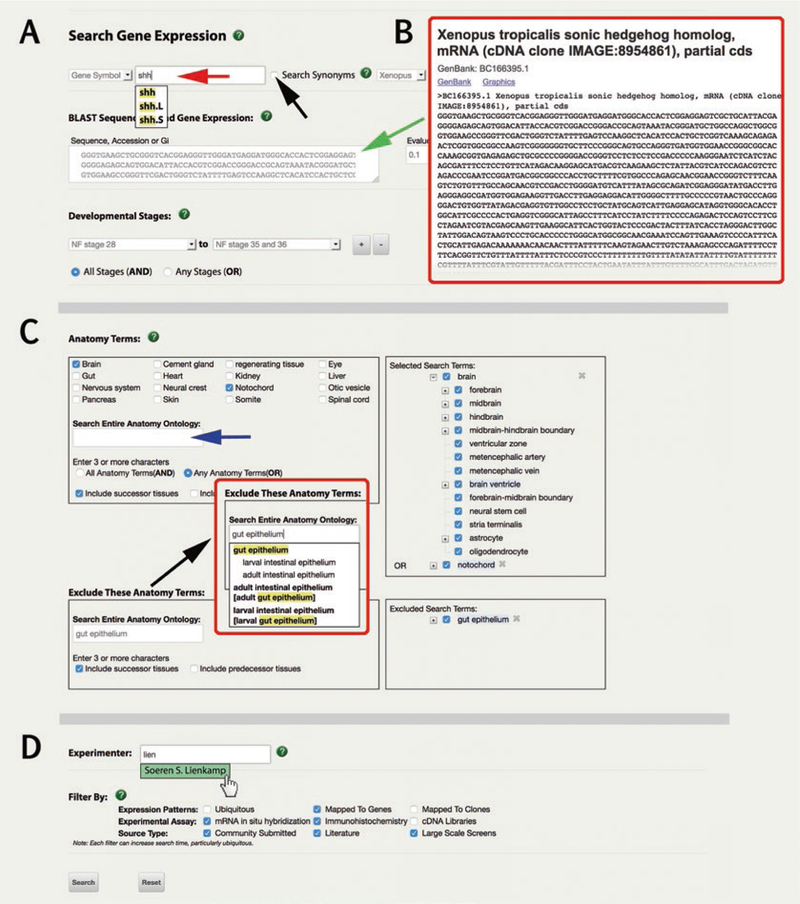
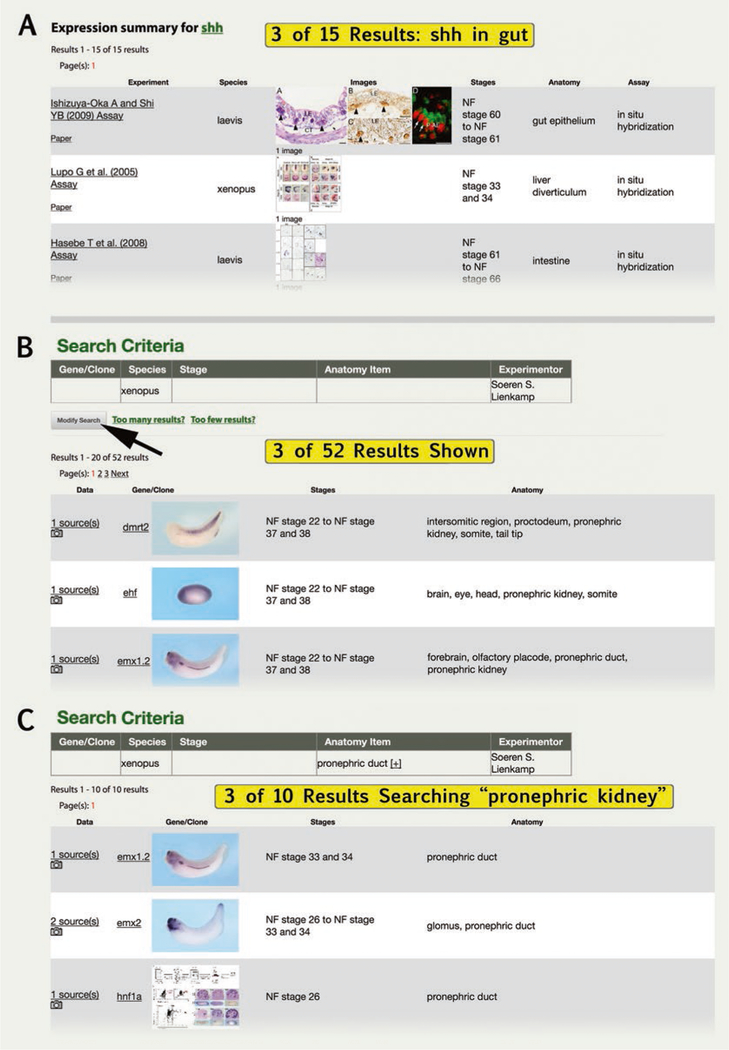
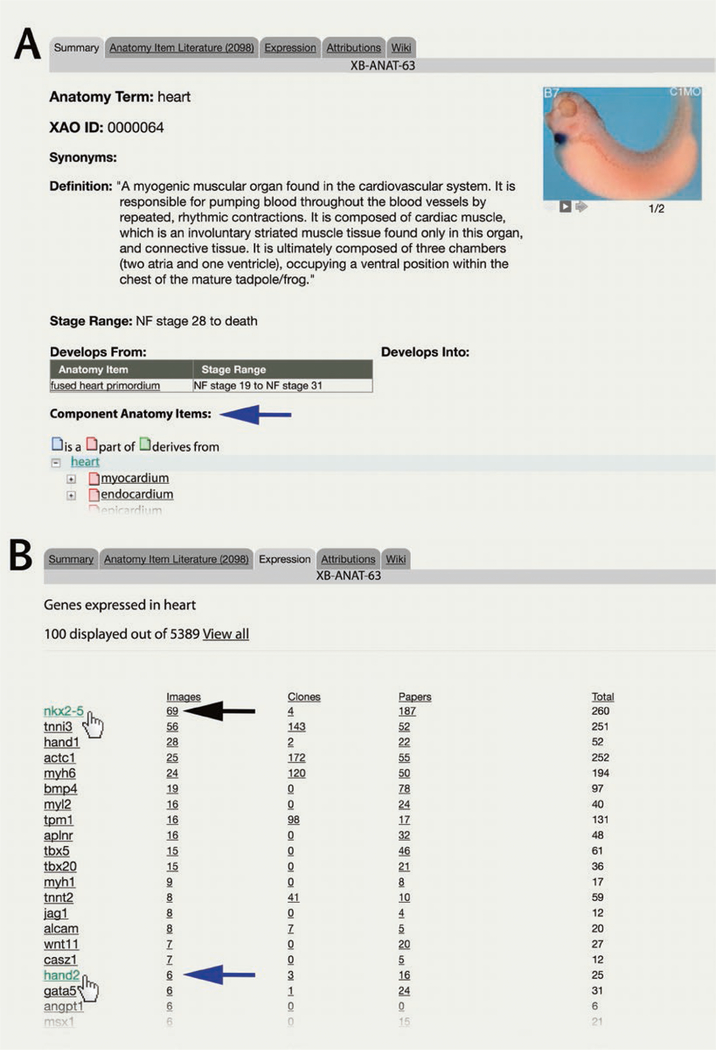
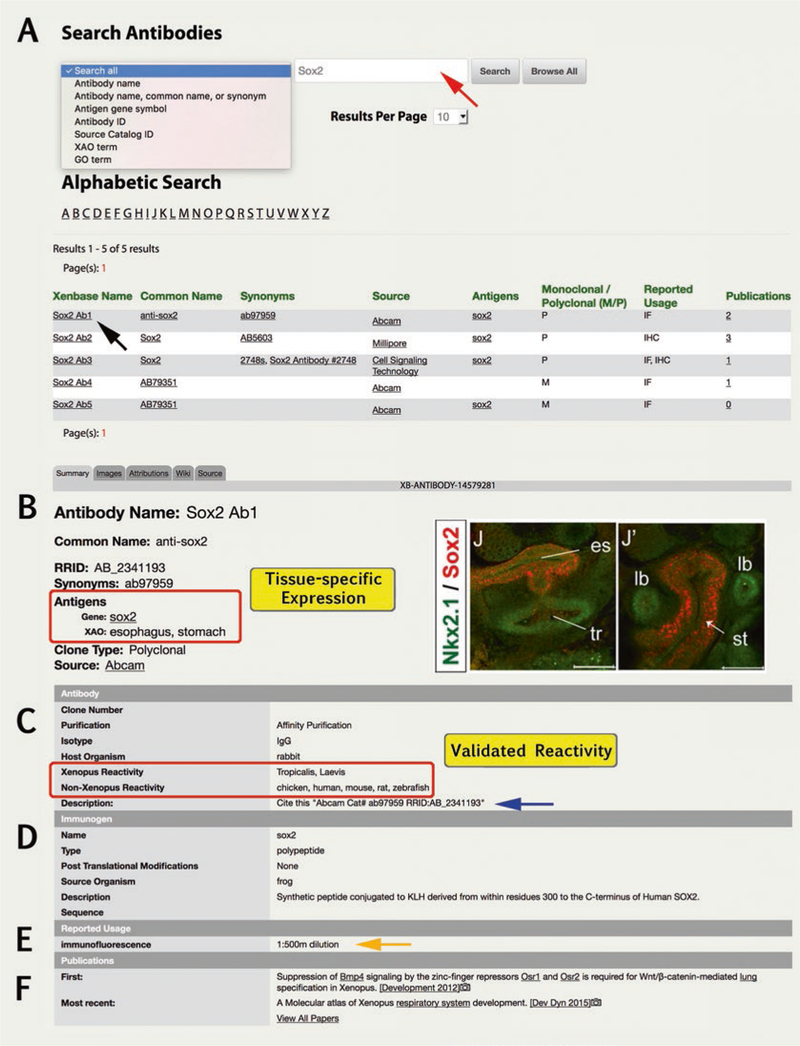
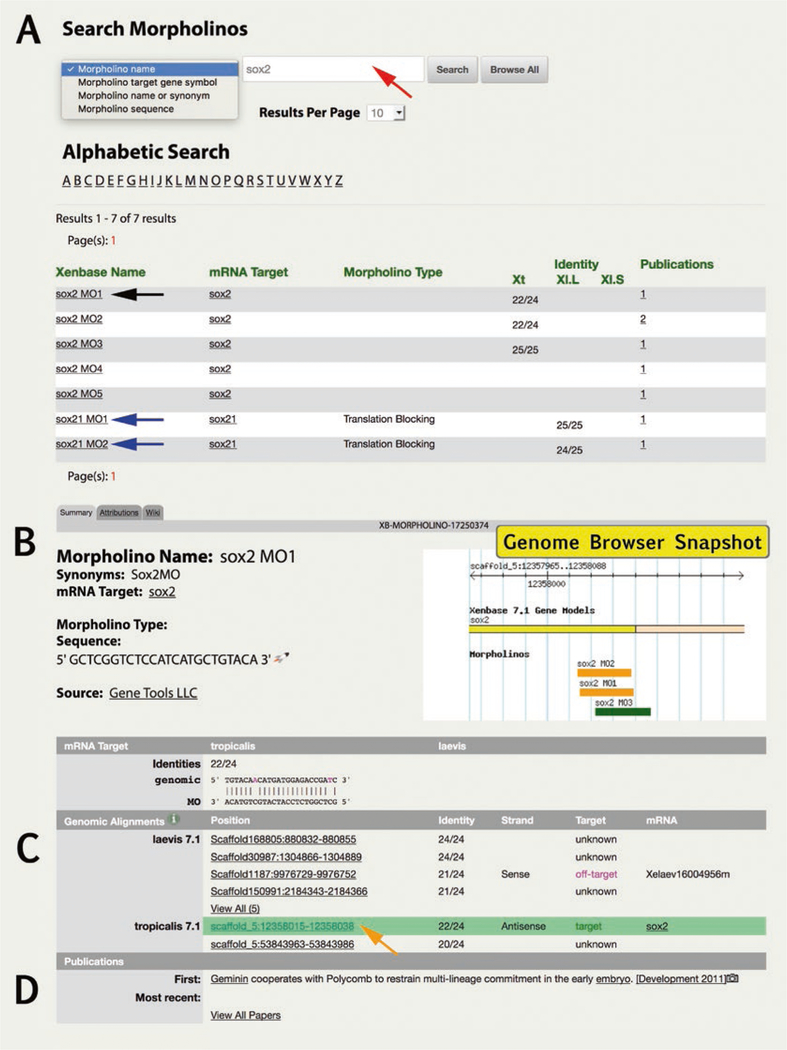
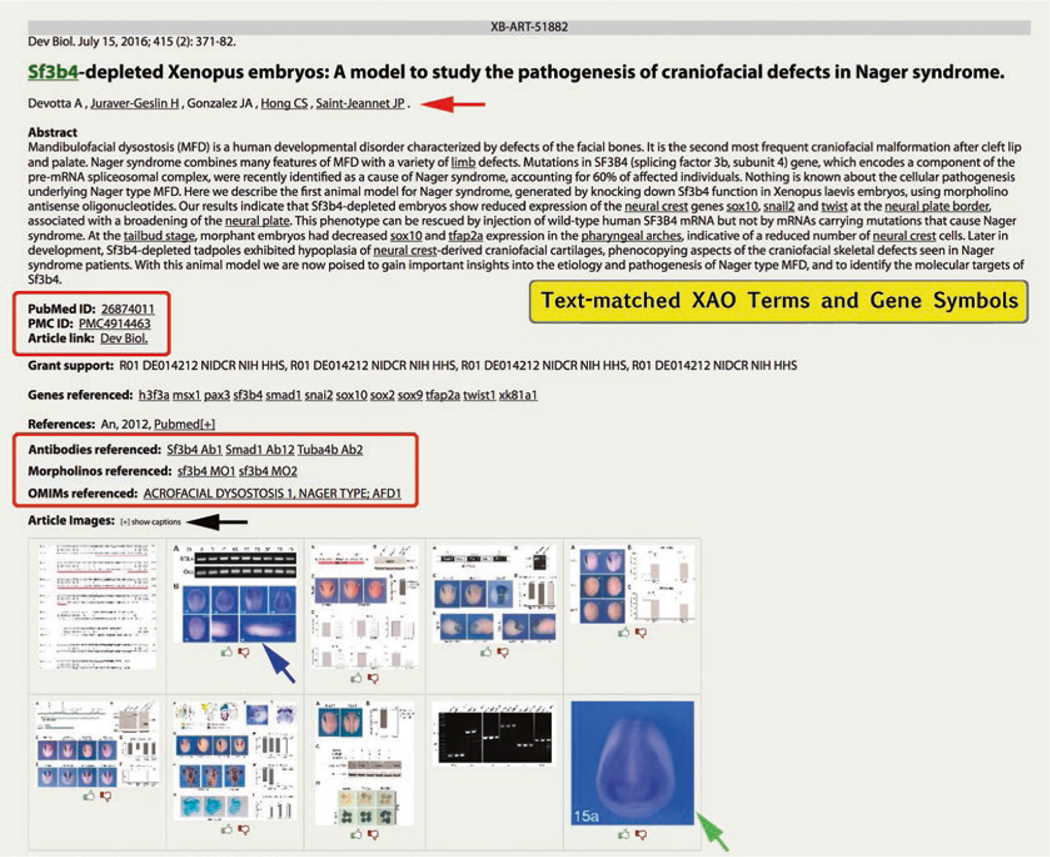
Xenbase is the Xenopus model organism database ( www.xenbase.org ), a web-accessible resource that integrates the diverse genomic and biological data for Xenopus research. It hosts a variety of content including current and archived genomes for both X. laevis and X. tropicalis, bioinformatic tools for comparative genetic analyses including BLAST and GBrowse, annotated Xenopus literature, and catalogs of reagents including antibodies, ORFeome clones, morpholinos, and transgenic lines. Xenbase compiles gene-specific pages which include manually curated gene expression images, functional information including gene ontology (GO), disease associations, and links to other major data sources such as NCBI:Entrez, UniProtKB, and Ensembl. We also maintain the Xenopus Anatomy Ontology (XAO) which describes anatomy throughout embryonic development. This chapter provides a full description of the many features of Xenbase, and offers a guide on how to use various tools to perform a variety of common tasks such as identifying nucleic acid or protein sequences, finding gene expression patterns for specific genes, stages or tissues, identifying literature on a specific gene or tissue, locating useful reagents and downloading our extensive content, including Xenopus gene-Human gene disease mapping files.

Keywords: Anatomy ontology; BLAST; GBrowse; Gene expression analysis; Genome database; Polyploid genome; Textpresso; Xenopus.


Figures

Fig. 1
Fig. 1
Xenbase is built around the “Gene Page,” where a file-like tab system provides comprehensive coverage of data about each gene. This example is the “Summary” tab for ‘bone morphogenetic protein 4’ (bmp4) with the Xenbase gene page ID ‘XB-GENEPAGE-483057’. The salient features of gene (official name, synonyms, gene and protein function, cocited interactants, and human disease associations) are all shown in the upper summary panel, along with a developmental expression series (where available). Sequence information and JBrowse snapshots of the gene models are shown for X. tropicalis and X. laevis L and X. laevis S homeologs (upper red box). To view a different gene model, select from “choose another version” (blue arrow). The rest of the Gene Page provides links to more data covering orthology, first and most recent publications, and functional ontology, with curated gene-specific reagents (e.g., MOs, primary antibodies, and ORFeome clones) in the lower panels (lower red box). Frequently accessed tabs include the “Expression” tab (details in B–D below with a camera icon that indicates presence of images, “Gene Literature,” and “GO terms” from UniProtKB, where number in parenthesis indicates number of citations or terms respectively. (B) The Expression tab of a Gene Page displays gene expression data in several useful formats. Interactive graphs plot X. laevis L and S homeolog expression from RNA-Seq data [7] with ability to add more genes (blue arrow) to the graph via dialog boxes (red arrow, click to pop-up). Heat-maps from adult tissues compare X. laevis L and S homeologs, data from [7]. (C) Summary images are selected to represent gene expression over a range of embryonic stages and can be sorted by stage (orange arrow). (D) Community submitted images from large scale screens, which generally use ISH and IHC, can also be sorted by stage (black arrow). (E) Literature images from published articles can be sorted by stage or publication date (green arrow), and include link to the Xenbase Article Page. Click on the image to pop up a larger image (red arrow), along with caption and annotation table
Fig. 1
Fig. 1
Xenbase is built around the “Gene Page,” where a file-like tab system provides comprehensive coverage of data about each gene. This example is the “Summary” tab for ‘bone morphogenetic protein 4’ (bmp4) with the Xenbase gene page ID ‘XB-GENEPAGE-483057’. The salient features of gene (official name, synonyms, gene and protein function, cocited interactants, and human disease associations) are all shown in the upper summary panel, along with a developmental expression series (where available). Sequence information and JBrowse snapshots of the gene models are shown for X. tropicalis and X. laevis L and X. laevis S homeologs (upper red box). To view a different gene model, select from “choose another version” (blue arrow). The rest of the Gene Page provides links to more data covering orthology, first and most recent publications, and functional ontology, with curated gene-specific reagents (e.g., MOs, primary antibodies, and ORFeome clones) in the lower panels (lower red box). Frequently accessed tabs include the “Expression” tab (details in B–D below with a camera icon that indicates presence of images, “Gene Literature,” and “GO terms” from UniProtKB, where number in parenthesis indicates number of citations or terms respectively. (B) The Expression tab of a Gene Page displays gene expression data in several useful formats. Interactive graphs plot X. laevis L and S homeolog expression from RNA-Seq data [7] with ability to add more genes (blue arrow) to the graph via dialog boxes (red arrow, click to pop-up). Heat-maps from adult tissues compare X. laevis L and S homeologs, data from [7]. (C) Summary images are selected to represent gene expression over a range of embryonic stages and can be sorted by stage (orange arrow). (D) Community submitted images from large scale screens, which generally use ISH and IHC, can also be sorted by stage (black arrow). (E) Literature images from published articles can be sorted by stage or publication date (green arrow), and include link to the Xenbase Article Page. Click on the image to pop up a larger image (red arrow), along with caption and annotation table
Fig. 2
Fig. 2
The Xenbase home page (http://www.xenbase.org) features a rotating image carousel to spotlight new articles and announce relevant news to the Xenopus community. Log-in and the Quick Search minibar are in the upper right corner. The drop-down menu bar spans the top of the web page, and reiterates the links in the subject tiles below. Additional links to Xenopus resources are in the side column, and social media and contact Xenbase links are in the footer. This layout visually describes the database architecture and is designed to accommodate different workflows and preferences
Fig. 3
Fig. 3
Quick Search Menu is located at the upper right corner on every Xenbase page. Options available from drop downs include: (A) Select “Genes” to search for partial of full gene name or symbol (e.g., “fgf”); (B) “Anatomy Items” link an XAO term page search (e.g., “heart”); (C) “Organization” quickly finds contact details for stock centers of suppliers (e.g., NXR); (D) “Paper Authors” will text-match partial and full names to Xenopus literature (e.g., “Blum”); (E) “Paper Titles” searches full or partial article titles, and effectively searches for keywords
Fig. 4
Fig. 4
Using BLAST on Xenbase. (1) Access BLAST from drop-down menu or tile; (2) Choose Alignment program and (3) the database to which your search will be aligned; (4). Paste the query sequence into the box, in FASTA format; (5) Set and adjust options and (6) click “Submit Job” button. (A) In this example to assess evolutionary conservation of the protein Slc4a1 between mouse and frog, we used “blastp” (protein query-toprotein database) and entered the amino acid sequence for mouse Slc4a1 (Gene ID: 20533; protein_id=AAA37278.1) in FASTA format. We selected “X. laevis and X. tropicalis proteins” from database options. (B) Results of BLAST for mouse Slc4a1 vs. Xenopus are displayed sequentially in three formats: (1) Distribution of the top 25 hits on the query sequence with red indicating alignment scores >200; (2) Table with “Overview of Results” showing high scoring segment pair alignments (with alignment score). (3) Click hit ID or scroll down page to view pairwise alignments and identity calculated as a percentage
Fig. 5
Fig. 5
Using GBrowse, in conjunction with BLAST, to visualize alignments against gene models and Next-Gen sequence data. (A) In this example, we BLAST X. tropicalis nog mRNA against X. laevis 9.1 genome. GBrowse gene model details are shown for X. laevis nog.L. Moving the cursor over the gene model (hand cursor) generates a pop-up with links to “Xenbase Gene Page” and “Genome Details.” Click on Genome Details (red arrow) to access metadata (pop up in B) about the given gene model, including the specific Xenopus gene (L or S) to which the model is associated. (B) The Gene Details provides a quick overview of the structure of the model, and size of exons, introns, and 5′ and 3′ UTRs. The interactive sequence section allows the UTRs and introns to be toggled on and off for easy copying and can be edited to include/exclude exons. (C) Next-Gen RNA-Seq and ChIP-Seq datasets are shown below the gene models
Fig. 6
Fig. 6
Search Gene Expression via “Expression” menu. (A) Gene expression can be searched by entering a gene symbol (red arrow), or by entering a sequence in FASTA format into the dialog box (green arrow, see (B). Additional filters can include search synonyms (checkbox, black arrow) and choosing which species (X. laevis or X. tropicalis, the default is for both). (C) Anatomical terms (organs, tissues, or cell types) can be included (top box) and/or excluded (black arrow). Select XAO terms either by marking check boxes, or manually entering terms. Selected anatomy terms move right to the “Selected Search Terms” box. Toggle between child terms using + and − buttons, mark or unmark checkboxes to select/deselect terms (selected terms have tick in a small blue box). Choose “All Anatomy terms” (AND) or “Any Anatomy terms” (OR) functionality via radio buttons. Choose to “Include predecessor tissues” and/or “Include successor tissues” via checkboxes as needed. (D) The bottom fields include additional filter options including “Experimenter,” which autosuggests (highlighted in green) from the list of paper authors and Xenopus community members
Fig. 7
Fig. 7
Gene expression search results. (A) Gene expression query output for the gene “sonic hedgehog” (shh) and the XAO term “alimentary system.” A subset of the returns, with the experimental source (e.g., citations from literature or community submitted data) to left, then species, a thumbnail of the data image, NF stages and the XAO terms annotated (and thus matched) to that image to the right. Click on the image to enlarge it and view annotation table. Click on the source to open the Article or Lab page. (B) Gene expression query output for XAO term “pronephric kidney” plus the Experimenter “Lienkamp,” returns all annotated images from a screen for pronephric markers, plus any images from publications with this author (not shown). Images can be filtered for more specific terms using the “Modify Search” button (black arrow). (C) Adding the anatomy term “pronephric duct” filters the results (shown in B) to a smaller, annotated set of images from the “Lienkamp” laboratory
Fig. 8
Fig. 8
Using the Anatomy Search to explore gene expression, and the XAO. Here we use the XAO module to ask “Which genes are expressed in the heart?” (A) Each XAO term page gives the term definition, NF stage restrictions for its use and relationships to other terms (see “Component Anatomy Items,” blue arrow). (B) From the XAO term page for heart click the “Expression” tab. The first few results (of top 100) are shown, resorted by clicking “images” to be ranked in descending order by number of images (e.g., nkx2–5 69 images, tnni3, 56 images, and hand1, 28 images etc.) with data from clones, papers and total columns on the left. Lower down the column lesser known genes with heart expression are shown (e.g., hand2, 6 images). Mouse over (hand cursor) to select
Fig. 9
Fig. 9
New developmental series illustrations: Zahn series. The newly published, open access, Zahn drawings will be posted on Xenbase under the Anatomy and Development menu. This developmental stage series for Xenopus, based on multiple individuals, includes views that have not been previously published (e.g., dorsal and anterior as show here) as well as ventral views (not shown). The drawings call attention to morphological changes during critical stages of organogenesis, with a focus on changes in the shape and size of the head as seen in the images here demonstrating changes through NF stages 33 and 34, NF stage 40 and NF stage 45. The image series also includes bright field photographs (left) to compare with drawings (right). Images reproduced here are open access, and appear in Zahn, Levin and Spencer Adams, (2017) Development.
Fig. 10
Fig. 10
Dynamic cell fate maps by Xenbase, based on classic studies by Moody [28, 29] and Bauer et al. [30]. (A) Cell fate in a forward direction, from blastomere to tissue. To use these animations, move the cursor over a blastomere, and the cells in later developmental stages are highlighted for NF stage 5 (16-cell) in orange, and NF stage 6 (32-cell) embryos in blue. Click on any blastomere to see its derivatives. (B) Cell fate in the reverse direction (i.e., tissue from blastomere). To use this tool, mouse over an anatomy term (e.g., “cement gland”), from a primary germ layer category (e.g., ectoderm, neurectoderm, mesoderm, or endoderm) to highlight the blastomeres that contribute to these tissues. Color coding indicates the degree of contribution from the NF stage 6 (32-cell) embryo: major (red), minor (green), or rarely incorporates cells (orange)
Fig. 11
Fig. 11
Xenbase Antibody catalog is accessed under the Reagents & Protocols menu/tile. (A) To find antibody entries, use the “Search All” (default) by entering antigen gene symbol, catalog number, or common name (red arrow). Select an antibody from the results table (e.g., Sox2 Ab1, black arrow) to open the antibody entry. (B) Each Antibody page includes Xenbase name, common name, source and catalog number, an image illustrating reactivity plus details such as tissue-specific expression (XAO terms). (C) Properties including validated activity and citation (including RRID numbers) are recorded when available (blue arrow). (D) Immunogen details and, (E) “Reported Usage” (e.g., western blot, immunofluorescence; orange arrow) are recorded. (F) Publications using the antibody are listed as “First” and “Most recent,” with a “View All Papers” option, which is reiterated on the “Attributions” tab
Fig. 12
Fig. 12
Xenbase morpholino catalog is accessed via the “Search Morpholino” interface, under the Reagents & Protocols menu/tile. (A) Enter a gene symbol or MO sequence (red arrow) and click the Search button. Select the MO (black arrow), from the results table to open the MO page. (B) Each MO page includes all recorded details and a GBrowse snapshot showing the aligned position on the MO to the target mRNA. (C) Genomic alignments illustrate on-target (green) and off-target (pink) hits for X. tropicalis, X. laevis L and X. laevis S. Select a scaffold (highlighted in green) to view in GBrowse (orange arrow). (D) Publications using the same MO are listed, with a “View All Papers” option, which is reiterated on the ‘Attributions’ tab
Fig. 13
Fig. 13
Publications in the Xenbase Literature module are represented on an “Article Page.” We assign a database accession number (e.g., XB-ART-51882) and pull the full abstract and associated data from PubMed. Authors with Xenbase profiles have their name underlined (red arrow), indicating a link to their personal profile page. The abstract is automatically text-matched for gene names, gene symbols, and XAO terms (underlined). Direct links are provided for PubMed, PMC, and the Journal entries for the article (upper red box), enabling quick access to the full article and PDFs. Genes referenced in the article are either mentioned in abstract or added manually by curators, as are antibodies and morpholinos (lower red box). Matched and curated terms are underlined and linked to Gene Page(s), XAO, AB, and MO pages, respectively. Figures from the article (if available) are shown as thumbprints, and references cited in the paper follow. Use the [+] to expand to show captions (black arrow) or the full reference list. Double click the image to open the larger figure and the annotation table. Additionally, links to OMIM diseases and GO terms reverenced in the research, and to raw or supplementary data (e.g., NCBI/GEO and DRYAD) are shown when available. Images with new gene expression can be selected from figures and be placed as ‘summary images’ on a Gene Page (green arrow)

Similar articles

  • Xenbase: key features and resources of the Xenopus model organism knowledgebase.
    Fisher M, James-Zorn C, Ponferrada V, Bell AJ, Sundararaj N, Segerdell E, Chaturvedi P, Bayyari N, Chu S, Pells T, Lotay V, Agalakov S, Wang DZ, Arshinoff BI, Foley S, Karimi K, Vize PD, Zorn AM. Fisher M, et al. Genetics. 2023 May 4;224(1):iyad018. doi: 10.1093/genetics/iyad018. Genetics. 2023. PMID: 36755307 Free PMC article.
  • Xenbase: a genomic, epigenomic and transcriptomic model organism database.
    Karimi K, Fortriede JD, Lotay VS, Burns KA, Wang DZ, Fisher ME, Pells TJ, James-Zorn C, Wang Y, Ponferrada VG, Chu S, Chaturvedi P, Zorn AM, Vize PD. Karimi K, et al. Nucleic Acids Res. 2018 Jan 4;46(D1):D861-D868. doi: 10.1093/nar/gkx936. Nucleic Acids Res. 2018. PMID: 29059324 Free PMC article.
  • Xenbase: a Xenopus biology and genomics resource.
    Bowes JB, Snyder KA, Segerdell E, Gibb R, Jarabek C, Noumen E, Pollet N, Vize PD. Bowes JB, et al. Nucleic Acids Res. 2008 Jan;36(Database issue):D761-7. doi: 10.1093/nar/gkm826. Epub 2007 Nov 4. Nucleic Acids Res. 2008. PMID: 17984085 Free PMC article.
  • Xenopus genomic data and browser resources.
    Vize PD, Zorn AM. Vize PD, et al. Dev Biol. 2017 Jun 15;426(2):194-199. doi: 10.1016/j.ydbio.2016.03.030. Epub 2016 Mar 31. Dev Biol. 2017. PMID: 27039265 Free PMC article. Review.
  • Xenbase: Facilitating the Use of Xenopus to Model Human Disease.
    Nenni MJ, Fisher ME, James-Zorn C, Pells TJ, Ponferrada V, Chu S, Fortriede JD, Burns KA, Wang Y, Lotay VS, Wang DZ, Segerdell E, Chaturvedi P, Karimi K, Vize PD, Zorn AM. Nenni MJ, et al. Front Physiol. 2019 Feb 26;10:154. doi: 10.3389/fphys.2019.00154. eCollection 2019. Front Physiol. 2019. PMID: 30863320 Free PMC article. Review.

Cited by

References

    1. Gurdon JB (1960) The developmental capacity of nuclei taken from differentiating endoderm cells of Xenopus laevis. J Embryol Exp Morphol 8:505–526 - PubMed
    1. Gurdon JB, Elsdale TR, Fischberg M (1958) Sexually mature individuals of Xenopus lae-vis from the transplantation of single somatic nuclei. Nature 182(4627):64–65 - PubMed
    1. Sater AK, Moody SA (2017) Using Xenopus to understand human disease and developmental disorders. Genesis 55(1–2). 10.1002/dvg.22997 - DOI - PubMed
    1. Bowes JB, Snyder KA, Segerdell E, Gibb R, Jarabek C, Noumen E, Pollet N, Vize PD (2008) Xenbase: a Xenopus biology and genomics resource. Nucleic Acids Res 36(Database issue):D761–D767. 10.1093/nar/gkm826 - DOI - PMC - PubMed
    1. Karimi K, Vize PD (2014) The Virtual Xenbase: transitioning an online bioinformatics resource to a private cloud. Database (Oxford) 2014:bau108 10.1093/database/bau108 - DOI - PMC - PubMed

Publication types

LinkOut - more resources