. 2018 Jun 14;173(7):1810-1822.e16.
doi: 10.1016/j.cell.2018.03.069. Epub 2018 May 10.

LlamaTags: A Versatile Tool to Image Transcription Factor Dynamics in Live Embryos

Affiliations

LlamaTags: A Versatile Tool to Image Transcription Factor Dynamics in Live Embryos

Jacques P Bothma et al. Cell. .

Abstract

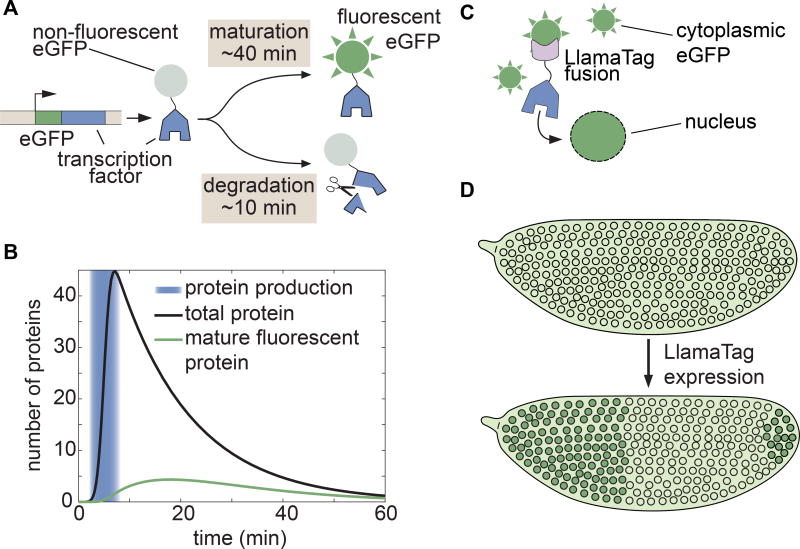
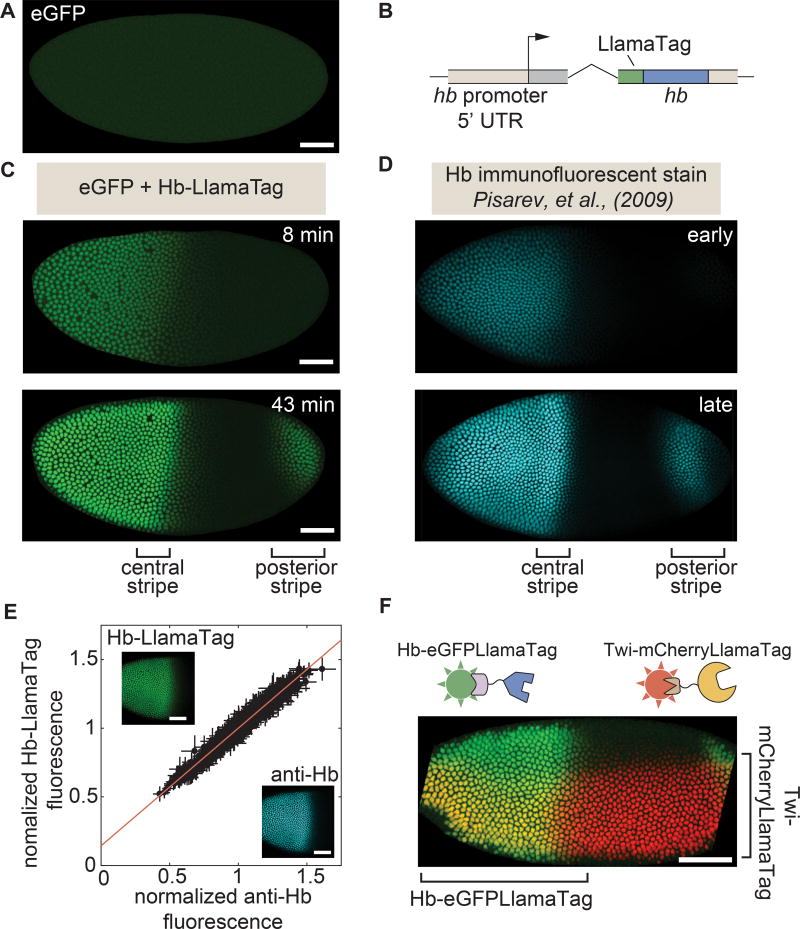
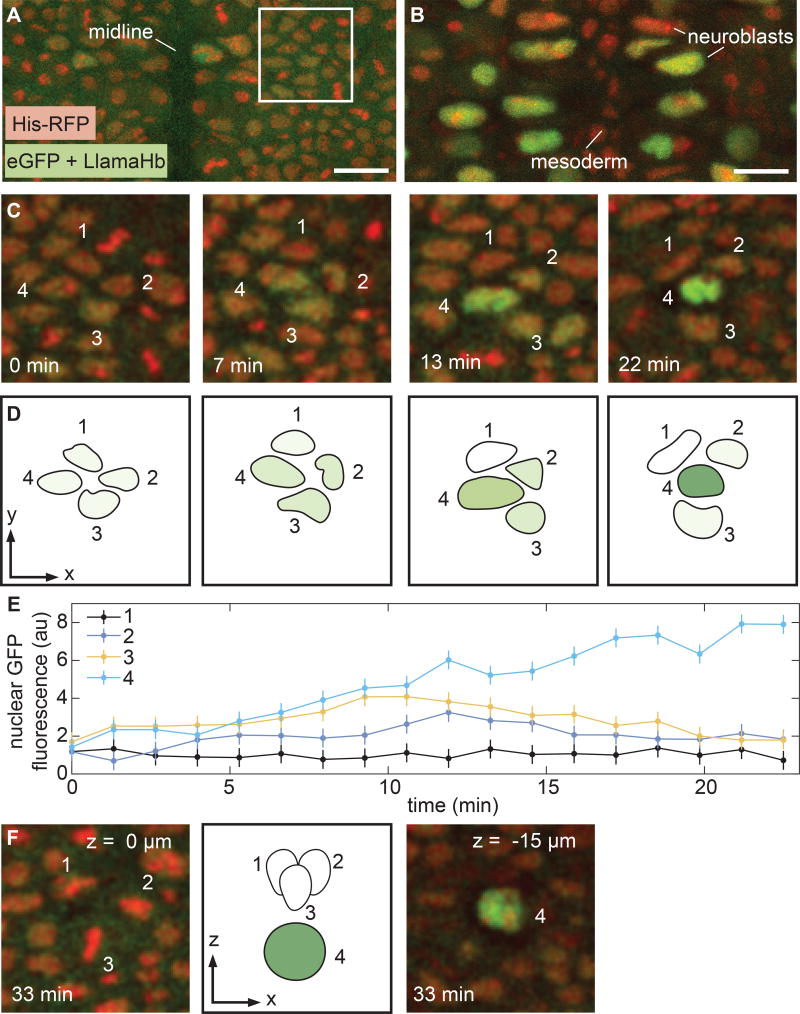
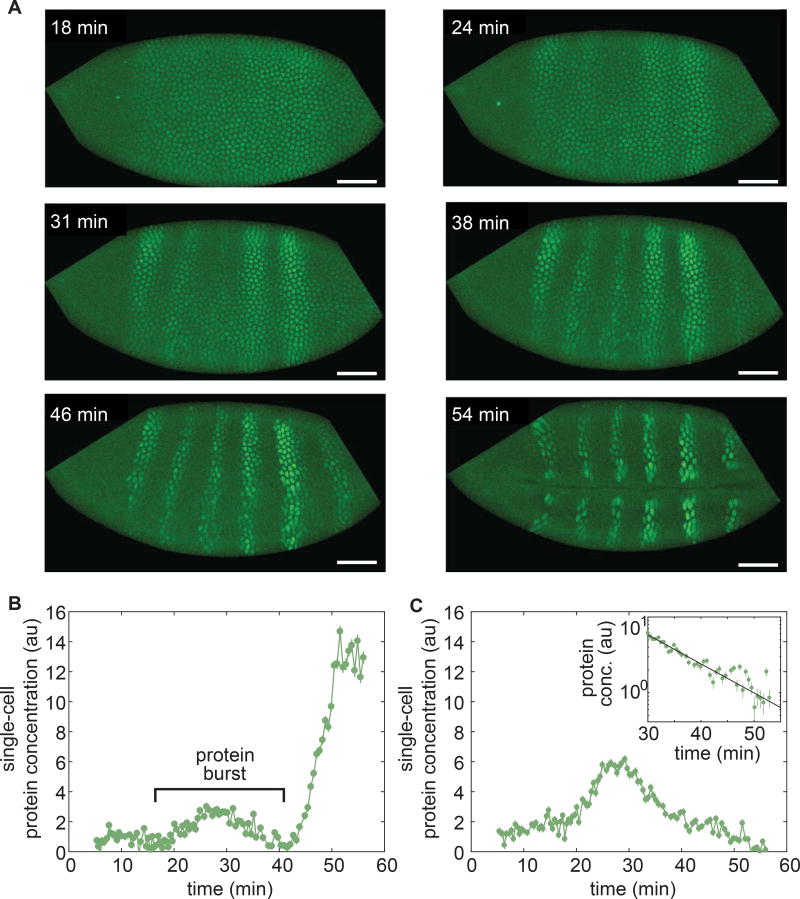
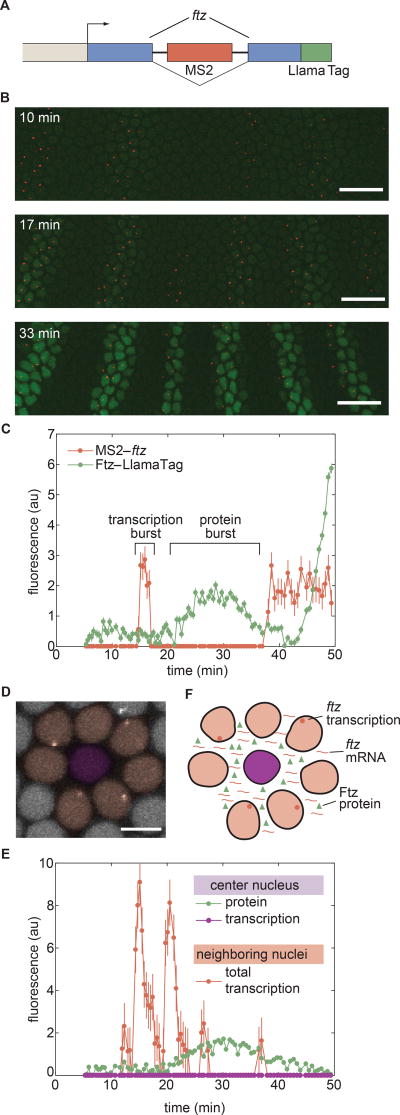
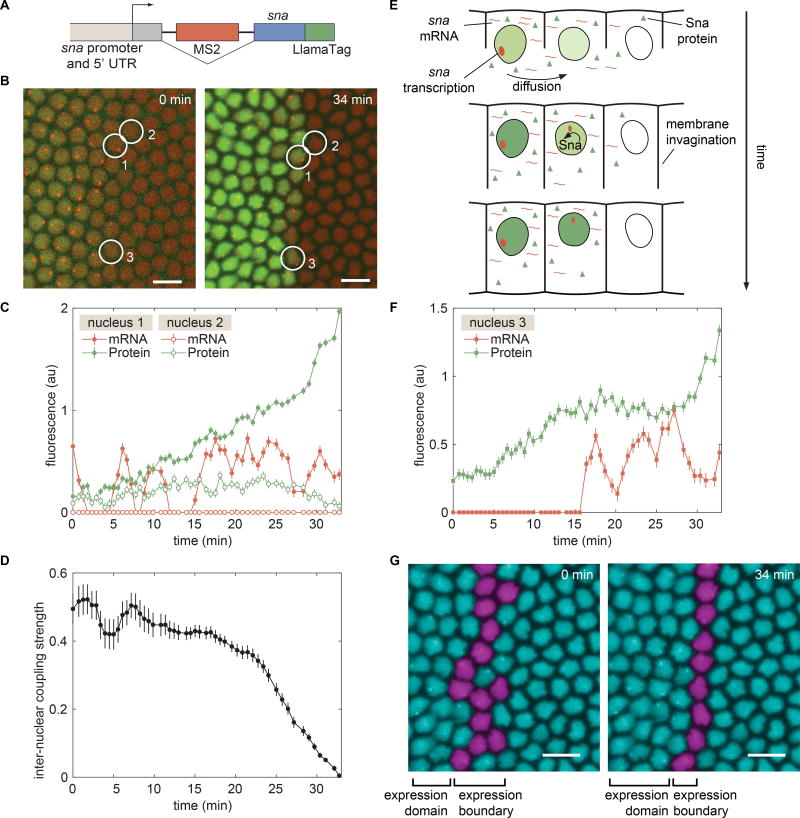
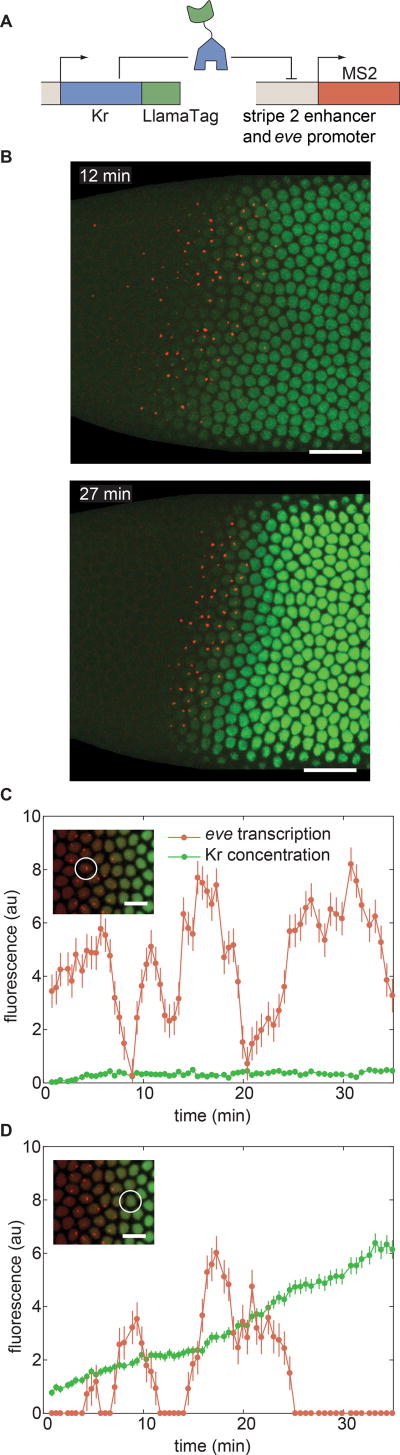
Embryonic cell fates are defined by transcription factors that are rapidly deployed, yet attempts to visualize these factors in vivo often fail because of slow fluorescent protein maturation. Here, we pioneer a protein tag, LlamaTag, which circumvents this maturation limit by binding mature fluorescent proteins, making it possible to visualize transcription factor concentration dynamics in live embryos. Implementing this approach in the fruit fly Drosophila melanogaster, we discovered stochastic bursts in the concentration of transcription factors that are correlated with bursts in transcription. We further used LlamaTags to show that the concentration of protein in a given nucleus heavily depends on transcription of that gene in neighboring nuclei; we speculate that this inter-nuclear signaling is an important mechanism for coordinating gene expression to delineate straight and sharp boundaries of gene expression. Thus, LlamaTags now make it possible to visualize the flow of information along the central dogma in live embryos.

Keywords: Drosophila melanogaster; Fushi-Tarazu; cell-to-cell communication; even-skipped; fluorescent protein maturation; live imaging; snail; transcription; transcription factors; translation.


Conflict of interest statement

Declaration of Interests

The authors declare no competing interests.

Figures

Figure 1
Figure 1. Genetically encoded LlamaTags overcome slow fluorescent protein maturation
(A) In many model organisms such as the fly, fluorescent protein fusions are degraded much faster than the rate at which they mature and begin to fluoresce. (B) Fluorescent protein maturation masks protein concentration dynamics qualitatively and quantitatively. Total fusion protein includes molecules with both mature and non-mature GFP; the number of mature, visible fluorescent fusion proteins due to a pulse of protein production is plotted over time. Maturation and degradation rates are as in (A); see STAR Methods for model assumptions and parameters. (C, D) In the LlamaTag approach, the fluorescent protein is maternally produced, ensuring that all proteins are fluorescent and uniformly distributed throughout the embryo. Upon translation of a LlamaTagged transcription factor, the fluorescent protein binds the nanobody. Here, eGFP is translocated to the nucleus as a result of the transcription factor’s nuclear localization signal, resulting in the enrichment of nuclear fluorescence. See also Figure S1.
Figure 2
Figure 2. LlamaTags capture endogenous protein dynamics in the early embryo
(A) In the absence of a LlamaTagged transcription factor, eGFP is uniformly distributed throughout the embryo. (B) CRISPR-mediated fusion of hb to a LlamaTag. (C,D) Hb-LlamaTag expression patterns recapitulate previous measurements obtained using fluorescent antibody staining: the early step-like Hb pattern (8 min into nc14) later forms two stripes of high protein concentration at 43 min into nc14, one in the middle of the embryo and one in its posterior. (E) Hb-LlamaTag eGFP signal per nucleus scales linearly with Hb fluorescence obtained by immunostaining. Data are normalized by their means. Error bars represent standard error over pixels within each nucleus. Inset, images of a fixed embryo in the GFP and anti-Hb channels that were used in generating the graph. See STAR Methods for further details. (F) Simultaneous visualization of Hb and Twi in an embryo initiating gastrulation using LlamaTags specific to eGFP and mCherry, respectively. Sharp edges on anterior and posterior of embryo are due to the embryo being larger than the field of view. All embryos are oriented with anterior to the left and ventral on the bottom. All scale bars are 50 µm. D, images taken from FlyEx database, see Pisarev et al. (2009). See also Figure S1–S4 and Movie S1.
Figure 3
Figure 3. Visualizing rapid transcription factor dynamics in the specification of neural progenitor cells
(A) Surface of the ventolateral region of a living stage 9 embryo, homozygous for Hb-LlamaTag and containing maternally deposited eGFP and His-RFP. Anterior is to the top of the image. (B) Interior of an embryo staged as in (A), z-section 15–17 µm below the surface. The large cells are neuroblasts; a subset shows high levels of nuclear eGFP due to Hb-LlamaTag expression. Mesoderm cells that lack Hb appear in the middle of the image. (C,D) Time course of neuroblast formation from a proneural cluster of ectoderm cells. Four of the cells in the cluster have been annotated. Hb protein levels rapidly change in each cell during specification. (E) Quantification of eGFP fluorescence in the proneural cluster in C and D. (F) Z-sections of the proneural cluster after the neuroblast has descended and the ectodermal cells associated with it have started to divide. Error bars are standard deviation of quantified eGFP fluorescence from 3 quantification trials for a single proneural cluster (STAR Methods). A, B, scale bars are 15 µm; C, D, and F, snapshots are 28 µm by 28 µm. See also Figure S5 and Movie S2.
Figure 4
Figure 4. Capturing fast protein production and degradation dynamics using LlamaTags
(A) Single-embryo, real-time protein expression dynamics of Ftz-LlamaTag. Time is measured with respect to the start of nc14. The field of view is smaller than the embryo, leading to cropping of the images. The embryo is oriented with anterior to the left and ventral on the bottom. The scale bar is 25 µm. (B) Ftz concentration in a nucleus inside a stripe as a function of time suggests the presence of protein bursts. (C) Ftz concentration in a nucleus outside a stripe as a function of time reveals Ftz degradation. Inset, exponential decay fit to Ftz degradation. Averaging fitting results for 58 nuclei yield a half-life of 7.9± 0.9 min. Error bars are standard error of the intensity values within a nucleus. See STAR Methods for further details. See also Movie S3.
Figure 5
Figure 5. Revealing the correlations among transcriptional bursts, protein bursts, and inter-nuclear coupling
(A) Transcription of ftz and Ftz protein production are monitored by labeling the nascent mRNA using MS2 loops and the protein using a LlamaTag, and imaged using laser-scanning confocal microscopy. (B) Representative frames from a movie of ftz transcription (red) and Ftz protein concentration (green). The embryo is oriented with anterior to the left and ventral on the bottom. Time stamps indicate the time since the beginning of nc14. Scale bars are 25 µm. (C) MS2 and LlamaTag data for a nucleus within a stripe reveal the relation between transcriptional bursts and protein bursts. (D) False-colored representation of the MCP-mCherry channel for a subset of nuclei. The central nucleus does not transcribe ftz (false-colored in purple, quantification in (E)) but is surrounded by nuclei that actively transcribe the ftz transgene (false-colored in pink, quantification in (E)). The scale bar is 5 µm. (E) The center nucleus in (D) presents no detectable ftz transcription (purple line), but does show an increase and decrease in the amount of nuclear protein present (green line). The appearance of Ftz protein in the nucleus that is not transcribing ftz is related to the fact that its neighboring nuclei are actively transcribing ftz (protein levels of neighboring nuclei are shown in Fig. S6). The red line shows the sum of the traces of transcriptional activity of all of the surrounding nuclei. (F) Proposed mechanism for the sharing of mRNA and protein between nuclei through diffusion in the Drosophila syncytium. Error bars for transcriptional activity are estimated from the uncertainty in quantifying the fluorescence background. Error bars for protein concentration are standard error of the intensity values within a nucleus. See Methods for further details. See also Movie S4 and Figure S6.
Figure 6
Figure 6. Consequences of inter-nuclear coupling for pattern formation of Sna
(A) Schematic of the mini-gene engineered to visualize transcription of sna with MS2 and Sna protein with the LlamaTag. (B) Visualization of sna transcription dynamics and protein production shows the progressive refinement of the Sna protein pattern. (C) Dynamics of sna transcription and protein production in nuclei 1 and 2 as indicated in B. (D) Nucleus-to-nucleus coupling strength as a function of time defined as the ratio between protein levels in transcriptionally inactive nuclei and neighboring active nuclei. (E) Schematic of the “kick start” model whereby a cell that does not transcribe sna initially can have transcription auto-activated through the diffusion of Sna from multiple neighbors. (F) mRNA and protein trace of a border nucleus in (B) that has initiated transcription as a result of Sna protein provided by neighbors. (G) False-colored nuclei showing the location and temporal change in the sna transcription boundary. B, G, scale bars are 10 µm. See also Movie S5 and Figure S7.
Figure 7
Figure 7. Uncovering the dynamics of transcription-factor input and transcriptional output at the single-cell level
(A) Strategy for LlamaTagging the Kr repressor and monitoring its regulation of eve stripe 2 transcription using MS2. (B) As time progresses, the increase in concentration of Kr-LlamaTag repressor (green) sharpens the posterior boundary of the stripe 2 of eve transcription (red). Scale bars are 25 µm. The embryo is oriented with anterior to the left and ventral on the bottom. (C,D) Input Kr concentration and output eve transcription for nuclei (C) within the stripe and (D) in the Kr repression domain reveal continuous transcriptional bursts at low Kr concentration, as well as less transcriptional bursting at high Kr concentrations. The scale bars in insets correspond to 10 µm. Error bars for transcriptional activity are estimated from the uncertainty in quantifying the fluorescence background. Error bars for protein concentration are standard error of the intensity values within a nucleus. See STAR Methods for further details. See also Movie S6.

Similar articles

Cited by

References

    1. Abu-Arish A, Porcher A, Czerwonka A, Dostatni N, Fradin C. High mobility of bicoid captured by fluorescence correlation spectroscopy: implication for the rapid establishment of its gradient. Biophys J. 2010;99:L33–35. - PMC - PubMed
    1. Ay A, Knierer S, Sperlea A, Holland J, Ozbudak EM. Short-lived Her proteins drive robust synchronized oscillations in the zebrafish segmentation clock. Development. 2013;140:3244–3253. - PubMed
    1. Aymoz D, Wosika V, Durandau E, Pelet S. Real-time quantification of protein expression at the single-cell level via dynamic protein synthesis translocation reporters. Nature communications. 2016;7:11304. - PMC - PubMed
    1. Balleza E, Kim JM, Cluzel P. Systematic characterization of maturation time of fluorescent proteins in living cells. Nat Methods. 2018;15:47–51. - PMC - PubMed
    1. Bieli D, Alborelli I, Harmansa S, Matsuda S, Caussinus E, Affolter M. Development and Application of Functionalized Protein Binders in Multicellular Organisms. Int Rev Cell Mol Biol. 2016;325:181–213. - PubMed

Publication types

MeSH terms