ACBD3 is required for FAPP2 transferring glucosylceramide through maintaining the Golgi integrity
- PMID: 29750412
- PMCID: PMC6734144
- DOI: 10.1093/jmcb/mjy030
ACBD3 is required for FAPP2 transferring glucosylceramide through maintaining the Golgi integrity
Abstract
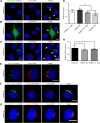
Glycosphingolipid (GSL) metabolism is involved in various physiological processes, including all major cell signaling pathways, and its dysregulation is linked to some diseases. The four-phosphate adaptor protein FAPP2-mediated glucosylceramide (GlcCer) transport for complex GSL synthesis has been studied extensively. However, the molecular machinery of FAPP2 as a GlcCer-transferring protein remains poorly defined. Here, we identify a Golgi-resident protein, acyl-coenzyme A binding domain containing 3 (ACBD3), as an interacting partner of FAPP2. We find that ACBD3 knockdown leads to dramatic Golgi fragmentation, which subsequently causes FAPP2 dispersal throughout the cytoplasm and a decreased localization at trans-Golgi network. The further quantitative lipidomic analysis indicates that ACBD3 knockdown triggers abnormal sphingolipid metabolism. Interestingly, the expression of siRNA-resistant full-length ACBD3 can rescue these defects caused by ACBD3 knockdown. These data reveal critical roles for ACBD3 in maintaining the integrity of Golgi morphology and cellular sphingolipid homeostasis and establish the importance of the integrated Golgi complex for the transfer of GlcCer and complex GSL synthesis.
Keywords: ACBD3; FAPP2; Golgi fragmentation; glucosylceramide; glycosphingolipids.
© The Author(s) (2018). Published by Oxford University Press on behalf of Journal of Molecular Cell Biology, IBCB, SIBS, CAS. All rights reserved.
Figures


Similar articles
-
Vesicular and non-vesicular transport feed distinct glycosylation pathways in the Golgi.Nature. 2013 Sep 5;501(7465):116-20. doi: 10.1038/nature12423. Epub 2013 Aug 4. Nature. 2013. PMID: 23913272
-
Glycosphingolipid synthesis requires FAPP2 transfer of glucosylceramide.Nature. 2007 Sep 6;449(7158):62-7. doi: 10.1038/nature06097. Epub 2007 Aug 8. Nature. 2007. PMID: 17687330
-
Two sphingolipid transfer proteins, CERT and FAPP2: their roles in sphingolipid metabolism.IUBMB Life. 2008 Aug;60(8):511-8. doi: 10.1002/iub.83. IUBMB Life. 2008. PMID: 18459163 Review.
-
Acyl-coenzyme A binding domain containing 3 (ACBD3; PAP7; GCP60): an emerging signaling molecule.Prog Lipid Res. 2010 Jul;49(3):218-34. doi: 10.1016/j.plipres.2009.12.003. Epub 2010 Jan 4. Prog Lipid Res. 2010. PMID: 20043945 Free PMC article. Review.
-
Structural analyses of 4-phosphate adaptor protein 2 yield mechanistic insights into sphingolipid recognition by the glycolipid transfer protein family.J Biol Chem. 2018 Oct 26;293(43):16709-16723. doi: 10.1074/jbc.RA117.000733. Epub 2018 Sep 11. J Biol Chem. 2018. PMID: 30206120 Free PMC article.
Cited by
-
Identification of Genetic Variations and Candidate Genes Responsible for Stalk Sugar Content and Agronomic Traits in Fresh Corn via GWAS across Multiple Environments.Int J Mol Sci. 2022 Nov 4;23(21):13490. doi: 10.3390/ijms232113490. Int J Mol Sci. 2022. PMID: 36362278 Free PMC article.
-
Functions of Viroporins in the Viral Life Cycle and Their Regulation of Host Cell Responses.Front Immunol. 2022 Jun 2;13:890549. doi: 10.3389/fimmu.2022.890549. eCollection 2022. Front Immunol. 2022. PMID: 35720341 Free PMC article. Review.
-
Gangliosides and Neuroblastomas.Int J Mol Sci. 2020 Jul 27;21(15):5313. doi: 10.3390/ijms21155313. Int J Mol Sci. 2020. PMID: 32726962 Free PMC article. Review.
-
Sphingolipid metabolism and regulated cell death in malignant melanoma.Apoptosis. 2024 Dec;29(11-12):1860-1878. doi: 10.1007/s10495-024-02002-y. Epub 2024 Jul 28. Apoptosis. 2024. PMID: 39068623 Review.
-
Acyl-CoA-Binding Domain-Containing 3 (ACBD3; PAP7; GCP60): A Multi-Functional Membrane Domain Organizer.Int J Mol Sci. 2019 Apr 24;20(8):2028. doi: 10.3390/ijms20082028. Int J Mol Sci. 2019. PMID: 31022988 Free PMC article. Review.
References
Publication types
MeSH terms
Substances
LinkOut - more resources
Full Text Sources
Other Literature Sources

