. 2018 May 8;11(529):eaao1815.
doi: 10.1126/scisignal.aao1815.

Chemical synapses without synaptic vesicles: Purinergic neurotransmission through a CALHM1 channel-mitochondrial signaling complex

Affiliations

Chemical synapses without synaptic vesicles: Purinergic neurotransmission through a CALHM1 channel-mitochondrial signaling complex

Roman A Romanov et al. Sci Signal. .

Abstract

Conventional chemical synapses in the nervous system involve a presynaptic accumulation of neurotransmitter-containing vesicles, which fuse with the plasma membrane to release neurotransmitters that activate postsynaptic receptors. In taste buds, type II receptor cells do not have conventional synaptic features but nonetheless show regulated release of their afferent neurotransmitter, ATP, through a large-pore, voltage-gated channel, CALHM1. Immunohistochemistry revealed that CALHM1 was localized to points of contact between the receptor cells and sensory nerve fibers. Ultrastructural and super-resolution light microscopy showed that the CALHM1 channels were consistently associated with distinctive, large (1- to 2-μm) mitochondria spaced 20 to 40 nm from the presynaptic membrane. Pharmacological disruption of the mitochondrial respiratory chain limited the ability of taste cells to release ATP, suggesting that the immediate source of released ATP was the mitochondrion rather than a cytoplasmic pool of ATP. These large mitochondria may serve as both a reservoir of releasable ATP and the site of synthesis. The juxtaposition of the large mitochondria to areas of membrane displaying CALHM1 also defines a restricted compartment that limits the influx of Ca2+ upon opening of the nonselective CALHM1 channels. These findings reveal a distinctive organelle signature and functional organization for regulated, focal release of purinergic signals in the absence of synaptic vesicles.


Conflict of interest statement

Competing Interests: Authors declare no competing financial interests.

Competing Intrests: none

Figures

Fig. 1
Fig. 1
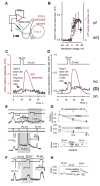
Depolarization-evoked Ca2+ signals in type II taste cells. (A) Preparation for simultaneous monitoring of intracellular Ca2+ and ATP release. (B) Calcium responses (black dots: mean ± sd) in taste cells showing a calcium response depend on the command voltage. Red triangles show voltage-dependence of the ATP release (data from Romanov et al (22)). (C & D): Representative recordings showing: (C) no change in intracellular Ca2+ (n=23), and (D) small voltage-related Ca2+ signals (n=17) on depolarization. Black arrows indicate Ca2+ response while the red line shows ATP. (E) Changes in extracellular calcium leads to changes in Ca2+ responses. (F) Lowering extracellular pH leads to partial inhibition of currents and decrease of Ca2+responses. (G) Application of extracellular 100 μM Gd3+ (gray bar) leads to decreases in current and Ca2+ responses (n=4), while no rundown occurs in the same time range in control preparations (bottom trace). (H) Negative pressure applied through the patch pipette increases calcium events in 3 of 5 cells.
Fig. 2
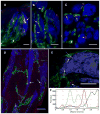
Fig. 2. CALHM1 lies at points of contact between taste cells and nerve fibers
(A–E) Immunostaining for CALHM1 (red), nerve fibers (P2X2 Green) and Type II taste cells (TrpM5- driven GFP, rendered in Blue). Punctate patches of CALHM1 (arrows) occur only in Type II taste cells and only at points of apposition with nerve fibers. Scale bars A. 10 μm; B – E. 5 μm. D. Zeiss Airyscan image; others conventional LSCM. (F) A line plot of one such point of contact shown in panel E shows that the CALHM1 staining (red curve) lies between the Type II cell cytoplasm (blue curve) and the nerve membranes (bimodal green line).
Fig. 3
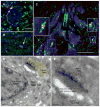
Fig. 3. CALHM1 lies adjacent to large mitochondria
(A–C) Colocalization of CALHM1 (red) and Cytochrome C (green) marking mitochondria. The CALHM1 patches (arrows) are always associated with one or more large mitochondria. Type II taste cells (TrpM5- driven GFP) rendered in Blue. Scale bar in A & B = 2 μm. Scale bar in C is 10μm with insets at 2x digital magnification and Unsharp Mask of 7.5 pixels at 85%. See Supplementary Fig. 4 for validation of the CALHM1 antibody. D & E. Electron micrographs of a taste cell-neurite contact immunoreacted for CALHM1 with peroxidase-based detection system. The dark immunoreaction product (arrows) lies at the interface between the taste cell membrane and the atypical mitochondrion consistent with the intracellular location of the CALHM1 epitope recognized by the antibody. Panel E is an enlargement of the boxed area in Panel D. Scale bar in D is 500nm; in E the scale bar is 200nm. The nerve fiber process is shaded yellow in panel D to facilitate visualization of the different structures in this unstained section.
Figure 4
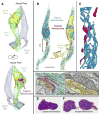
Figure 4. Reconstructions of typical mitochondria from sbfSEM data
(A & A′) Type II taste cell (green), a nerve fiber (yellow) and a Type I cell (gray) showing the relationship of atypical mitochondria (red) and sensory nerve fibers. A–B. Atypical mitochondria, rendered in red, appear only in areas of the taste cell facing the innervating nerve fiber. See Supplementary Video 1. (B & B′) Reconstruction of a Type II taste cell (pale green; nucleus dark green) showing typical (blue) and atypical mitochondria (red) in relation to the sensory nerve fiber (yellow in B′). Scale Bar = 10 μm. See also Supplementary Video 2. (C) Enlarged region from panel B, showing separation of atypical (red) from typical mitochondria (blue). Scale bar in Panel B = 3.82 μm as applied to C. See Supplementary Video 3. (D) Single image from a sbfSEM data set showing atypical mitochondria (pseudocolored red) and the afferent nerve terminal (yellow). Boxed area enlarged at right showing the tubular cristae within the atypical mitochondria. Scale bars = 1 μm. E & F. 3-D reconstructions of typical (E) and atypical (F) mitochondria (same pair as in Panel D). See also Suppl. Video 4.
Fig. 5
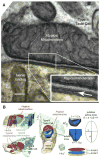
Fig. 5. Cell membrane specialization at the CALHM1-mitochondrial complex
(A) Conventional transmission electron micrograph illustrating the relationship between the membrane of the atypical mitochondrion, the plasma membrane of the taste cells and the nerve ending. Inset at lower right is an enlargement of the boxed area in the main image. The insert has been enlarged (3x) and the edges enhanced by application of an Unsharp Mask filter (60% @ 5 pixels). The arrow points to the synaptic cleft between the taste cell and nerve fiber. The uniform spacing between the mitochondrial outer membrane and the plasma membrane strongly suggests the presence of a scaffolding to maintain this relationship. Scale bar = 100 nm for the main image and 33.3 nm for the inset. (B) 3D reconstruction of a contact between Type II taste cell and the nerve ending (yellow) including visualizations of conventional mitochondria in the nerve ending (magenta), and an atypical mitochondrion (red) and conventional mitochondria (cyan) inside the taste cell (green). Note putative sub-mitochondrial active zone highlighted in blue. Detail to the right shows the method for approximating the volume of the different synaptic compartments.
Fig. 6
Fig. 6. Blocking ATP production in mitochondria blocks release of ATP
Oligomycin blocks ATP synthase in mitochondria allowing for the build-up of ADP within the matrix and intermembrane spaces. (A) ATP biosensor cells were transfected with mRNAs encoding P2X2/P2X3 ionotropic purinergic receptors, which are responsive to ATP but not ADP. (B) Before application of oligomycin, taste cells show a robust and repeatable release of ATP (blue trace). Five minutes after application of oligomycin, depolarization-evoked ATP release was eliminated (red trace). The bar graph shows a quantitative comparison of the responses (5 minutes with oligomycin, n=4, mean±SEM, P<0.001). (C) COS1 cells endogenously express P2Y receptors leaving them responsive to both ATP and ADP. (D) The response of the COS1 cells after oligomycin treatment (red trace in D) is attributable entirely to ADP rather than ATP since transfected ATP sensor CHO cells (B) show no ATP response. The bar graph shows a quantitative comparison of the responses (5 minutes with oligomycin, mean ± SEM. n=6, t-test ***P<0.001, **P<0.01). Scale bars in (A & C) are 10 μm. Validation of biosensor sensitivity and functionality in the presence of oligomycin are given in Supplementary Fig. 2.
Fig. 7
Fig. 7. Schematic diagram of a mitochondrial/CALHM1 synapse between a Type II taste cell (pale blue) and an afferent nerve terminal (green)
The CALHM1 channels lie within the plasma membrane of the taste cell between the atypical mitochondrion (pink) and the nerve terminal. In the resting state (1), CAHLM1 channels (Blue) are closed and ATP levels in the presynaptic compartment will be close to levels in the intermembrane space of the mitochondrion due to diffusion of ATP (red balls) through the porin channels of the outer mitochondrial membrane. Taste evoked action potentials in the taste cell open the CALHM1 channels (2) allowing ATP to flow into the synaptic cleft between the taste cell and the afferent nerve terminal. (3) The ATP in the intercellular space binds to and gates open the P2X receptors (green bars) in the neural membrane, permitting influx of sodium ions (Na+) which depolarizes the afferent terminal. (4) As the taste cell repolarizes, CALHM1 channels close and extracellular levels of ATP return to pre-stimulus levels.

Similar articles

Cited by

References

    1. Foster M, Sherrington SC. A Textbook of Physiology, Part 3. 7. Macmillan; London: 1897.
    1. Grakoui A, Bromley SK, Sumen C, Davis MM, Shaw AS, Allen PM, Dustin ML. The immunological synapse: a molecular machine controlling T cell activation. Science. 1999;285:221. published online EpubJul 09. - PubMed
    1. Finger TE, Danilova V, Barrows J, Bartel DL, Vigers AJ, Stone L, Hellekant G, Kinnamon SC. ATP signaling is crucial for communication from taste buds to gustatory nerves. Science. 2005;310:1495. doi: 10.1126/science.1118435. published online EpubDec 2. - DOI - PubMed
    1. Vandenbeuch A, Larson ED, Anderson CB, Smith SA, Ford AP, Finger TE, Kinnamon SC. Postsynaptic P2X3-containing receptors in gustatory nerve fibres mediate responses to all taste qualities in mice. J Physiol. 2015;593:1113. doi: 10.1113/jphysiol.2014.281014. published online EpubMar 1. - DOI - PMC - PubMed
    1. Vandenbeuch A, Anderson CB, Ford AP, Smith S, Finger TE, Kinnamon SC. A selective P2X3, P2X2/3 receptor antagonist abolishes responses to all taste stimuli in mice. Chem Senses. 2013;38:86. doi: 10.1093/chemse/bjt036). - DOI

Publication types

LinkOut - more resources