. 2018 May 21;28(10):1570-1584.e6.
doi: 10.1016/j.cub.2018.03.068. Epub 2018 May 3.

Quantitative Control of GPCR Organization and Signaling by Endocytosis in Epithelial Morphogenesis

Affiliations

Quantitative Control of GPCR Organization and Signaling by Endocytosis in Epithelial Morphogenesis

Ankita Jha et al. Curr Biol. .

Abstract

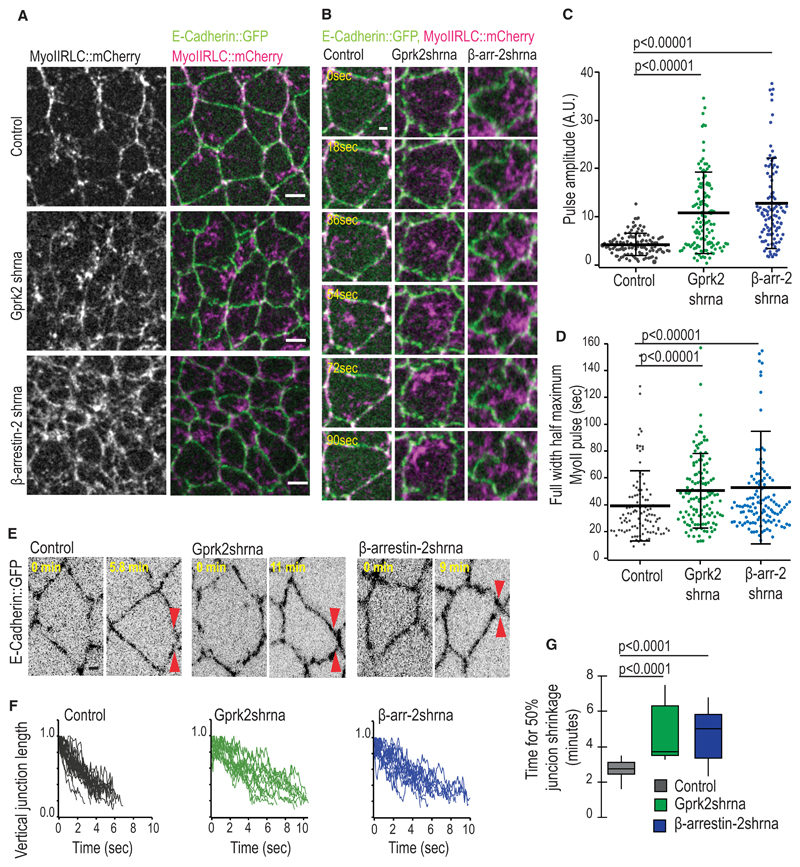
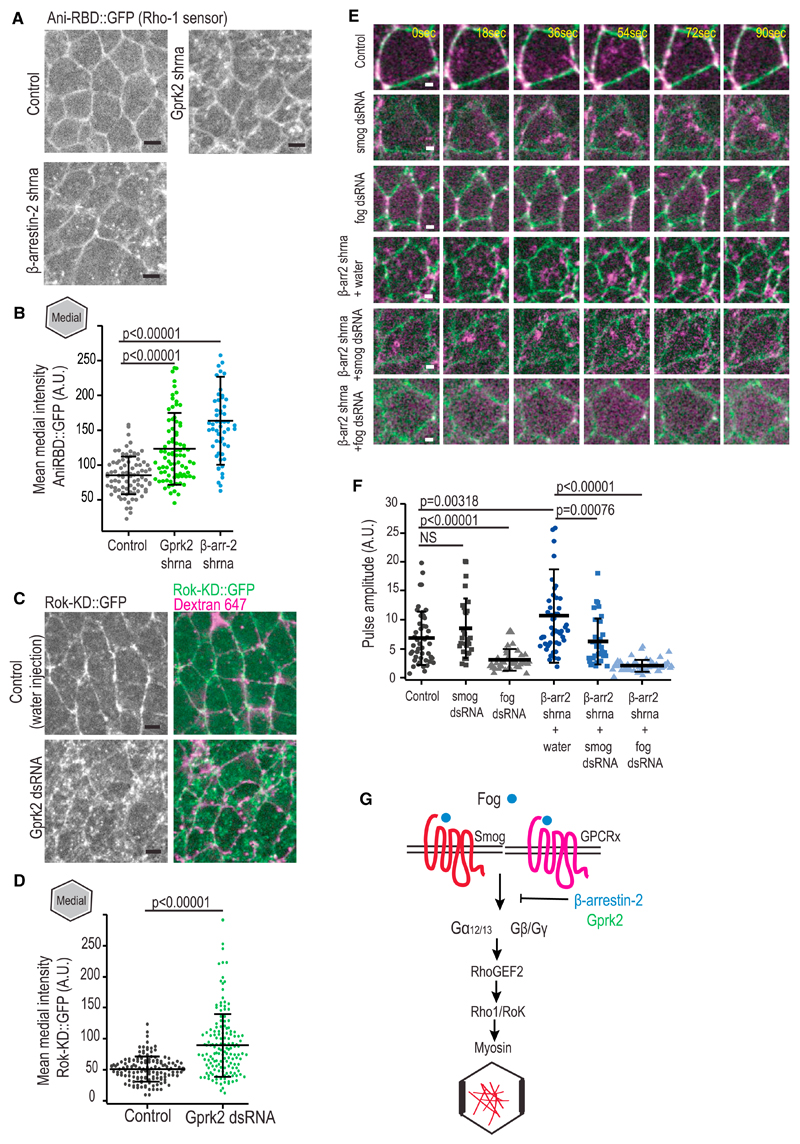
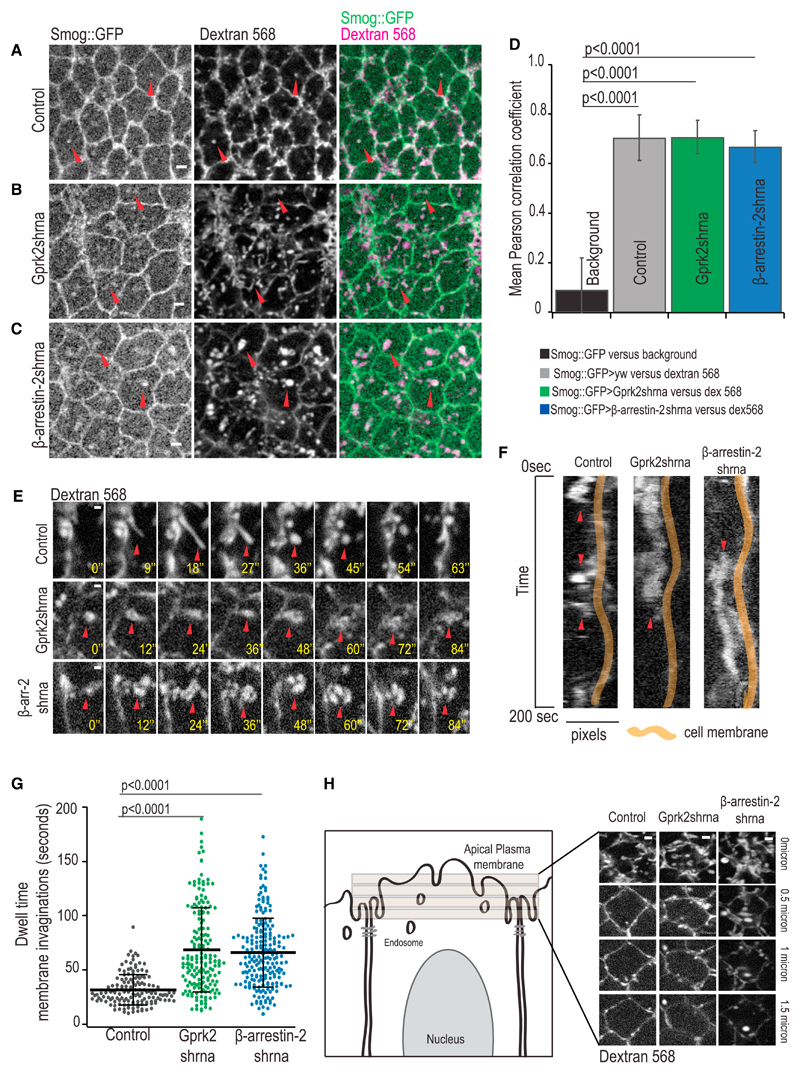
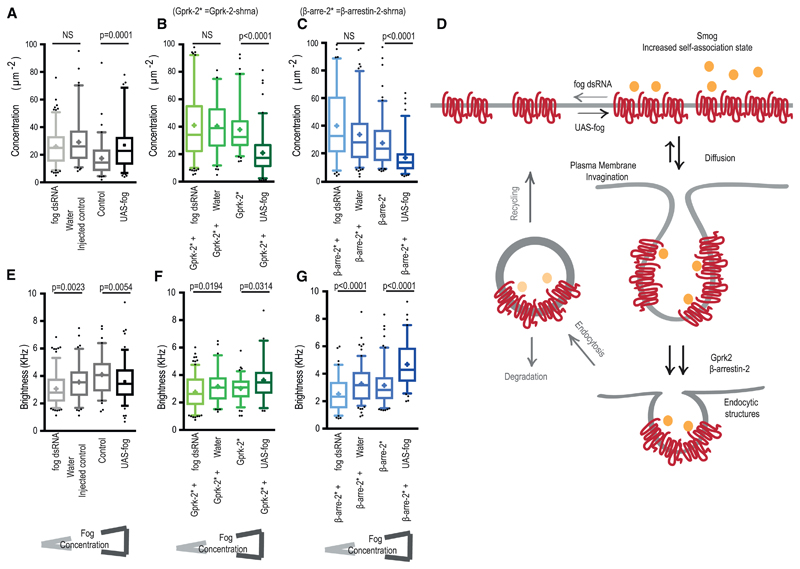
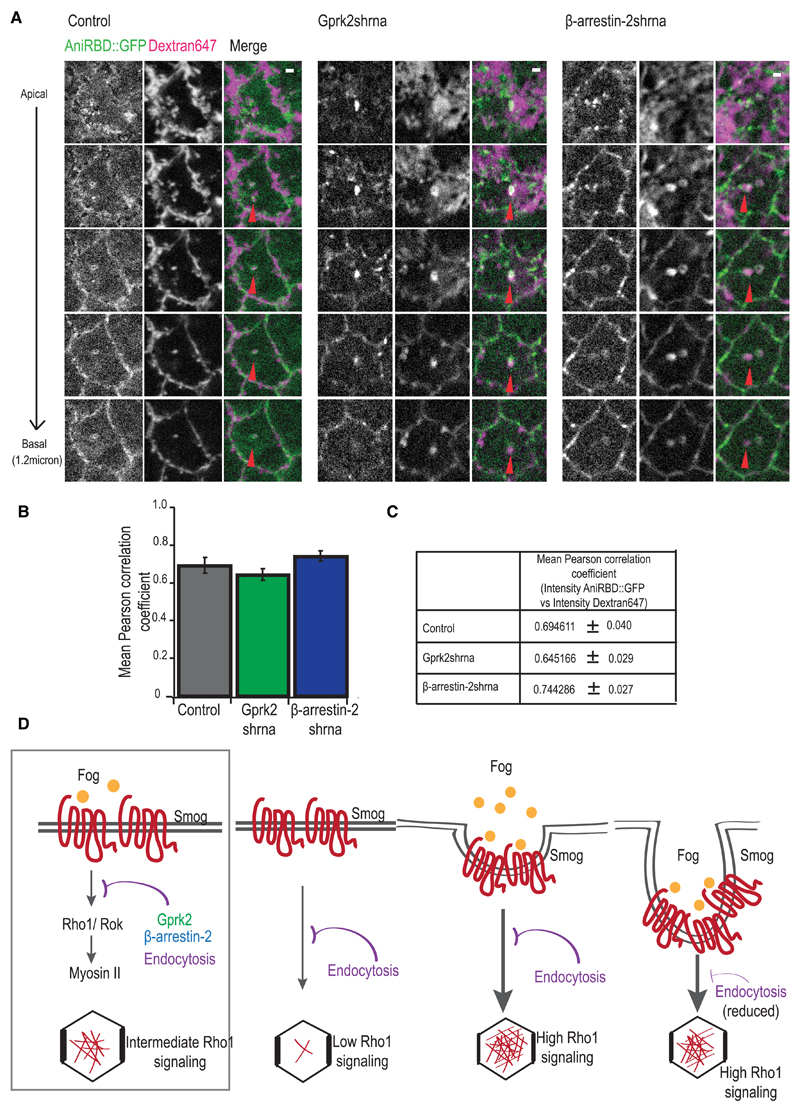
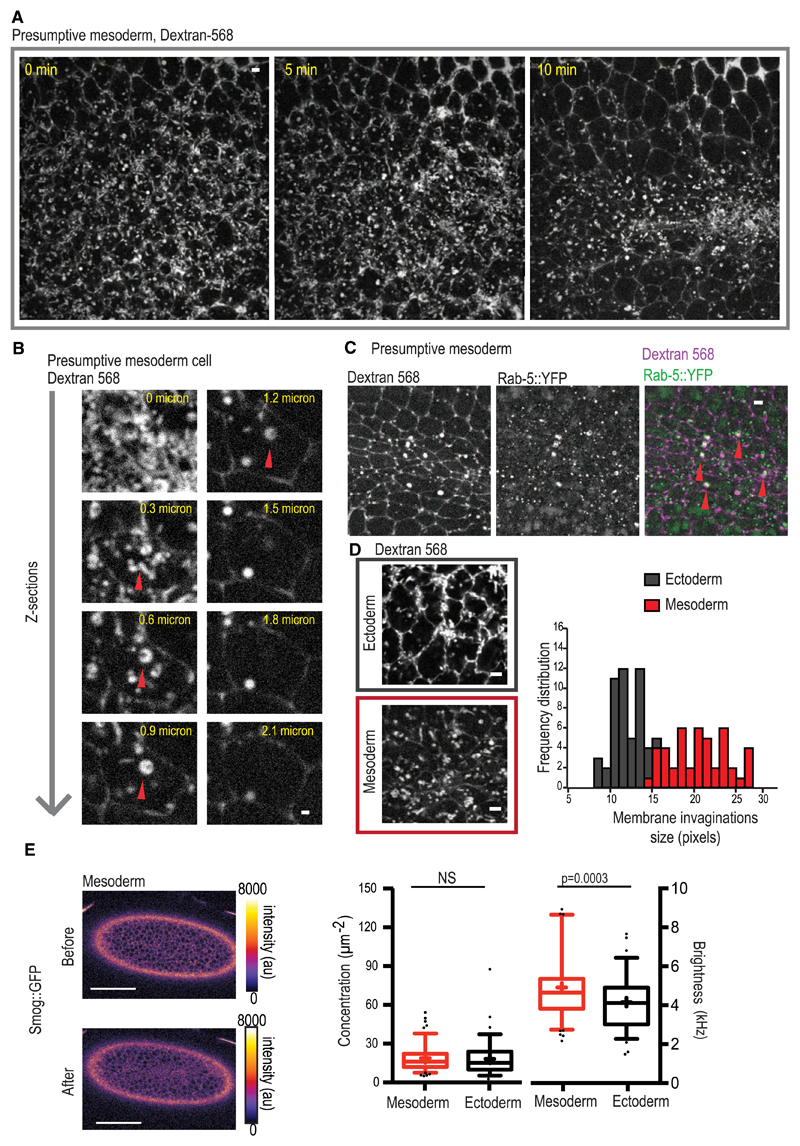
Tissue morphogenesis arises from controlled cell deformations in response to cellular contractility. During Drosophila gastrulation, apical activation of the actomyosin networks drives apical constriction in the invaginating mesoderm and cell-cell intercalation in the extending ectoderm. Myosin II (MyoII) is activated by cell-surface G protein-coupled receptors (GPCRs), such as Smog and Mist, that activate G proteins, the small GTPase Rho1, and the kinase Rok. Quantitative control over GPCR and Rho1 activation underlies differences in deformation of mesoderm and ectoderm cells. We show that GPCR Smog activity is concentrated on two different apical plasma membrane compartments, i.e., the surface and plasma membrane invaginations. Using fluorescence correlation spectroscopy, we probe the surface of the plasma membrane, and we show that Smog homo-clusters in response to its activating ligand Fog. Endocytosis of Smog is regulated by the kinase Gprk2 and β-arrestin-2 that clears active Smog from the plasma membrane. When Fog concentration is high or endocytosis is low, Smog rearranges in homo-clusters and accumulates in plasma membrane invaginations that are hubs for Rho1 activation. Lastly, we find higher Smog homo-cluster concentration and numerous apical plasma membrane invaginations in the mesoderm compared to the ectoderm, indicative of reduced endocytosis. We identify that dynamic partitioning of active Smog at the surface of the plasma membrane or plasma membrane invaginations has a direct impact on Rho1 signaling. Plasma membrane invaginations accumulate high Rho1-guanosine triphosphate (GTP) suggesting they form signaling centers. Thus, Fog concentration and Smog endocytosis form coupled regulatory processes that regulate differential Rho1 and MyoII activation in the Drosophila embryo.

Keywords: G protein-coupled receptor; G protein-coupled receptor kinase; acto-myosin contractility; endocytosis; epithelial morphogenesis; fluorescence correlation spectroscopy; gastrulation; β-arrestin.


Conflict of interest statement

Declaration of Interests

The authors declare no competing interests.

Figures

Figure 1
Figure 1. Gprk2 and β-Arrestin-2 Control Medial Myosin Activation and Dynamics in Ectoderm
(A) Apical projections of ectoderm tissue expressing E-cad::GFP (green) and MyoIIRLC::mCherry (magenta) at 10 min post-cellularization in control, Gprk2-shRNA, and β-arrestin-2-shRNA. Scale bar, 5 μm. (B) Example of cell expressing E-cad::GFP (green) and MyoIIRLC-mCherry (magenta) in different genotypes with medial myosin intensity time trace for a pulse. Scale bar, 1 μm. (C) Average pulse amplitude. (D) FWHM of the pulses of myosin in different genotypes. Each data point represents (n) individual pulses pooled from (N) embryos. n, N(control) = 109, 4; n, N(Gprk2-shRNA) = 131, 4; n, N(β-arrestin-2-shRNA) = 106, 4. (E) Cells expressing E-cad::GFP showing junction shrinkage in different given genotypes. Arrowheads (red) show the shrinkage of the junction. Scale bar, 1 μm. (F) Temporal traces of junction shrinkage in different genotypes normalized to the maximum junction length of that time trace. (G) Time for 50% of junction shrinkage (n = 30 and N = 4). p values are calculated by Mann-Whitney U test. Error bars depict SEM in (C) and (D). See also Figure S1.
Figure 2
Figure 2. Gprk2 and β-Arrestin-2 Modulate Rho1 and Rok Activation and Fog-Smog Signaling
(A) Distribution of Rho1:GTP sensor or Anilin Rho-binding domain fused with GFP (AniRBD::GFP) (green) 10 min into germband extension in control, Gprk2-shRNA, and β-arrestin-2-shRNA embryos. Scale bars, 5 μm. (B) Quantification of AniRBD::GFP medial intensity in the above genetic backgrounds. Each data point (n) represents one cell from ectoderm at 10 min into germband elongation. N, number of embryos. Control n = 85, N = 5; Gprk2-shRNA n = 85, N = 5; β-arrestin-2-shRNA n = 55, N = 4. (C) Distribution of RokKD::GFP (kinase dead, green) in left panels and merge with Dextran-647 (magenta) injected in perivitelline space, in control (water-injected embryos) and Gprk2-dsRNA-injected embryos. Scale bars, 5 μm. (D) Quantification of RokKD::GFP intensity medially in control (water injected; n = 134, N = 5) and Gprk2-dsRNA embryos (n = 153, N = 5). All p values are calculated by Mann-Whitney U test and each data point represents one cell from the embryo. (E) Example of myoII pulses from embryos expressing E-cad::GFP (green) and MyoIIRLC::mCherry (magenta) in control (water injected) n = 46; smog-dsRNA, n = 28; fog-dsRNA, n = 38; β-arrestin-2-shRNA (water injected), n = 52; β-arrestin-2-shRNA + smog-dsRNA, n = 33; β-arrestin-2-shRNA + fog dsRNA, n = 50 medial myosin intensity time trace for a pulse. Scale bars, 1 μm. (F) Average pulse amplitude of the pulses of myosin in different genotypes. Each data point represents one pulse (n = shown above, N = 3 embryos); p values are calculated by Mann-Whitney U test. (G) Schematic showing Fog-Smog-signaling pathway for the activation of medial MyoII, Gprk2, and β-arrestin-2 attenuates the G protein-dependent signaling. Error bars depict SEM in (B), (D), and (F). See also Figure S2.
Figure 3
Figure 3. FCS of Smog::GFP
(A) Representative confocal image of Smog::GFP embryo. Illustration shows Smog fused with GFP on the C-terminal end on the plasma membrane. (B) Example of a fluorescence time trace at the apical membrane of a Smog::GFP- (black) expressing cell and yellow white (yw) embryo taken as background (gray). The top panels display zoomed-in traces exemplifying the increased fluctuations of fluorescence due to Smog::GFP. (C) Mean (closed circles) and SD (shaded area) of 10 raw autocorrelated traces of Smog::GFP in control (black), Gprk2-KD (green), β-arrestin-2-KD (blue), and uncorrelated background from yw embryo (gray). (D) Representative confocal image of Ubi-VsV G::GFP embryo with illustration of trimeric VsV G::GFP. (E) Brightness (left) and protein density concentration (right) of Smog::GFP and VsV G::GFP in apical cell membrane of cell in ectoderm. FCS analysis in Smog::GFP from 84 measurements from 20 cells in 6 embryos and VsV G::GFP from 57 measurements from 18 cells in 7 embryos is shown. (F) (Left) Boxplots from the average density (concentration) of moving Smog::GFP units. (Right) Average brightness of moving Smog::GFP during each 10-s trace is shown. Control = 84 measurements, 20 cells from 6 embryos; Gprk2-KD = 99 measurements, 25 cells from 6 embryos; β-arrestin-2-KD = 121 measurements, 30 cells from 7 embryos. p values calculated by Mann-Whitney U test. Error bars depict SEM in (C), (E), and (F). See also Figure S3.
Figure 4
Figure 4. Gprk2 and β-Arrestin-2 Regulate the Formation of Apical Plasma Membrane Invaginations
(A–C) Images represent apical region in the cells from the ventrolateral region of the embryos. Smog::GFP embryos are injected with Dextran-568 to show colocalization in (A) control, (B) Gprk2-shRNA, and (C) β-arrestin-2-shRNA. Scale bars (A–C), 5 μm. Arrowheads (red) mark Smog localization in the Dextran-filled structures. (D) Pixel-pixel correlation between the two selected channels from Dextran-filled structures is taken. Several data point clouds are extracted from embryos. The mean correlation coefficients (Pearson correlation) with SEM are calculated for several data points in different conditions of control, Gprk2-shRNA, and β-arrestin-2-shRNA compared to background intensities in the graph (N = 4 embryos). p values are calculated by Mann-Whitney U test. (E) Still images from a time-lapse movie of Dextran-568 injected in control, Gprk2-shRNA, and β-arrestin-2-shRNA embryos. Arrowheads (red) follow the dynamics of Dextran structures over time. (F) Kymographs showing dynamic trace of Dextran-labeled structures over 200 s. Arrowheads (red) mark the beginning or the end of the Dextran structure over time, while orange marks the cell membrane. (G) Dwell time of plasma membrane (PM) invaginations calculated from the various kymograph traces. Each data point represents the time each Dextran-filled structure spends attached to the cell membrane before it undergoes scission or disappears. Control, n = 145/N = 5; Gprk2-shRNA, n = 179/N = 4; β-arrestin-2-shRNA, n = 211/N = 4, where n = PM invaginations and N = number of embryos. (H) Illustration and images showing apical PM invaginations in embryos injected with Dextran-568 in different genetic backgrounds across different Z sections. p values are calculated by Mann-Whitney U test. Error bars depict SEM in (D) and (G). Scale bars, 1 μm. See also Figure S4.
Figure 5
Figure 5. Fog Induces Smog Homo-clusters
(A–F) Fog levels are reduced using fog-dsRNA compared to water injections. Fog concentration is increased using overexpression with UAS-fog12 and was compared to the appropriate controls. (A–C) density/concentration and (D–F) brightness of Smog::GFP particles are calculated in (A and D) controls, (B and E) Gprk2-KD, and (C and F) β-arrestin-2-KD embryos with change in the Fog concentration, fog-dsRNA (left) and UAS-fog12 (right). (G) Cartoon depicting the activation cycle of Smog::GFP. In here, an increase in Fog levels shifts the balance toward higher Smog homo-clusters. The activated Smog creates or diffuses to apical plasma membrane invaginations. If present, β-arrestin-2 mediates a rapid clathrin-mediated sequestering of activated Smog before or during its arrival into membrane invaginations and takes it to undergo endocytosis. Endocytosed Smog may be recycled back to the plasma membrane or is taken for degradation. p values are calculated by Mann-Whitney U test. FCS measurements made on control = 84 measurements, 20 cells from 6 embryos; Gprk2-KD = 99 measurements, 25 cells from 6 embryos; and β-arrestin-2-KD = 121 measurements, 30 cells from 7 embryos. yw (water) = 99 measurements, 20 cells from 5 embryos; Gprk2-KD (water) = 87 measurements, 26 cells from 5 embryos; β-arrestin-2-KD (water) = 152 measurements, 35 cells from 7 embryos. yw + fog dsRNA = 157 measurements, 30 cells from 6 embryos; Gprk2-KD + fog-dsRNA = 175 measurements, 43 cells from 8 embryos; β-arrestin-2-KD + fog-dsRNA = 97 measurements, 25 cells from 6 embryos. yw + UAS-fog = 118 measurements, 31 cells from 7 embryos; Gprk2-KD + UAS-fog = 112 measurements, 31 cells from 7 embryos; β-arrestin-2-KD + UAS-fog = 95 measurements, 25 cells from 5 embryos. All error bars depict SEM. See also Figure S7.
Figure 6
Figure 6. Plasma Membrane Invaginations Are Hubs for Active Rho1 Signaling
(A) Trace of cell showing plasma membrane invaginations in different Z sections, with co-localization between AniRBD::GFP and Dextran-647 (marked with red arrowhead) in control, Gprk2-shRNA, and β-arrestin-2-shRNA embryos. Scale bars, 1 μm. (B) Pixel-pixel correlation between the two selected channels of AniRBD::GFP and Dextran-647 in different genetic backgrounds after line scan analysis done on the plasma membrane invaginations. Several data point clouds are extracted from multiple embryos. The mean correlation coefficients with SEM (Pearson correlation) calculated for several data points of control, Gprk2-shRNA, and β-arrestin-2-shRNA are shown in graphic. Error bars depict SEM. (C) Tabular form (N = 4 embryos). (D) Schematic showing different tiers of Rho1 and Myosin activation regulation by Fog concentration and endocytosis. Low Fog concentration induces very low Rho1 signaling, whereas high Fog concentration activates high Rho1 signaling. Gprk2 and β-arrestin-2 attenuate Rho1 signaling by regulating Smog endocytosis. Reduced endocytosis induces the formation of apical plasma membrane invaginations and activates high Rho1 signaling.
Figure 7
Figure 7. Mesodermal Cells Have Large Plasma Membrane Invaginations
(A) Images showing time trace of presumptive mesoderm invagination tracked by Dextran-568 injection. Scale bars, 5 μm. (B) Example of a cell from presumptive mesoderm showing Z sections traced by Dextran-568 injection that shows the presence of apical membrane invaginations (marked by red arrowheads). Scale bars, 1 μm. (C) Cells showing localization of Dextran-568, Rab5::YFP, and merge in mesoderm with red arrowheads marking Rab5-labeled Dextran plasma membrane invaginations. (D) Image and graph showing differential regulation of plasma membrane invaginations in ectoderm and mesoderm by measuring size in pixels and looking at the frequency distribution. (E) Smog::GFP of control embryos are compared in ectoderm (gray) and mesoderm (red) for density (left) and brightness (right) and confocal images of the embryo showing Smog:GFP-labeled mesoderm before and after invagination. FCS analysis in Smog::GFP embryos from cells in the ectoderm was done from 84 measurements from 20 cells in 6 embryos and in the mesoderm from 118 measurements from 31 cells in 8 embryos. p values are calculated by Mann-Whitney U test. Error bars depict SEM.

Similar articles

Cited by

References

    1. Heisenberg C-P, Bellaïche Y. Forces in tissue morphogenesis and patterning. Cell. 2013;153:948–962. - PubMed
    1. Munjal A, Lecuit T. Actomyosin networks and tissue morphogenesis. Development. 2014;141:1789–1793. - PubMed
    1. Leptin M, Grunewald B. Cell shape changes during gastrulation in Drosophila. Development. 1990;110:73–84. - PubMed
    1. Dawes-Hoang RE, Parmar KM, Christiansen AE, Phelps CB, Brand AH, Wieschaus EF. folded gastrulation, cell shape change and the control of myosin localization. Development. 2005;132:4165–4178. - PubMed
    1. Martin AC, Kaschube M, Wieschaus EF. Pulsed contractions of an actin-myosin network drive apical constriction. Nature. 2009;457:495–499. - PMC - PubMed

Publication types

LinkOut - more resources