. 2018 May 7;16(1):47.
doi: 10.1186/s12915-018-0518-3.

Time-resolved transcriptome and proteome landscape of human regulatory T cell (Treg) differentiation reveals novel regulators of FOXP3

Affiliations

Time-resolved transcriptome and proteome landscape of human regulatory T cell (Treg) differentiation reveals novel regulators of FOXP3

Angelika Schmidt et al. BMC Biol. .

Abstract

Background: Regulatory T cells (Tregs) expressing the transcription factor FOXP3 are crucial mediators of self-tolerance, preventing autoimmune diseases but possibly hampering tumor rejection. Clinical manipulation of Tregs is of great interest, and first-in-man trials of Treg transfer have achieved promising outcomes. Yet, the mechanisms governing induced Treg (iTreg) differentiation and the regulation of FOXP3 are incompletely understood.

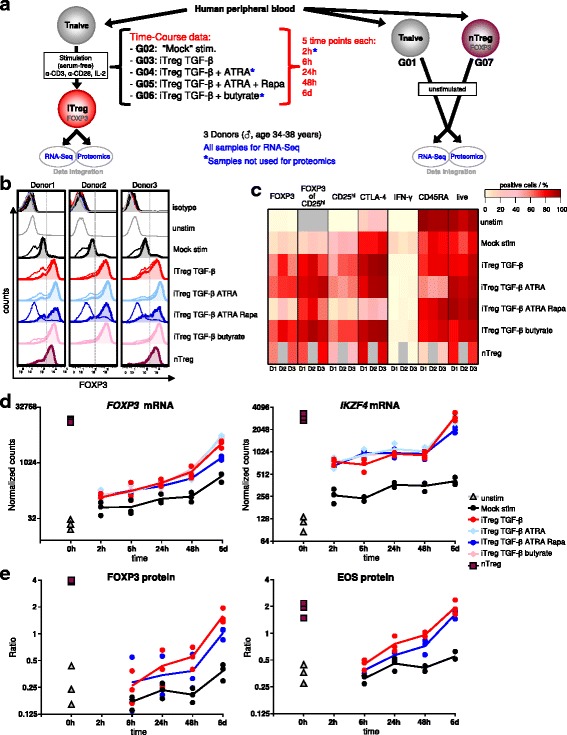
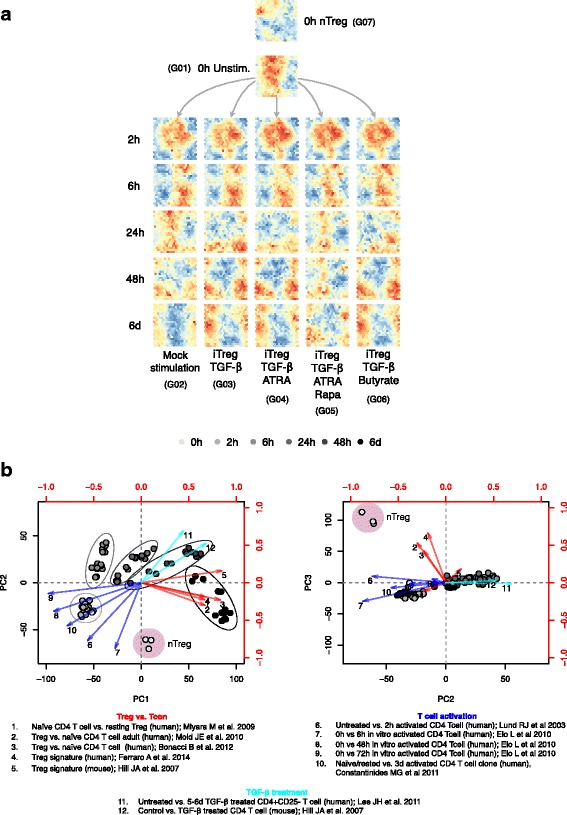
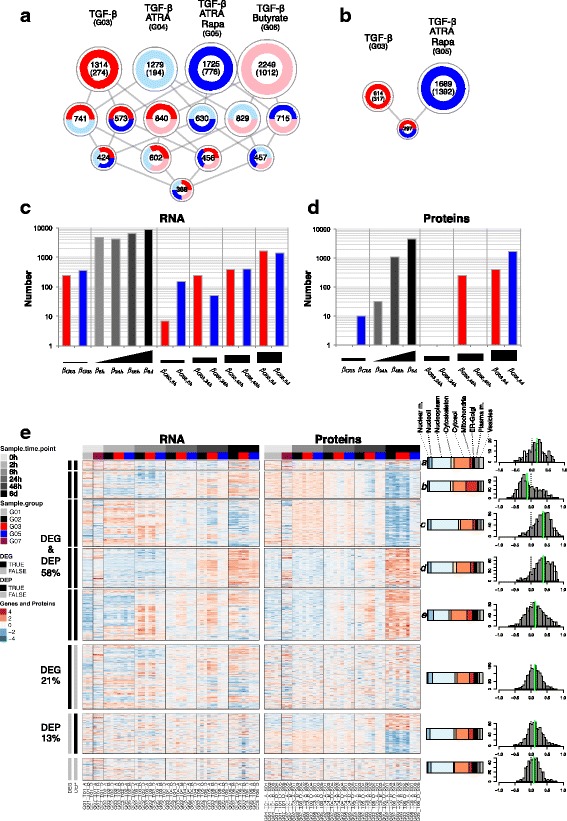
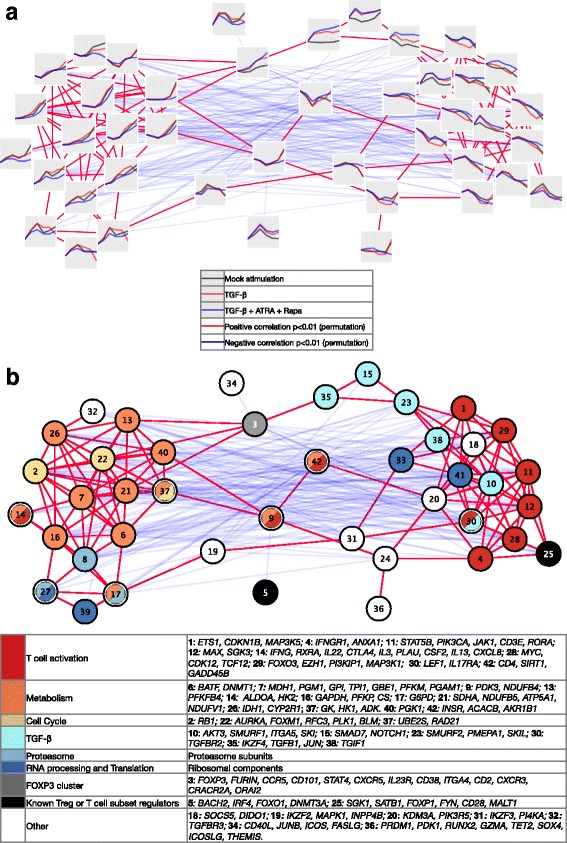
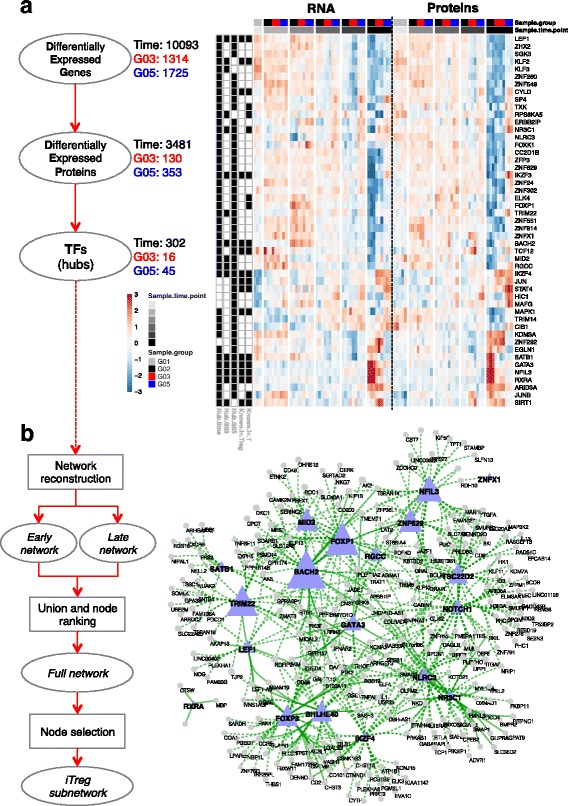
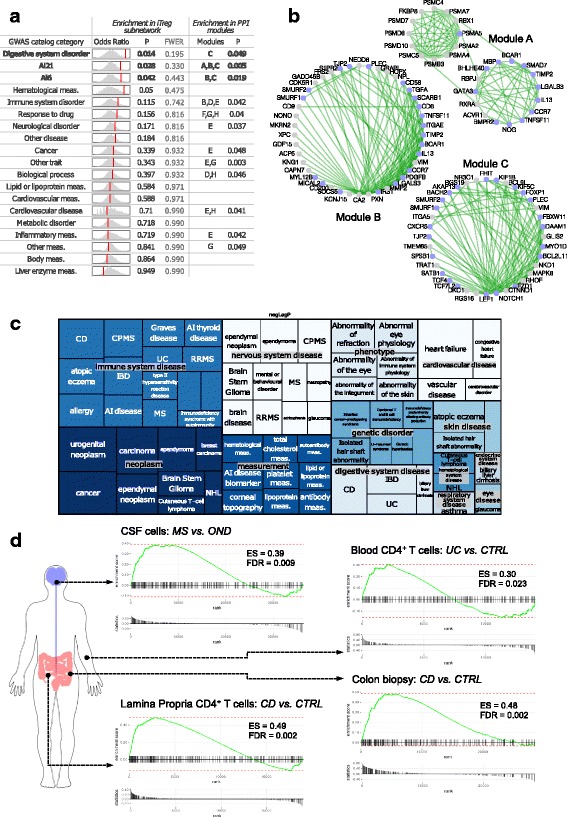
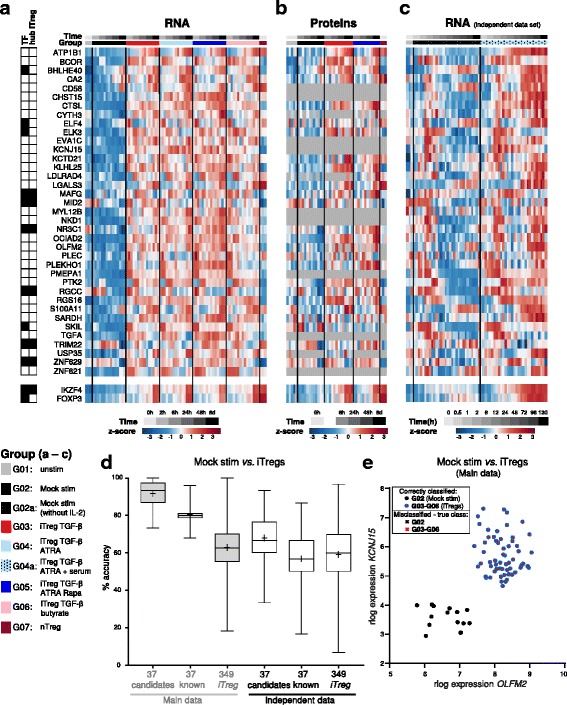
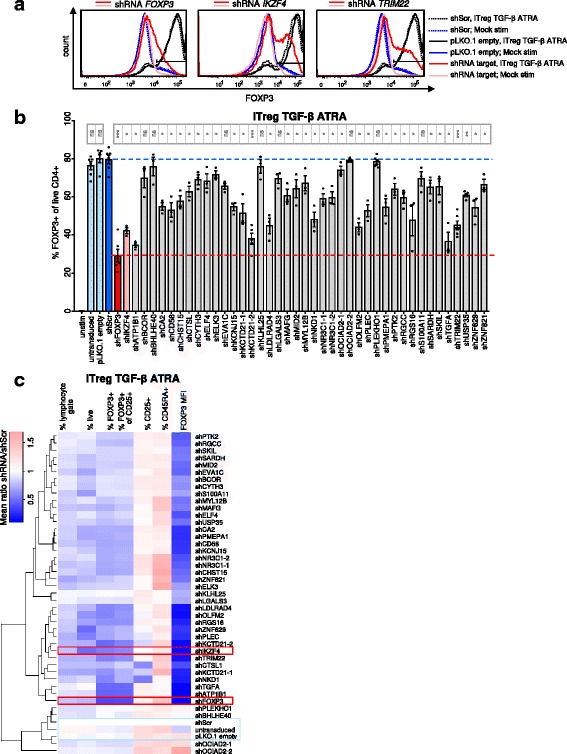
Results: To gain a comprehensive and unbiased molecular understanding of FOXP3 induction, we performed time-series RNA sequencing (RNA-Seq) and proteomics profiling on the same samples during human iTreg differentiation. To enable the broad analysis of universal FOXP3-inducing pathways, we used five differentiation protocols in parallel. Integrative analysis of the transcriptome and proteome confirmed involvement of specific molecular processes, as well as overlap of a novel iTreg subnetwork with known Treg regulators and autoimmunity-associated genes. Importantly, we propose 37 novel molecules putatively involved in iTreg differentiation. Their relevance was validated by a targeted shRNA screen confirming a functional role in FOXP3 induction, discriminant analyses classifying iTregs accordingly, and comparable expression in an independent novel iTreg RNA-Seq dataset.

Conclusion: The data generated by this novel approach facilitates understanding of the molecular mechanisms underlying iTreg generation as well as of the concomitant changes in the transcriptome and proteome. Our results provide a reference map exploitable for future discovery of markers and drug candidates governing control of Tregs, which has important implications for the treatment of cancer, autoimmune, and inflammatory diseases.

Keywords: Data integration; FOXP3; Proteomics; RNA sequencing (RNA-Seq); Regulatory T cells; T cell differentiation; TGF-β; Treg; iTreg.


Conflict of interest statement

Ethics approval and consent to participate

The experimental methods comply with the Declaration of Helsinki and ethical approval was obtained as appropriate and is detailed in the respective Methods sections.

Competing interests

CCG received speaker honoraria and travel expenses for attending meetings from Bayer Health Care, Genzyme, and Novartis Pharma GmbH and her research is funded by the Interdisciplinary Center for Clinical Studies (IZKF). HW receives honoraria for acting as a member of Scientific Advisory Boards and as consultant for Biogen, Evgen, MedDay Pharmaceuticals, Merck Serono, Novartis, Roche Pharma AG, Sanofi-Genzyme, as well as speaker honoraria and travel support from Alexion, Biogen, Cognomed, F. Hoffmann-La Roche Ltd., Gemeinnützige Hertie-Stiftung, Merck Serono, Novartis, Roche Pharma AG, Sanofi-Genzyme, TEVA, and WebMD Global. HW is acting as a paid consultant for Abbvie, Actelion, Biogen, IGES, Novartis, Roche, Sanofi-Genzyme, and the Swiss Multiple Sclerosis Society. HW received research funding from the Else Kröner Fresenius Foundation, Fresenius Foundation, Hertie Foundation, NRW Ministry of Education and Research, IZKF Muenster and RE Children’s Foundation, Biogen GmbH, GlaxoSmithKline GmbH, Roche Pharma AG, and Sanofi-Genzyme.

The funders had no role in study design, data collection and analysis, decision to publish, or preparation of the manuscript.

All other authors declare no competing interests.

Publisher’s Note

Springer Nature remains neutral with regard to jurisdictional claims in published maps and institutional affiliations.

Figures

Fig. 1
Fig. 1
Treg signature molecules confirm the quality of iTreg and control cells used for molecular profiling. a Human naïve CD4+ T cells were stimulated (‘stim.’) with anti-CD3/-CD28 antibodies and IL-2 for up to 6 days in serum-free medium. For iTreg generation, TGF-β1, rapamycin (Rapa), all-trans retinoic acid (ATRA), or butyrate were added. At indicated time points (h: hours, d: days), RNA and protein were extracted for RNA-Seq and proteomics. Unstimulated (‘unstim.’) nTregs (ex vivo CD25high cells) were used as a positive control, unstimulated naïve CD4+ T cells were used as the ‘time zero’ control, both harvested on the day of isolation. G01–G07: Treatment group abbreviations. b, c Cultures as in (a), except unstimulated cells cultured in medium (+ IL-2) for 6 days. On day 6, an aliquot was re-stimulated for 4 h with phorbol 12-myristate 13-acetate/ionomycin plus Brefeldin A, stained for the given surface and intracellular markers and analyzed by flow cytometry. b Histograms for FOXP3 are shown for individual molecular profiling donors. Pre-gating: live CD4 + CD25++ cells (filled histograms) or live CD4+ cells (open histograms). ‘isotype’: anti-FOXP3 antibody isotype staining for each sample colored as beneath. Grey dashed lines: gate to determine FOXP3+ cell fraction; corresponding values are displayed in (c). c Expression of flow cytometry markers, gated on viable CD4+ cells (except for last three columns depicting live cell fraction, and columns 4–6, which are gated on live CD4 + CD25++ cells). The percentage of positive cells for the given marker is indicated by the color scale, columns show individual donors (D1, D2, D3). Grey indicates samples not measured or not applicable markers. FOXP3 and IKZF4 (Eos) expression from RNA-Seq (d) and proteomics (e) data, respectively. Dots: individual donors (mean per donor for proteomics samples with technical replicates), lines: mean of n = 3 donors. Statistical analysis, see Methods and Additional file 3: Table S2
Fig. 2
Fig. 2
Global transcriptomic analysis gives a ‘bird’s-eye’ view of iTreg polarization and temporal gene expression architecture. a Self-organizing map (SOM) analysis of transcriptome data from Mock-stimulated (control) or iTreg cells induced by the indicated protocols shows the topology of the polarization at the transcript level. The panels are pseudo-colored SOMs from different time points (0, 2, 6, 24, and 48 h, and 6 days). The colors correspond to the average RNA expression levels (z-score) of the genes contained on each hexagonal cell (blue: low, red: high). The effect of the activation is predominant, but treatment differences become evident after 1 day of culture. b Principal component analysis differentiates the samples on the basis of the activation time and treatment; ellipses highlight samples from the same time point. Arrows correspond to selected gene signatures that correlate significantly with the first three principal components (PCs) (p < 10− 6 in either PC1, PC2 or PC3; Additional file 2: Table S1) and belonging to different functional categories (red: Treg vs. Tcon; blue: T cell activation; cyan: TGF-β treatment). PC scores are shown on the bottom and left axes, while top and right axes show the Pearson coefficient of each gene signature with the corresponding PC. The text on the bottom specifies the reference for each numbered signature (Additional file 2: Table S1)
Fig. 3
Fig. 3
Differential gene and protein expression analysis during iTreg polarization. Differential expression was modeled over time (activation effect) and specific for iTreg induction (group effect). Group abbreviations: G01, Unstimulated naïve CD4+ T cells; G02, Mock-stimulated cells; G03, iTreg TGF-β; G04, iTreg TGF-β + ATRA; G05, iTreg TGF-β + ATRA + Rapa; G06, iTreg TGF-β + butyrate; G07, unstimulated nTreg. a DEGs in iTreg groups compared to Mock control in at least one time point or at baseline are counted. Number of DEGs in each condition or shared between iTreg conditions (see color code) is indicated and proportional to the circle size; numbers in parentheses are exclusive DEGs per condition. b DEPs in iTreg conditions compared to control are counted. Numbers of exclusive DEPs (in parentheses) or shared in the two iTreg conditions are shown. The number of (c) DEGs (FDR < 0.01) or (d) DEPs (FDR < 0.05) is shown for each of the indicated coefficients (grey-black: activation effect; red, blue: group effect) on a statistical model with time as a discrete factor. e A heatmap of RNA and protein data is shown for the genes detected at both levels. The expression is shown as separate RNA (regularized log (rlog)-transformed counts) or protein (log2R) z-score (blue: low; red: high). Black bars to the left indicate differential expression. Hierarchical clustering was performed separately for the indicated four blocks using RNA and protein data and clusters were obtained for the DEG and DEP blocks (see Methods). A, B, D: Donor 1, 2, 3; S01–S05: TMT set. Colored bars on the right show the relative fraction of the cellular compartments for the proteins with available data. Histograms show the distribution of the Spearman correlation; green line marks the median value
Fig. 4
Fig. 4
Clusters of genes show the functional dynamics of gene expression during iTreg differentiation. Model-based cluster analysis of gene expression reveals that the transcriptional profiles are functionally super-organized in concordant modules with functional similarity and show the molecular footprint of T cell activation and iTreg polarization. All DEGs in iTreg + TGF-β or iTreg + TGF-β + ATRA + Rapa compared to Mock-stimulated cells were considered. In (a), the average gene expression of the 42 clusters is shown after rlog transformation (x-axis: time; y-axis: average rlog-transformed RNA-Seq counts), with a colored line corresponding to the treatment group as shown in the legend. Each cluster is connected with a line to the clusters correlated positively (red) or negatively (blue), after permutation analysis (Spearman, p < 0.01). In (b), a functional category is assigned to the same clusters after gene ontology and pathway enrichment analysis. Bottom: the corresponding color legend and representative genes are given
Fig. 5
Fig. 5
Treg factors represent hubs in a core network of known and novel genes with regulatory potential. A hub-centered approach was employed to reconstruct a gene co-expression network and the temporal rewiring of the nodes. a Hubs were defined as TFs which were DEGs and DEPs (see Methods). Numbers correspond to the counts of selected features at each step. A heatmap shows the relative gene (rlog counts) and protein (log2R) expression (z-score) for the hubs differentially expressed in iTregs (G03: TGF-β and/or G05: TGF-β + ATRA + Rapa). Abbreviations and color codes as in Fig. 3. Black boxes to the left of the heatmap indicate whether the given TF is differentially expressed over time (‘hub.time’) or in iTregs (‘Hub.G03’ or ‘Hub.G05’) in at least one time point; the gene has a known role in T cells or specifically Tregs (‘Known.in.T’ or ‘Known.in.Treg’). b Two networks were reverse-engineered using the early or late time point samples, then, a rewiring score was calculated for each node by comparing them (see Methods, Additional file 1: Figure S6b, c, Additional file 5: Table S4). Shown is the sub-network of nodes that were modeled as DEGs in all four iTreg conditions, in addition to FOXP3. A triangle marks TFs. Light blue nodes correspond to the hubs and their size is proportional to the rewiring score. A green continuous line marks the edges with support from a TF:target gene network built from ENCODE data (see Methods). Unconnected nodes are not displayed
Fig. 6
Fig. 6
The iTreg subnetwork is linked to common autoimmune diseases. The selected iTreg subnetwork (see Fig. 5) was tested for connection with diseases using multiple public sources of annotation. a, b The enrichment of the GWAS catalog disease categories in addition to two categories of autoimmune diseases (Ai6 and Ai21, see Results text) is shown. For each category, the null distribution of the odds ratios (ORs) obtained with 10,000 random gene sets from the full network is shown as a histogram and the observed OR with a vertical red line. The categories in bold have a resampling-based p value of < 0.05. The resampled OR null distribution was used to calculate a FWER using the step-down minimum p value procedure. Enrichment in PPI modules is shown for categories with a nominal p value of < 0.05 (Fisher’s exact test), and 119 hypotheses were tested. The modules from a PPI network are given for the corresponding enriched categories and three PPI modules associated to the top three enriched in iTreg subnetwork disease categories are displayed in (b). Light blue nodes correspond to genes with an associated SNP in the GWAS catalog. c The treemap shows the enrichment p values of the indicated Open Target categories for the iTreg subnetwork. Only disease associations with nominal p < 0.05 are shown. The size of the square is proportional to the –log10(p) and disease types are grouped by therapeutic areas. d Gene Set Enrichment Analysis (see Methods) confirms that the iTreg subnetwork gene set is positively enriched in the ranked list obtained when comparing gene expression in CD4+ T cells from gastrointestinal tissue or blood of inflammatory bowel disease patients (UC or CD as indicated) or from cerebrospinal fluid (CSF) of MS patients compared to controls. CTRL: control, symptomatic or healthy; OND: other neurological disease; ES: enrichment score
Fig. 7
Fig. 7
Molecular profiling reveals known and novel Treg regulators. Novel ‘candidate’ molecules putatively involved in FOXP3 induction were selected, along with ‘known’ Treg regulators as control (see text and Additional file 1: Figure S7a, b). ac Expression profile of novel iTreg candidate molecules. IKZF4 (Eos) and FOXP3 are shown for comparison. Labels as in Figs. 1 and 5. a Candidate gene mRNA counts were rlog-transformed, and row-normalized z-scores are displayed (blue: low, red: high expression). b iTreg candidate protein expression (log2R). Grey cells: the protein was not detected in the respective sample. c iTreg candidate gene expression from an additional, completely independent RNA-Seq dataset is displayed and analyzed as in (a). iTregs were cultured with TGF-β + ATRA + serum, and additional time points were measured. d, e In silico validation of novel candidate molecules for iTreg classification. d Linear discriminant analysis (LDA) with all possible combinations of two genes out of ‘37 candidates’, ‘37 known’ Treg, or 349 nodes in the iTreg subnetwork (‘349 iTreg’) lists, followed by group classification. Grey boxplots show the cross-validated accuracy of classifiers regarding discrimination of Mock-stimulated (G02) vs. iTregs generated with either protocol (G03–G06) in the Main dataset. White boxplots show results from LDA analyses performed in the same way, but for discrimination of Mock-stimulated cells (G02a) vs. iTregs (G04a) in the independent dataset. Whiskers: min. to max. Value; + mean value; n = 1332, 1332 and 121,452 pairs for ‘37 candidates’, ‘37 known’, and ‘349 iTreg’, respectively. The adjusted p value was ≤ 0.0001 by Kruskal–Wallis test with Dunn’s multiple comparison test for each vs. each boxplot. e Example of two candidate genes (top classifiers) which separate Mock cells from iTregs in the Main dataset with 100% accuracy (0% error) in LDA
Fig. 8
Fig. 8
Experimental validation of novel candidate molecules regulating FOXP3+ Tregs. ac 37 novel candidate genes with a putative role in Treg induction were chosen for a targeted shRNA validation screen. Transduced or ‘untransduced’ primary CD4+ T cells were cultured under iTreg conditions (TGF-β + ATRA), or left unstimulated (‘unstim’), and then stained for FOXP3 and other markers. a FOXP3 histograms for T cells transduced with shRNA targeting FOXP3, IKZF4, or the candidate gene TRIM22 (red lines). Black and blue lines: negative control shRNA (shScr), empty vector (pLKO.1 empty). A representative donor of 3 (IKZF4) or 6 (FOXP3, TRIM22) is shown. b FOXP3 expression (gated on live CD4+ cells) in iTregs transduced with shRNA targeting candidate genes (grey bars; ‘–1’ and ‘–2’ indicate two independent shRNA pools). Blue, red bars: negative, positive controls. Displayed are mean ± SEM values, each dot represents an individual T cell donor (n = 3–6 donors from two independent experiments). FDR-adjusted p values (two-sided t test shRNA vs. shScr paired within a donor) are labeled as follows: ns p > 0.05; * p < 0.05; ** p < 0.01; *** p < 0.001; **** p < 0.0001. c FOXP3 and other flow cytometry markers in shRNA-transduced iTregs as in (b). The ratio of each marker relative to shScr-transduced cells of the same donor was calculated, and mean values of n = 3–6 donors are indicated by the color scale. It was pre-gated on live lymphocytes except for % lymphocyte gate and % live parameters. MFI median fluorescence intensity. Hierarchical clustering: complete linkage based on Euclidian distance

Similar articles

Cited by

References

    1. Yadav M, Stephan S, Bluestone JA. Peripherally induced tregs - role in immune homeostasis and autoimmunity. Front Immunol. 2013;4:232. - PMC - PubMed
    1. Schmitt EG, Williams CB. Generation and function of induced regulatory T cells. Front Immunol. 2013;4:152. - PMC - PubMed
    1. Haribhai D, Williams JB, Jia S, Nickerson D, Schmitt EG, Edwards B, et al. A requisite role for induced regulatory T cells in tolerance based on expanding antigen receptor diversity. Immunity. 2011;35:109–122. - PMC - PubMed
    1. Ramsdell F, Ziegler SF. FOXP3 and scurfy: how it all began. Nat Rev Immunol. 2014;14:343–349. - PubMed
    1. Delacher M, Schreiber L, Richards DM, Farah C, Feuerer M, Huehn J. Transcriptional control of regulatory T cells. Curr Top Microbiol Immunol. 2014;381:83–124. - PubMed

Publication types

MeSH terms